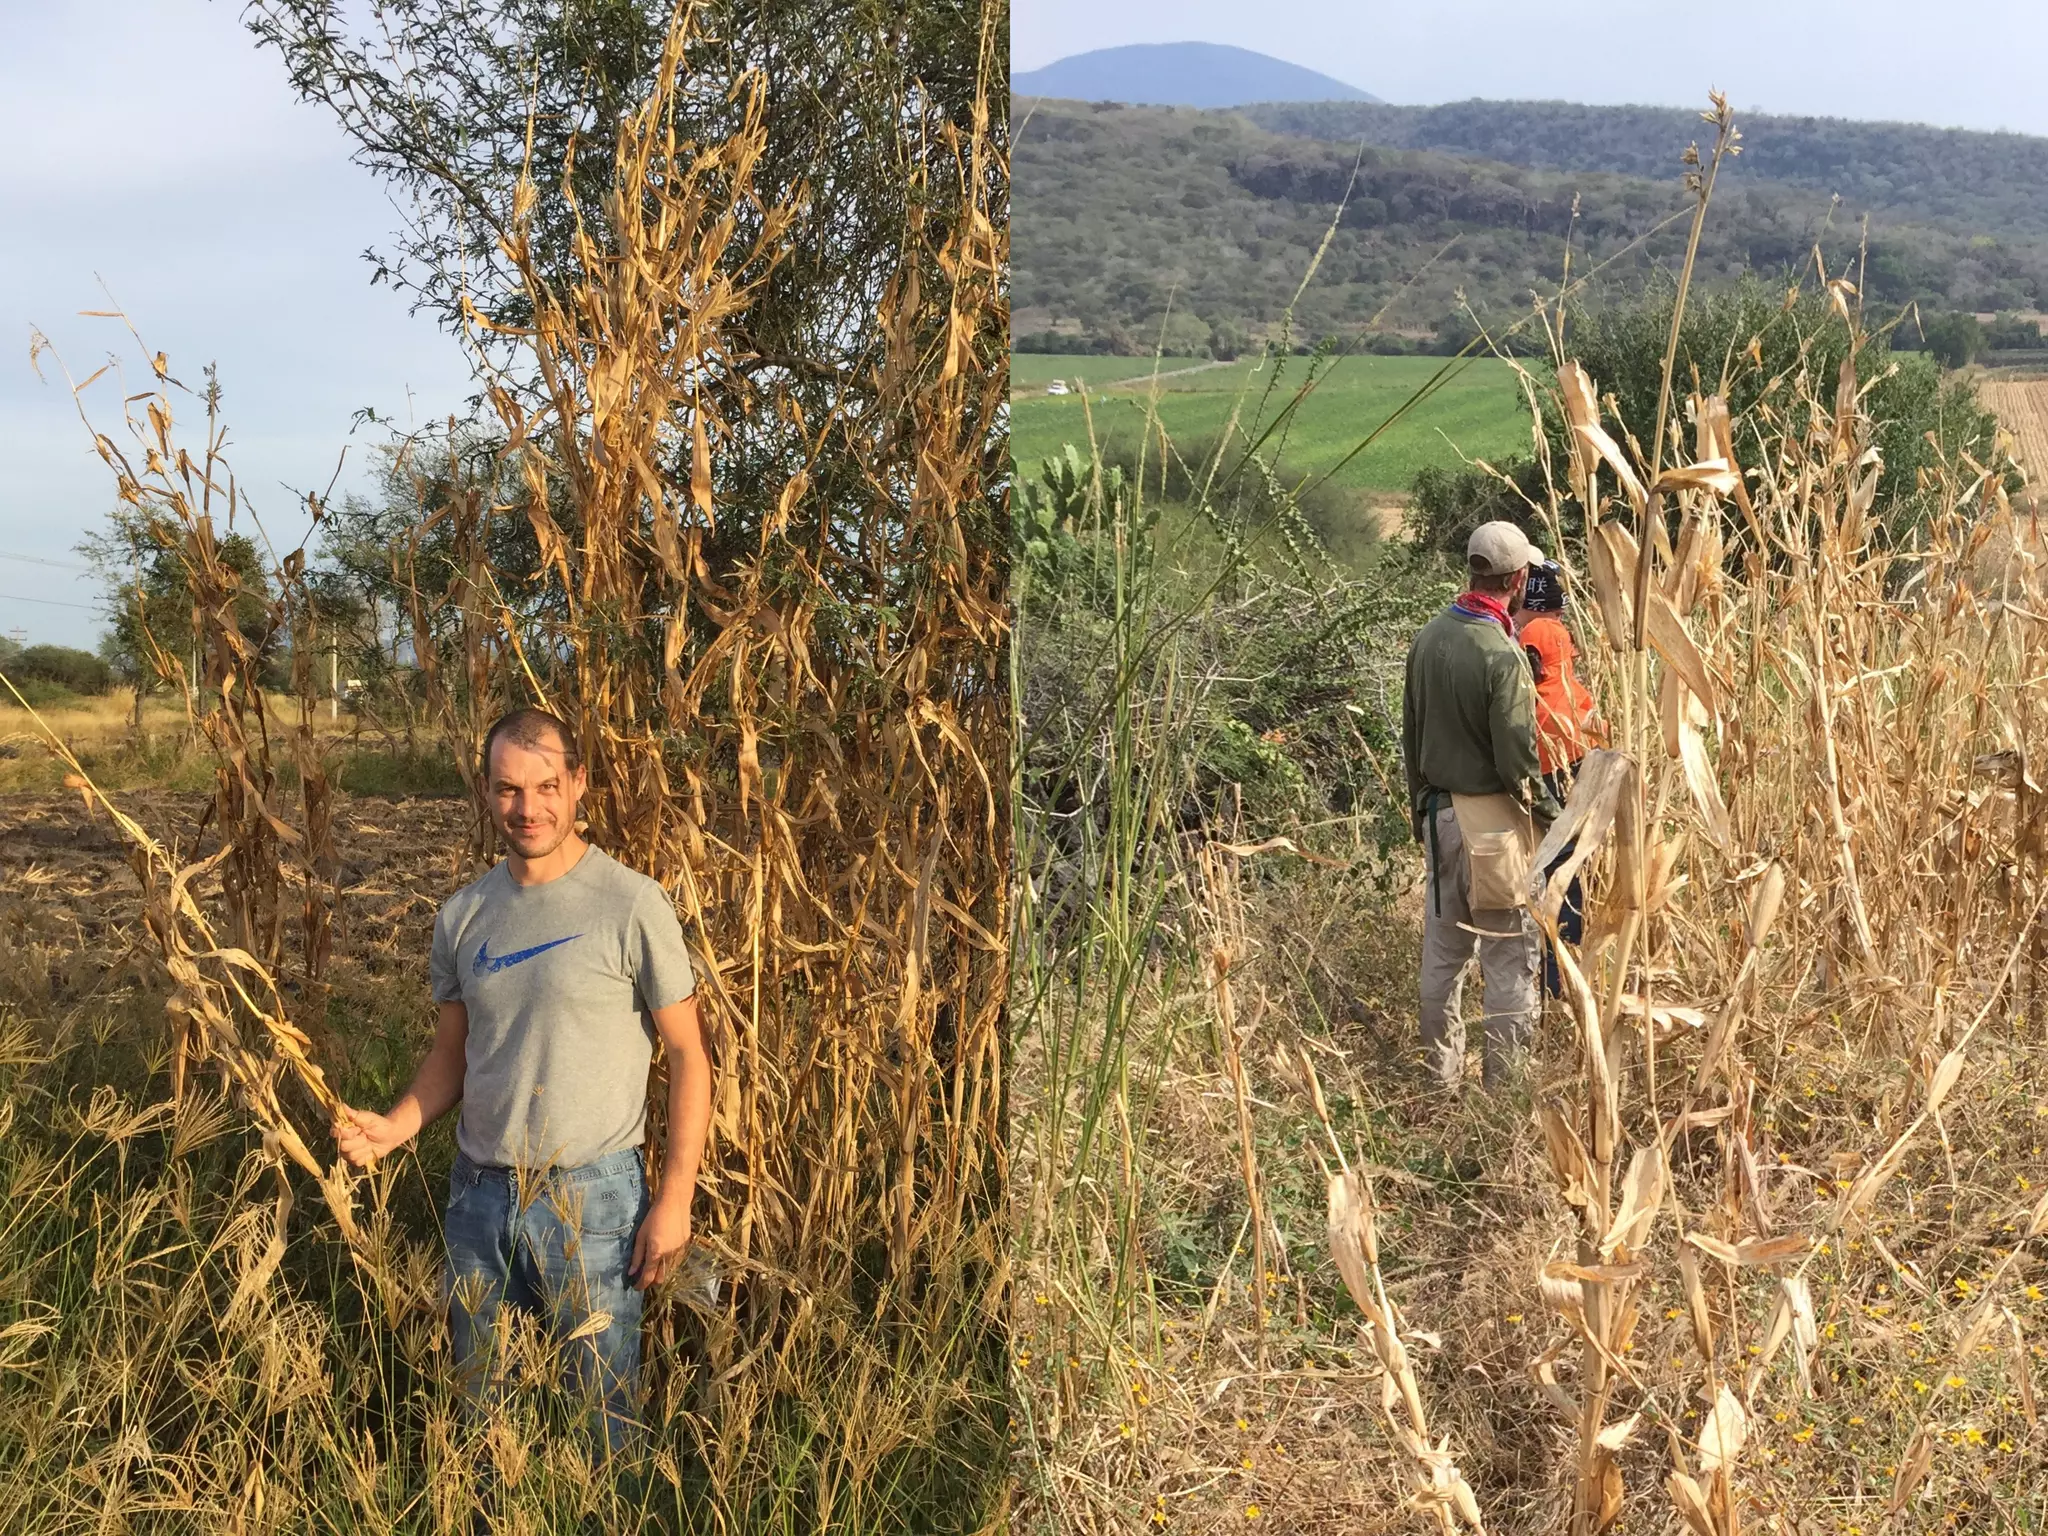
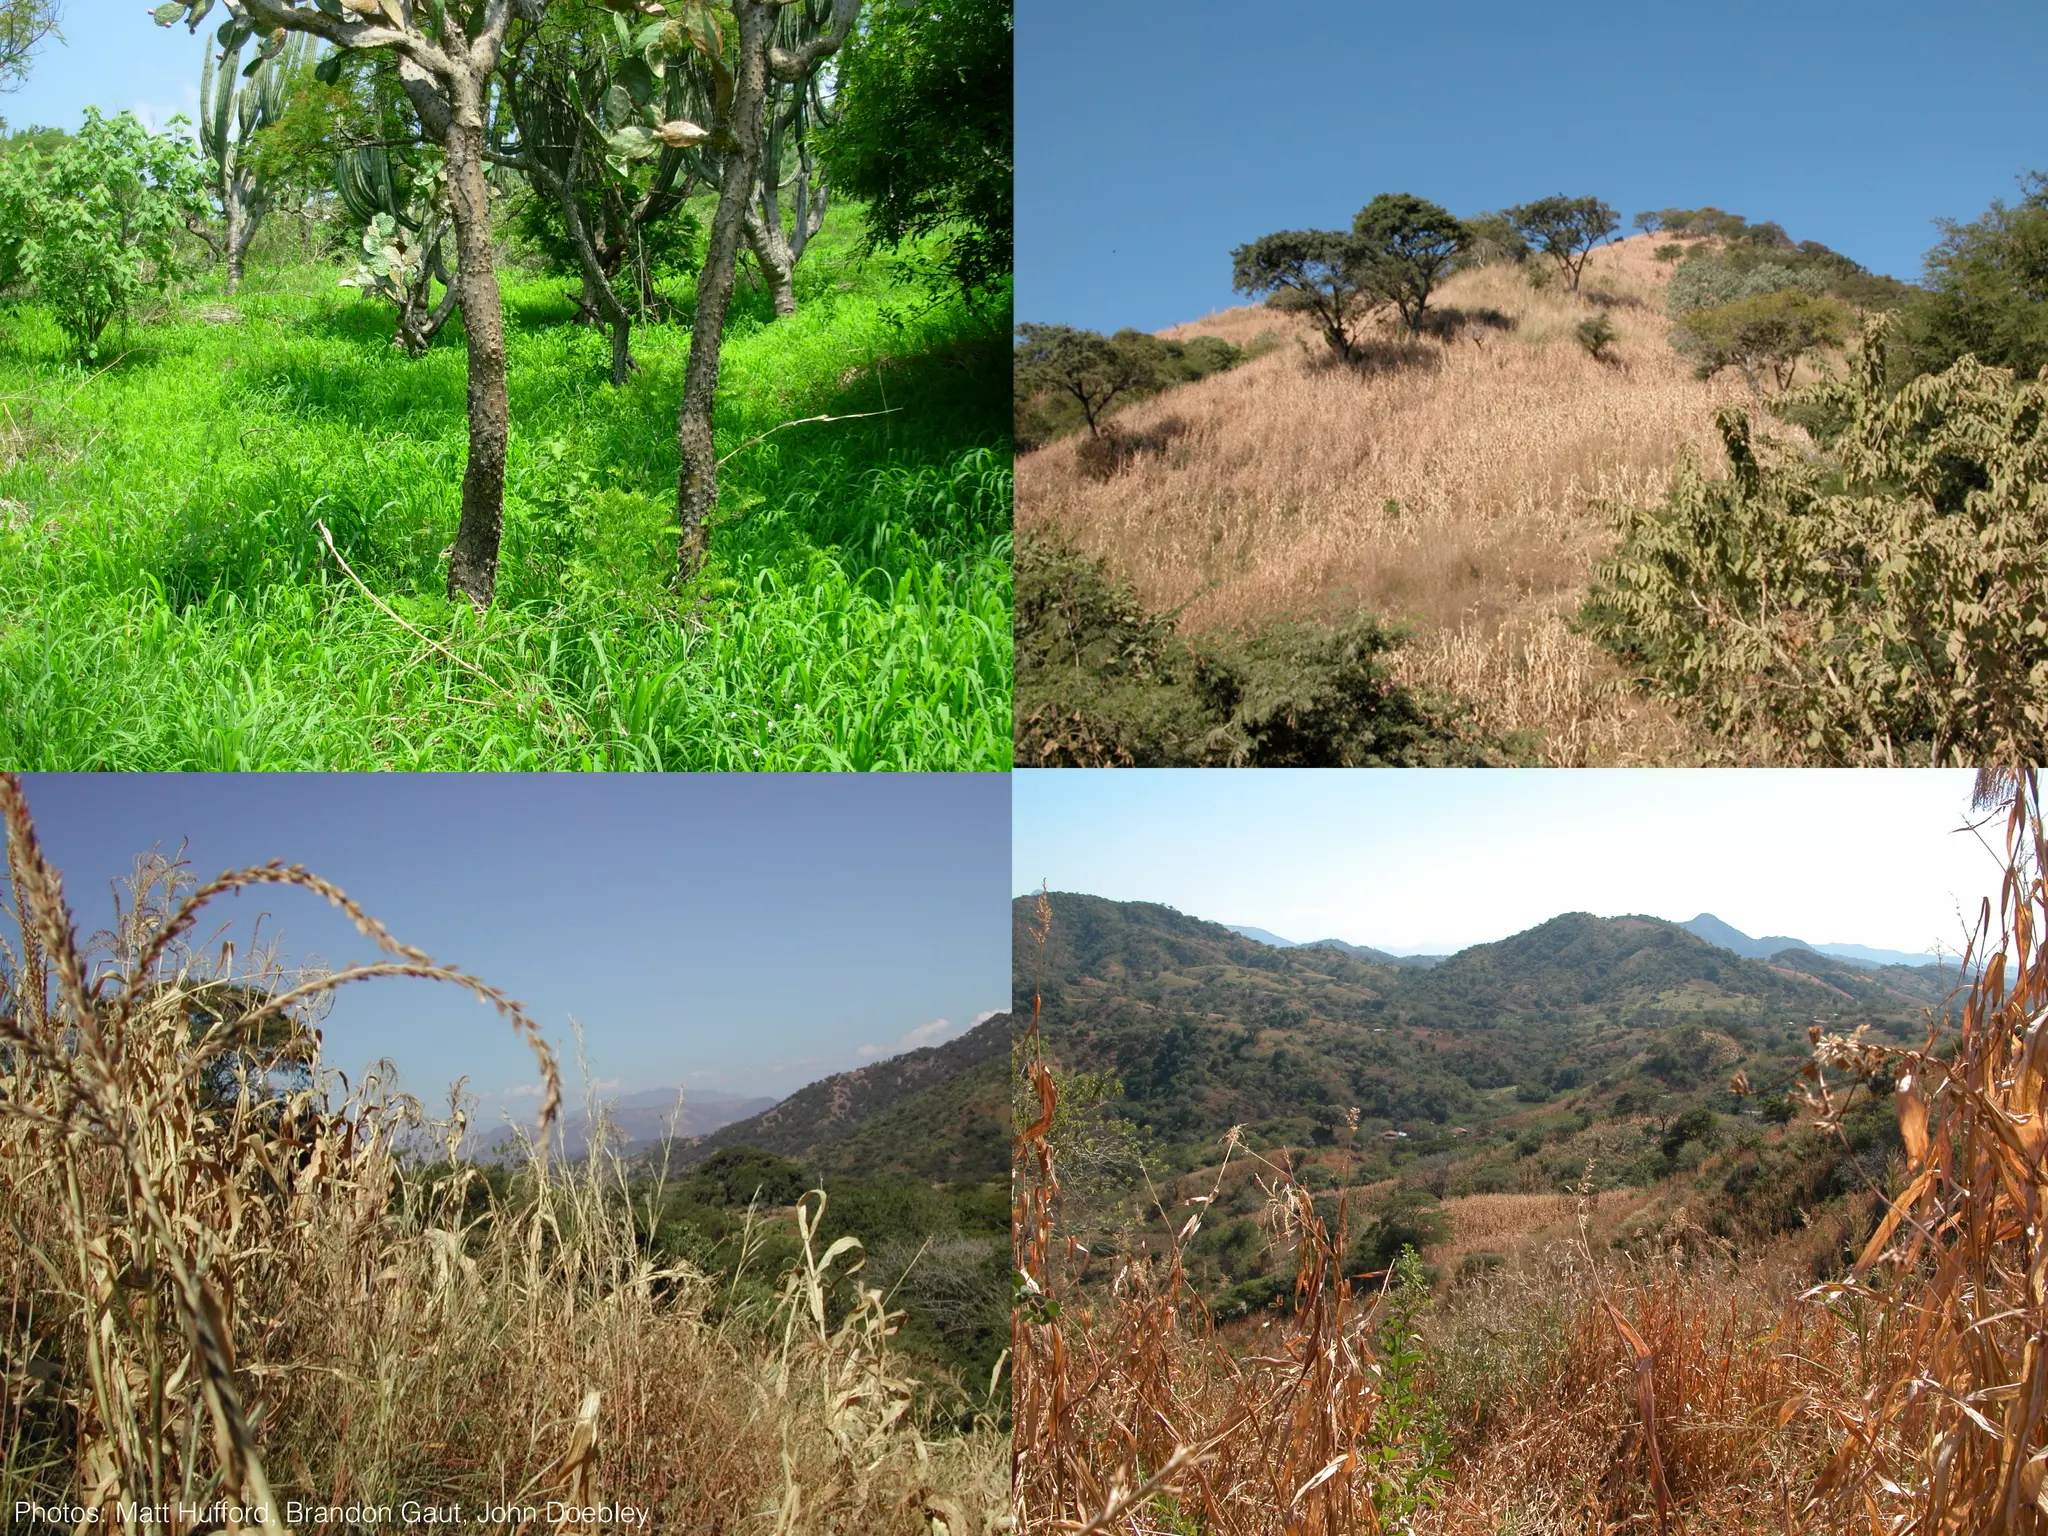
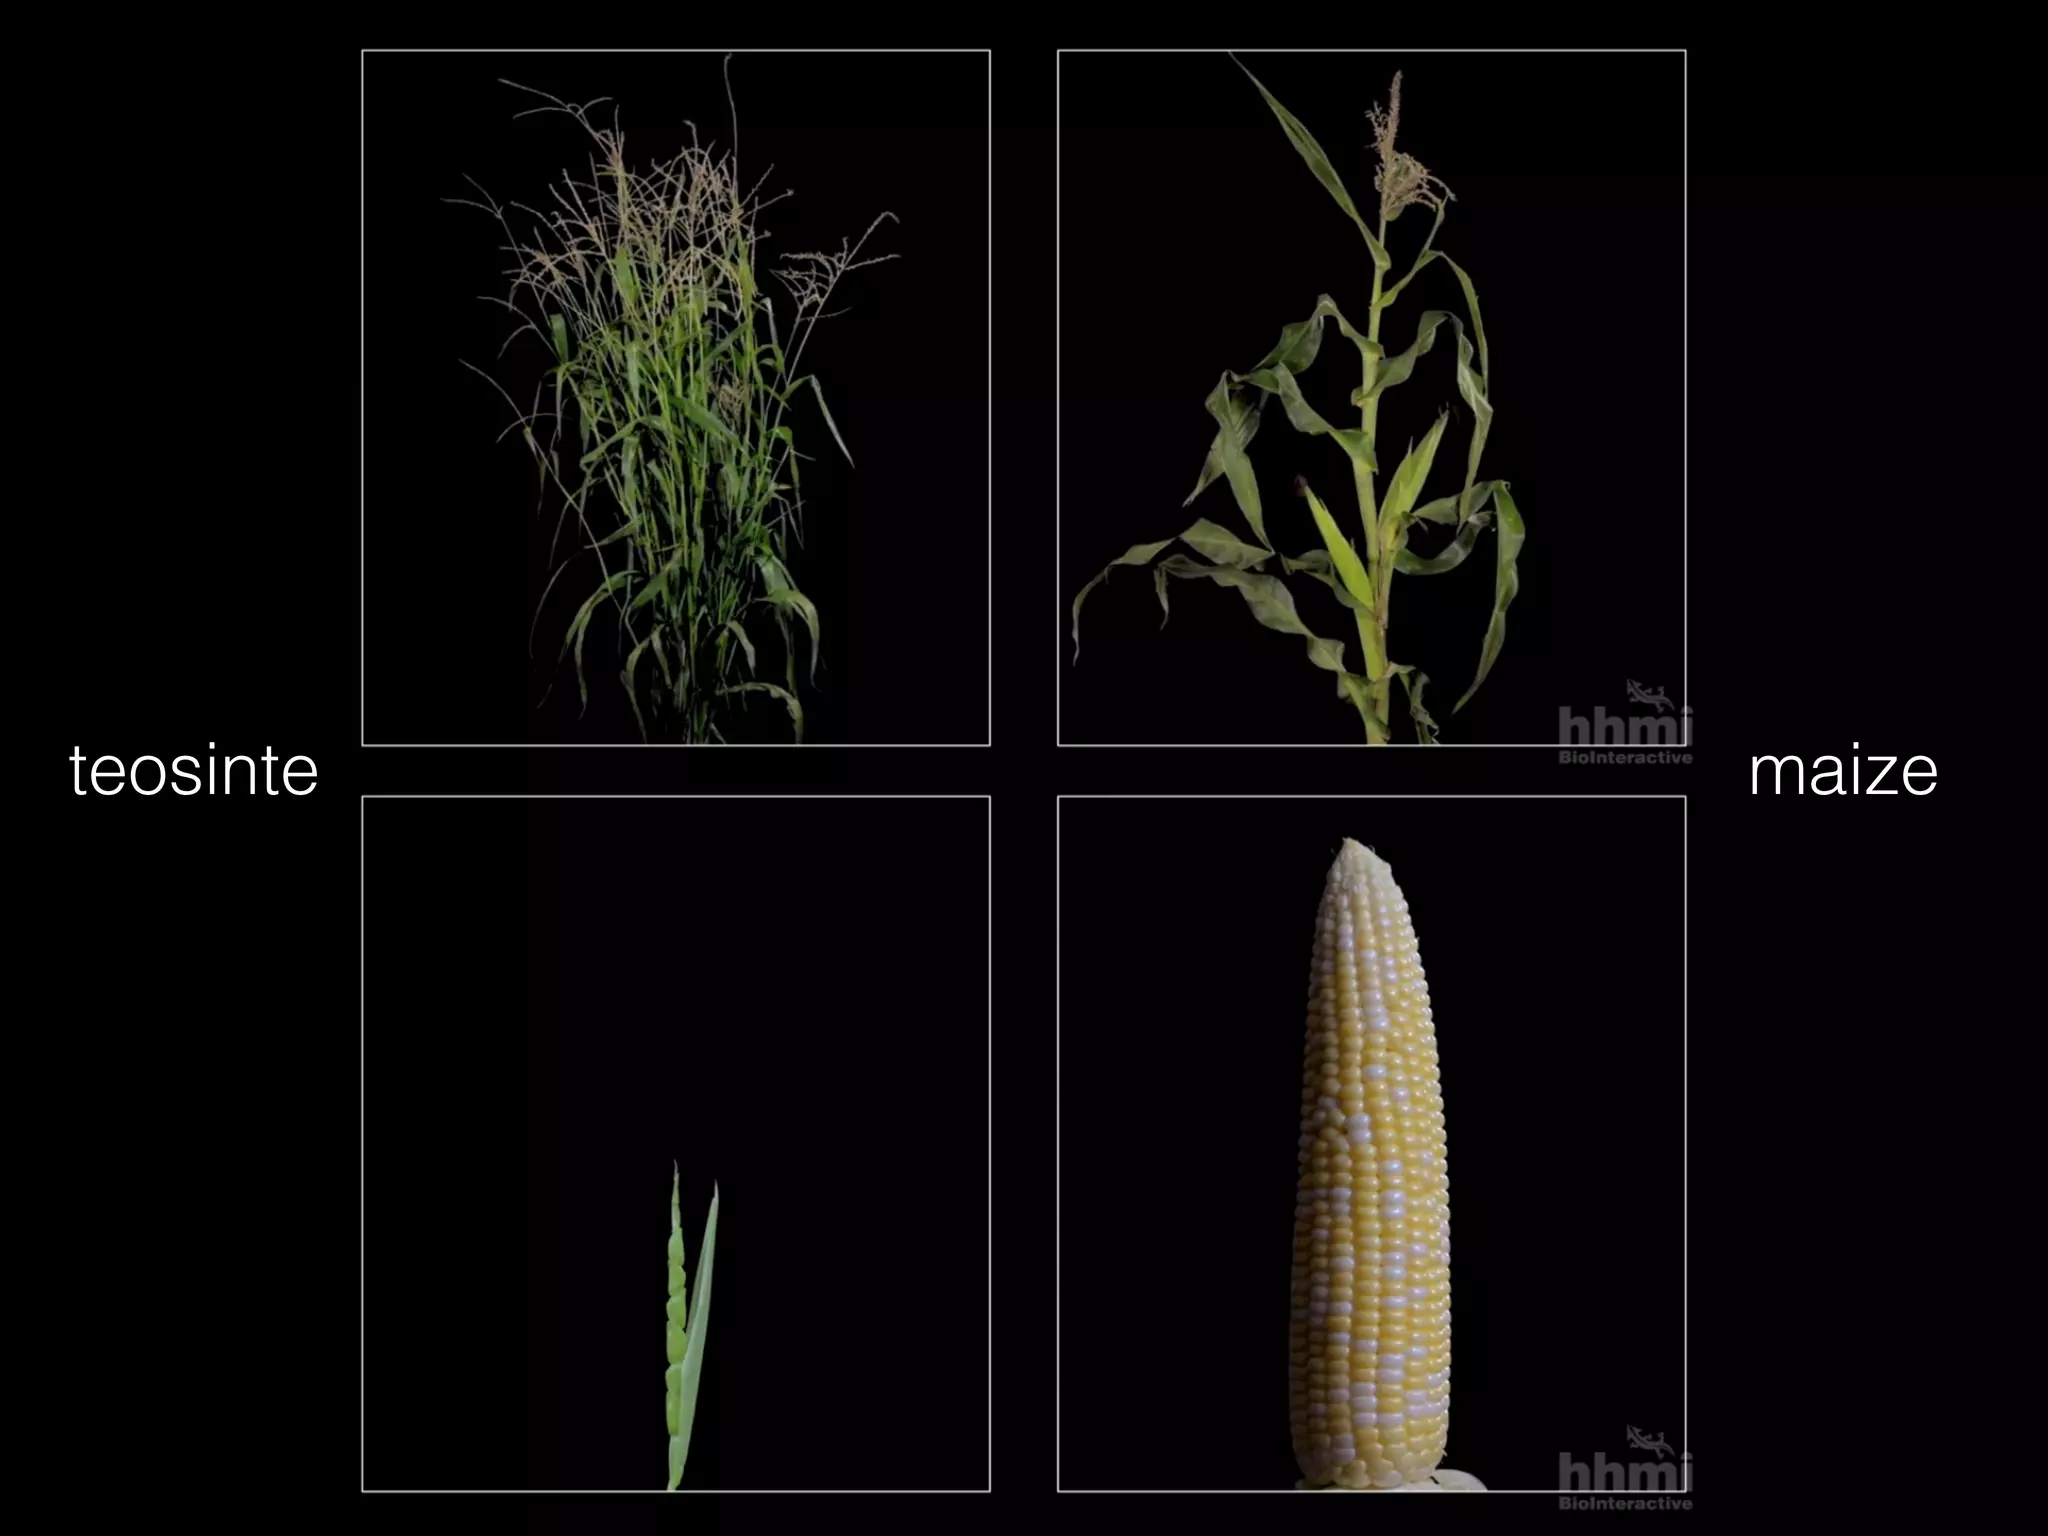
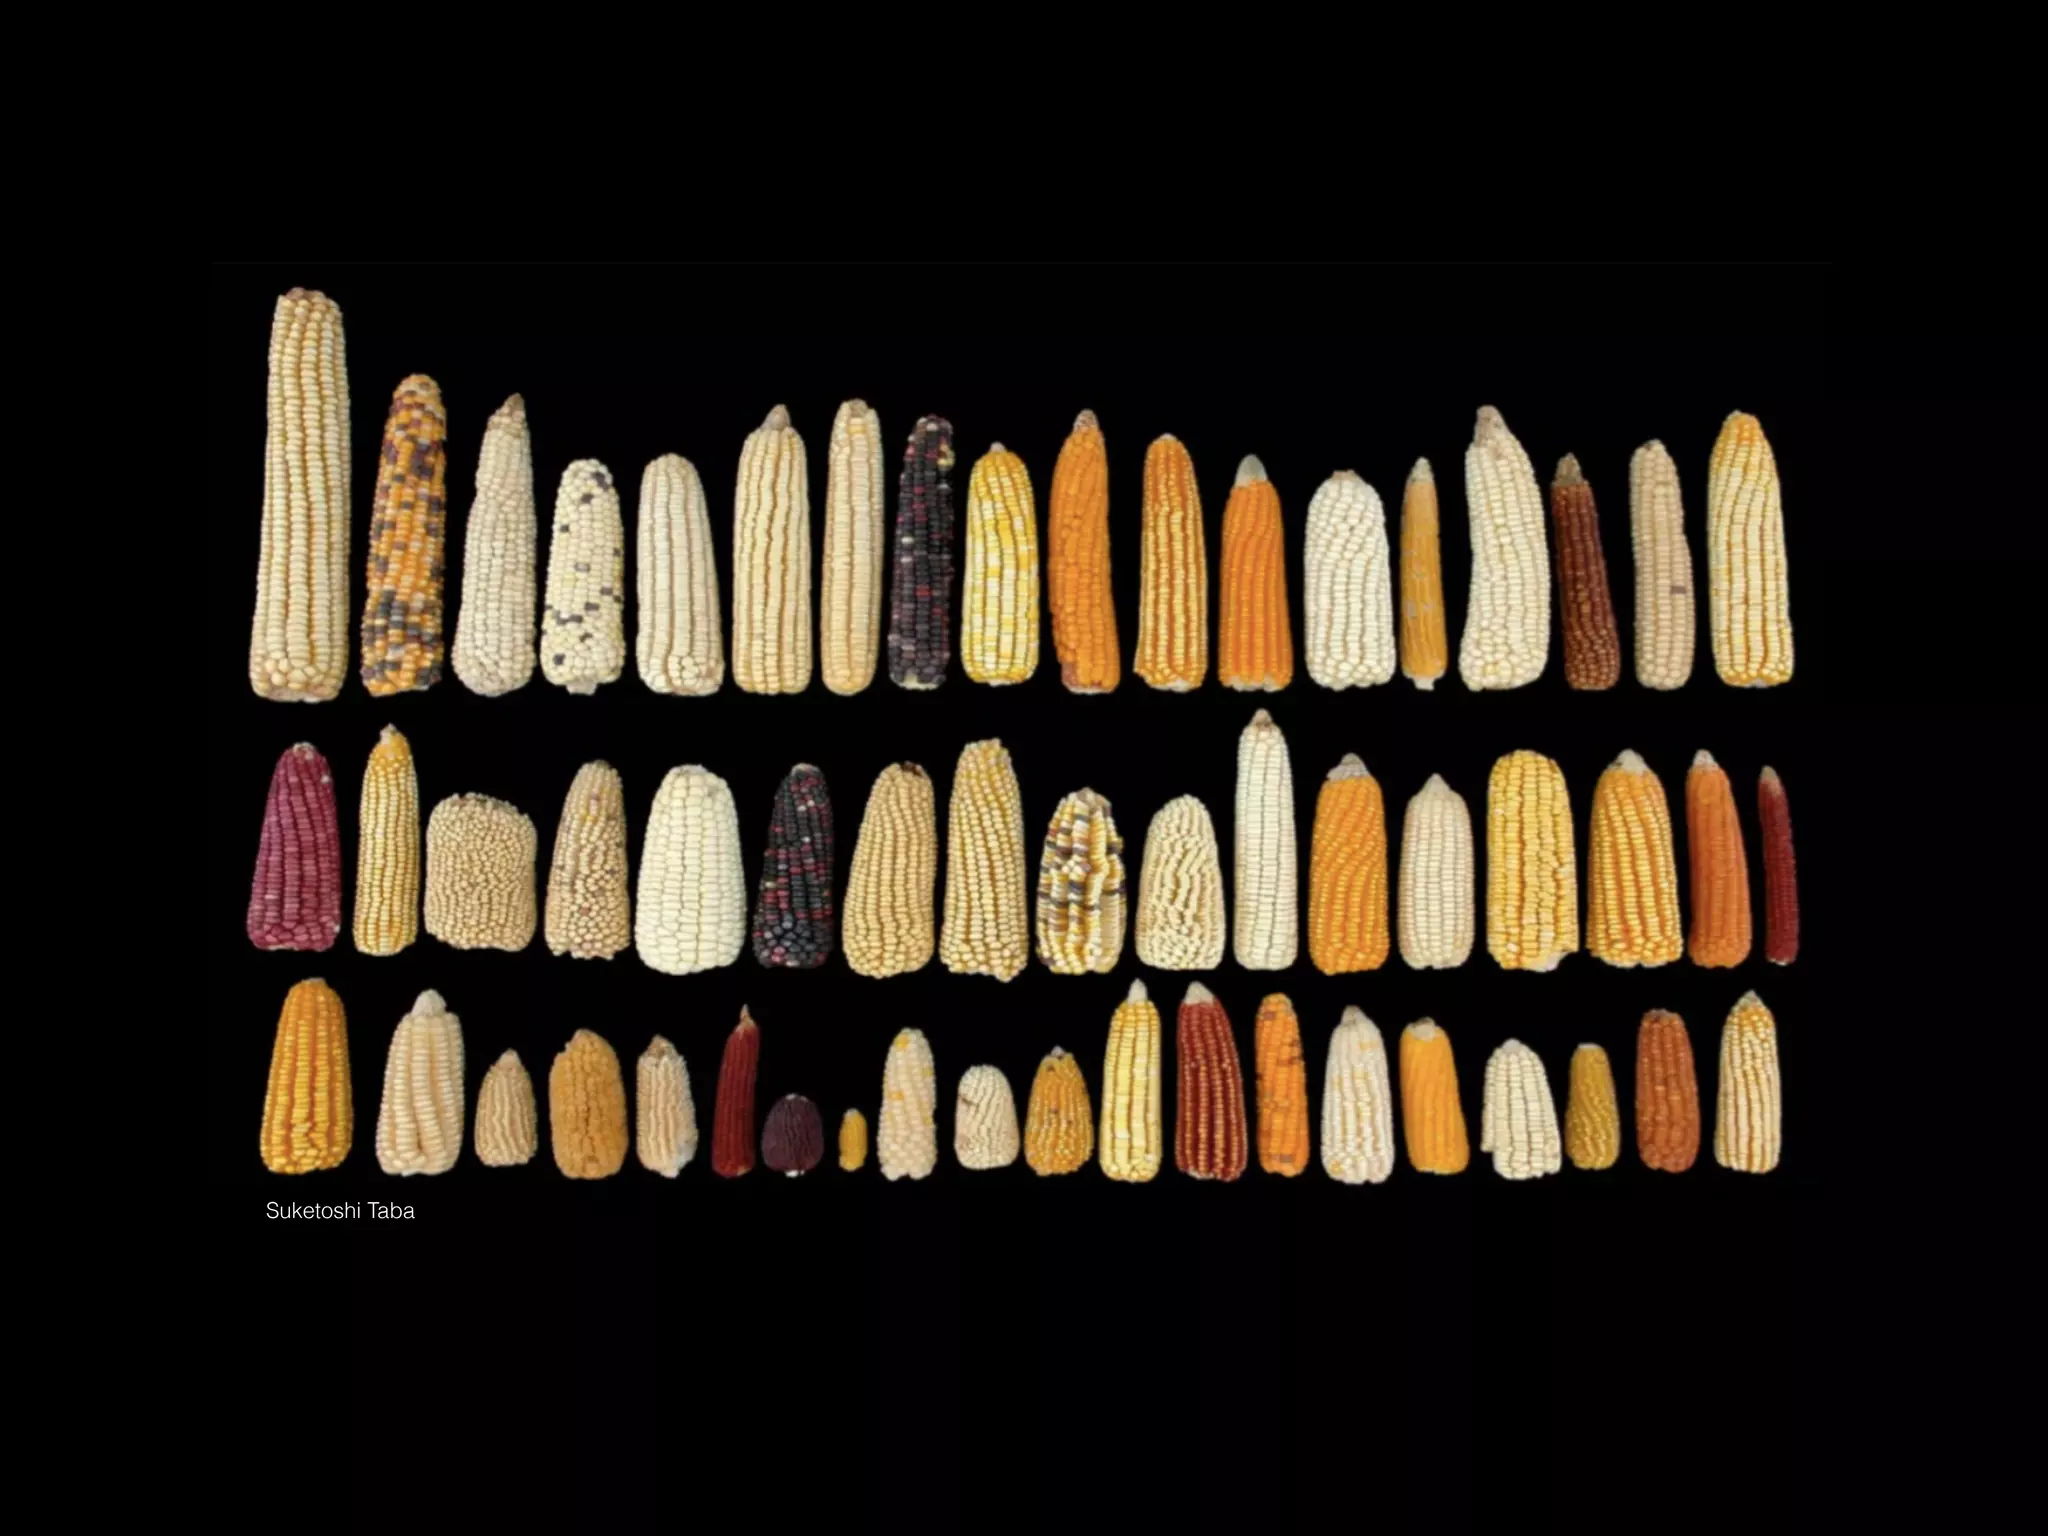
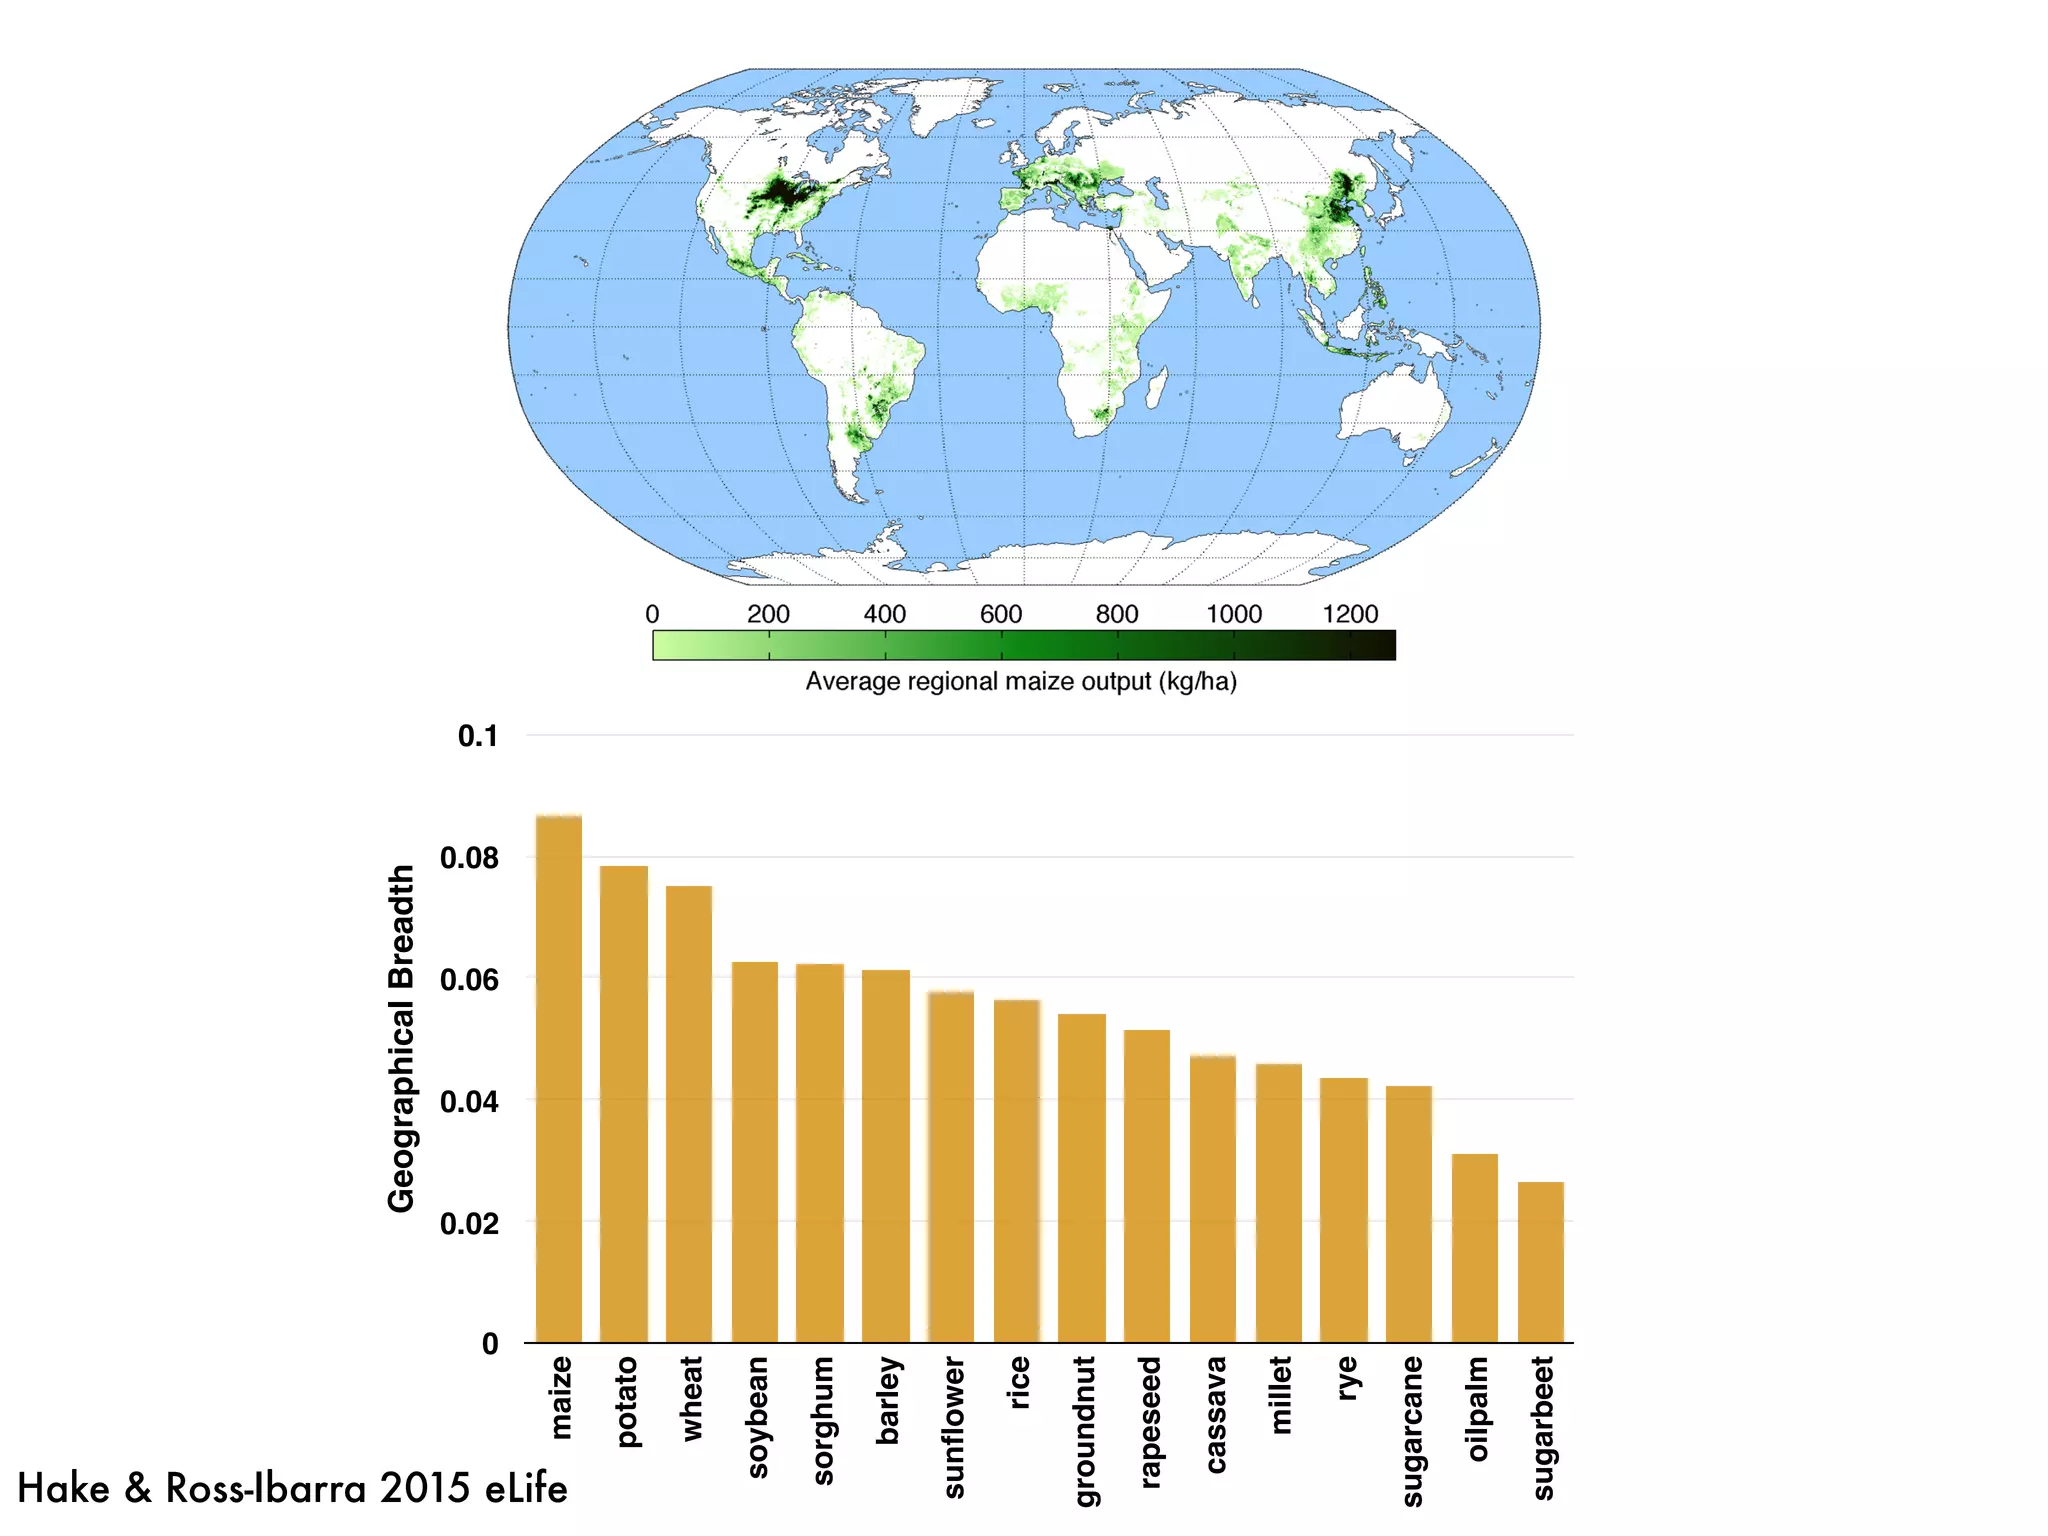
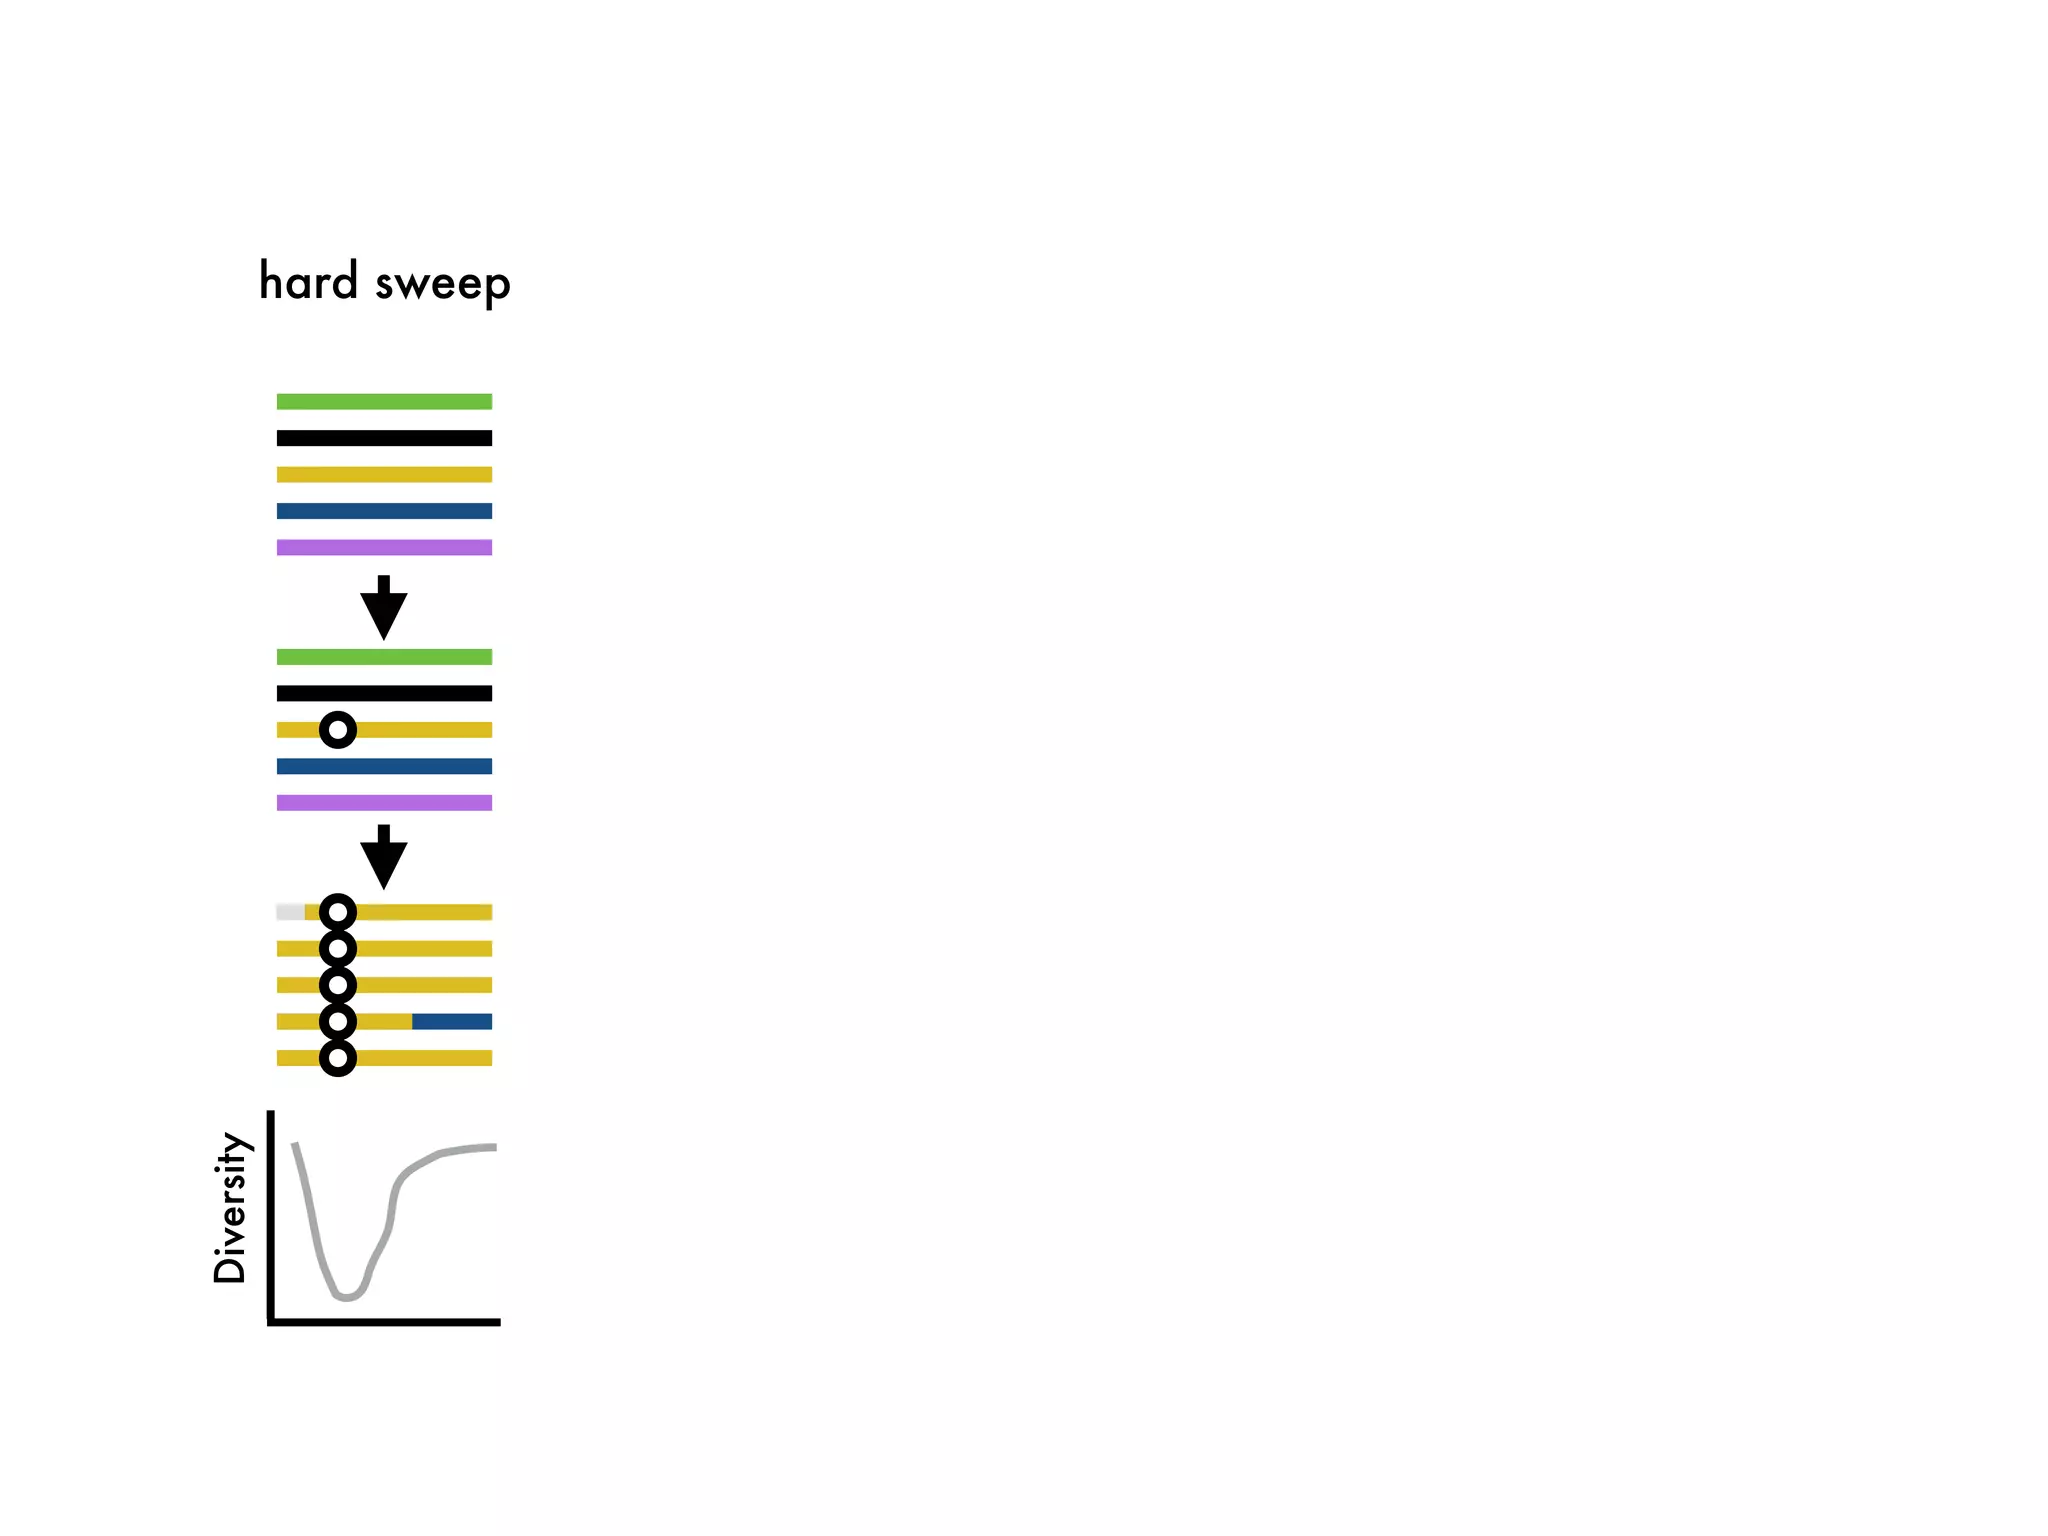
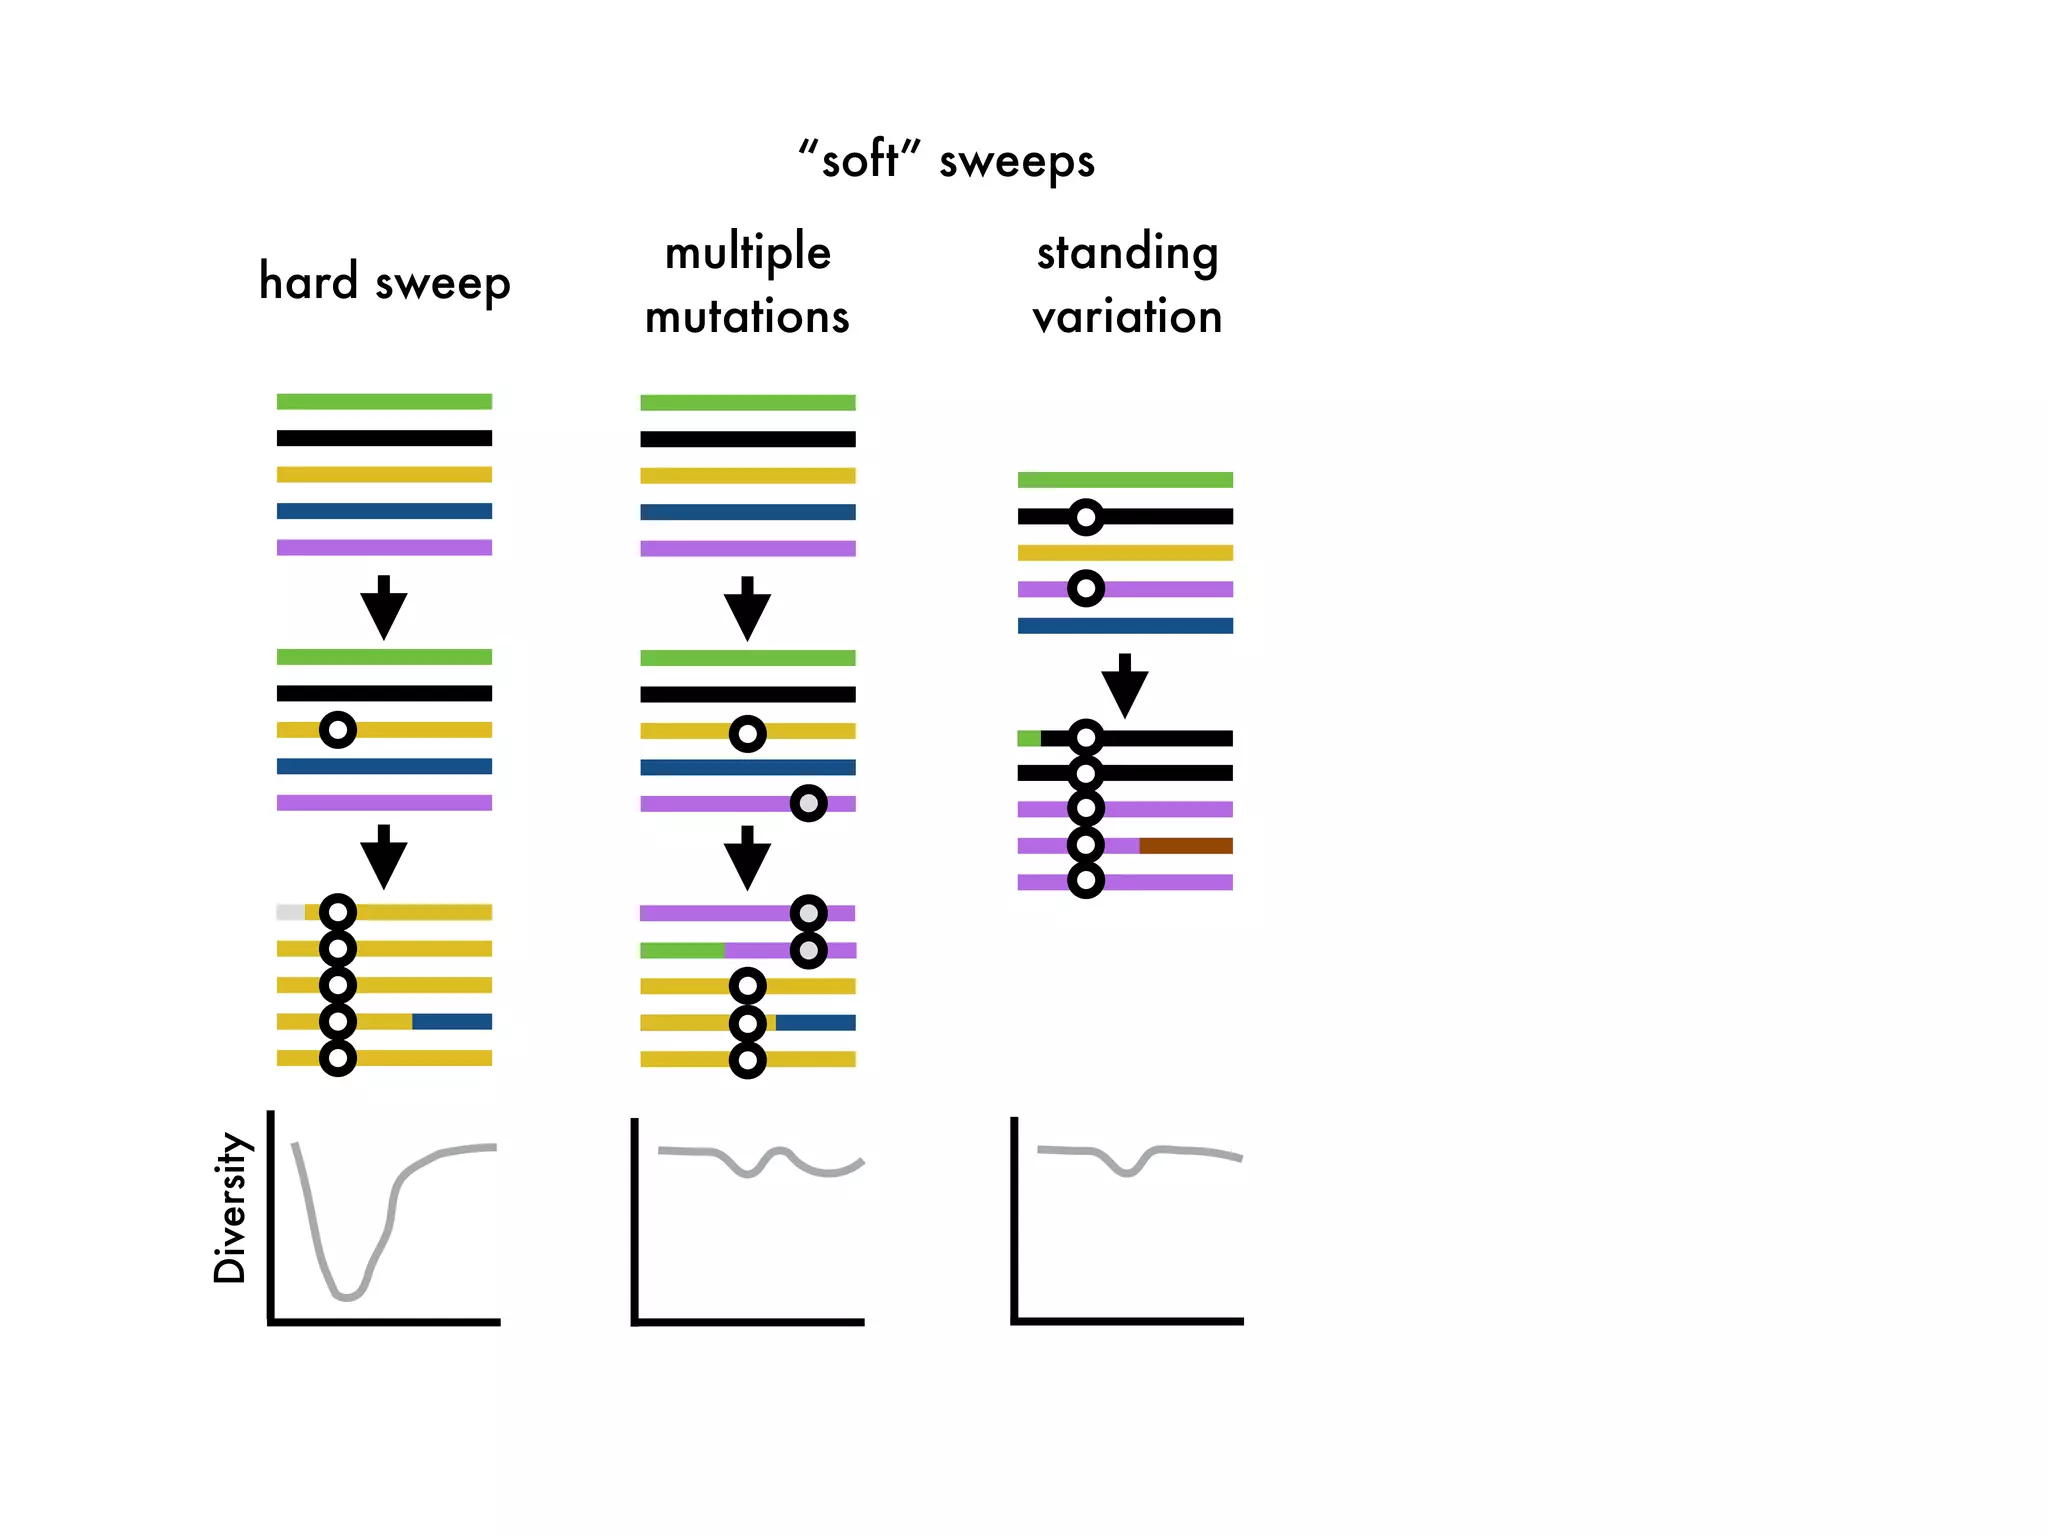
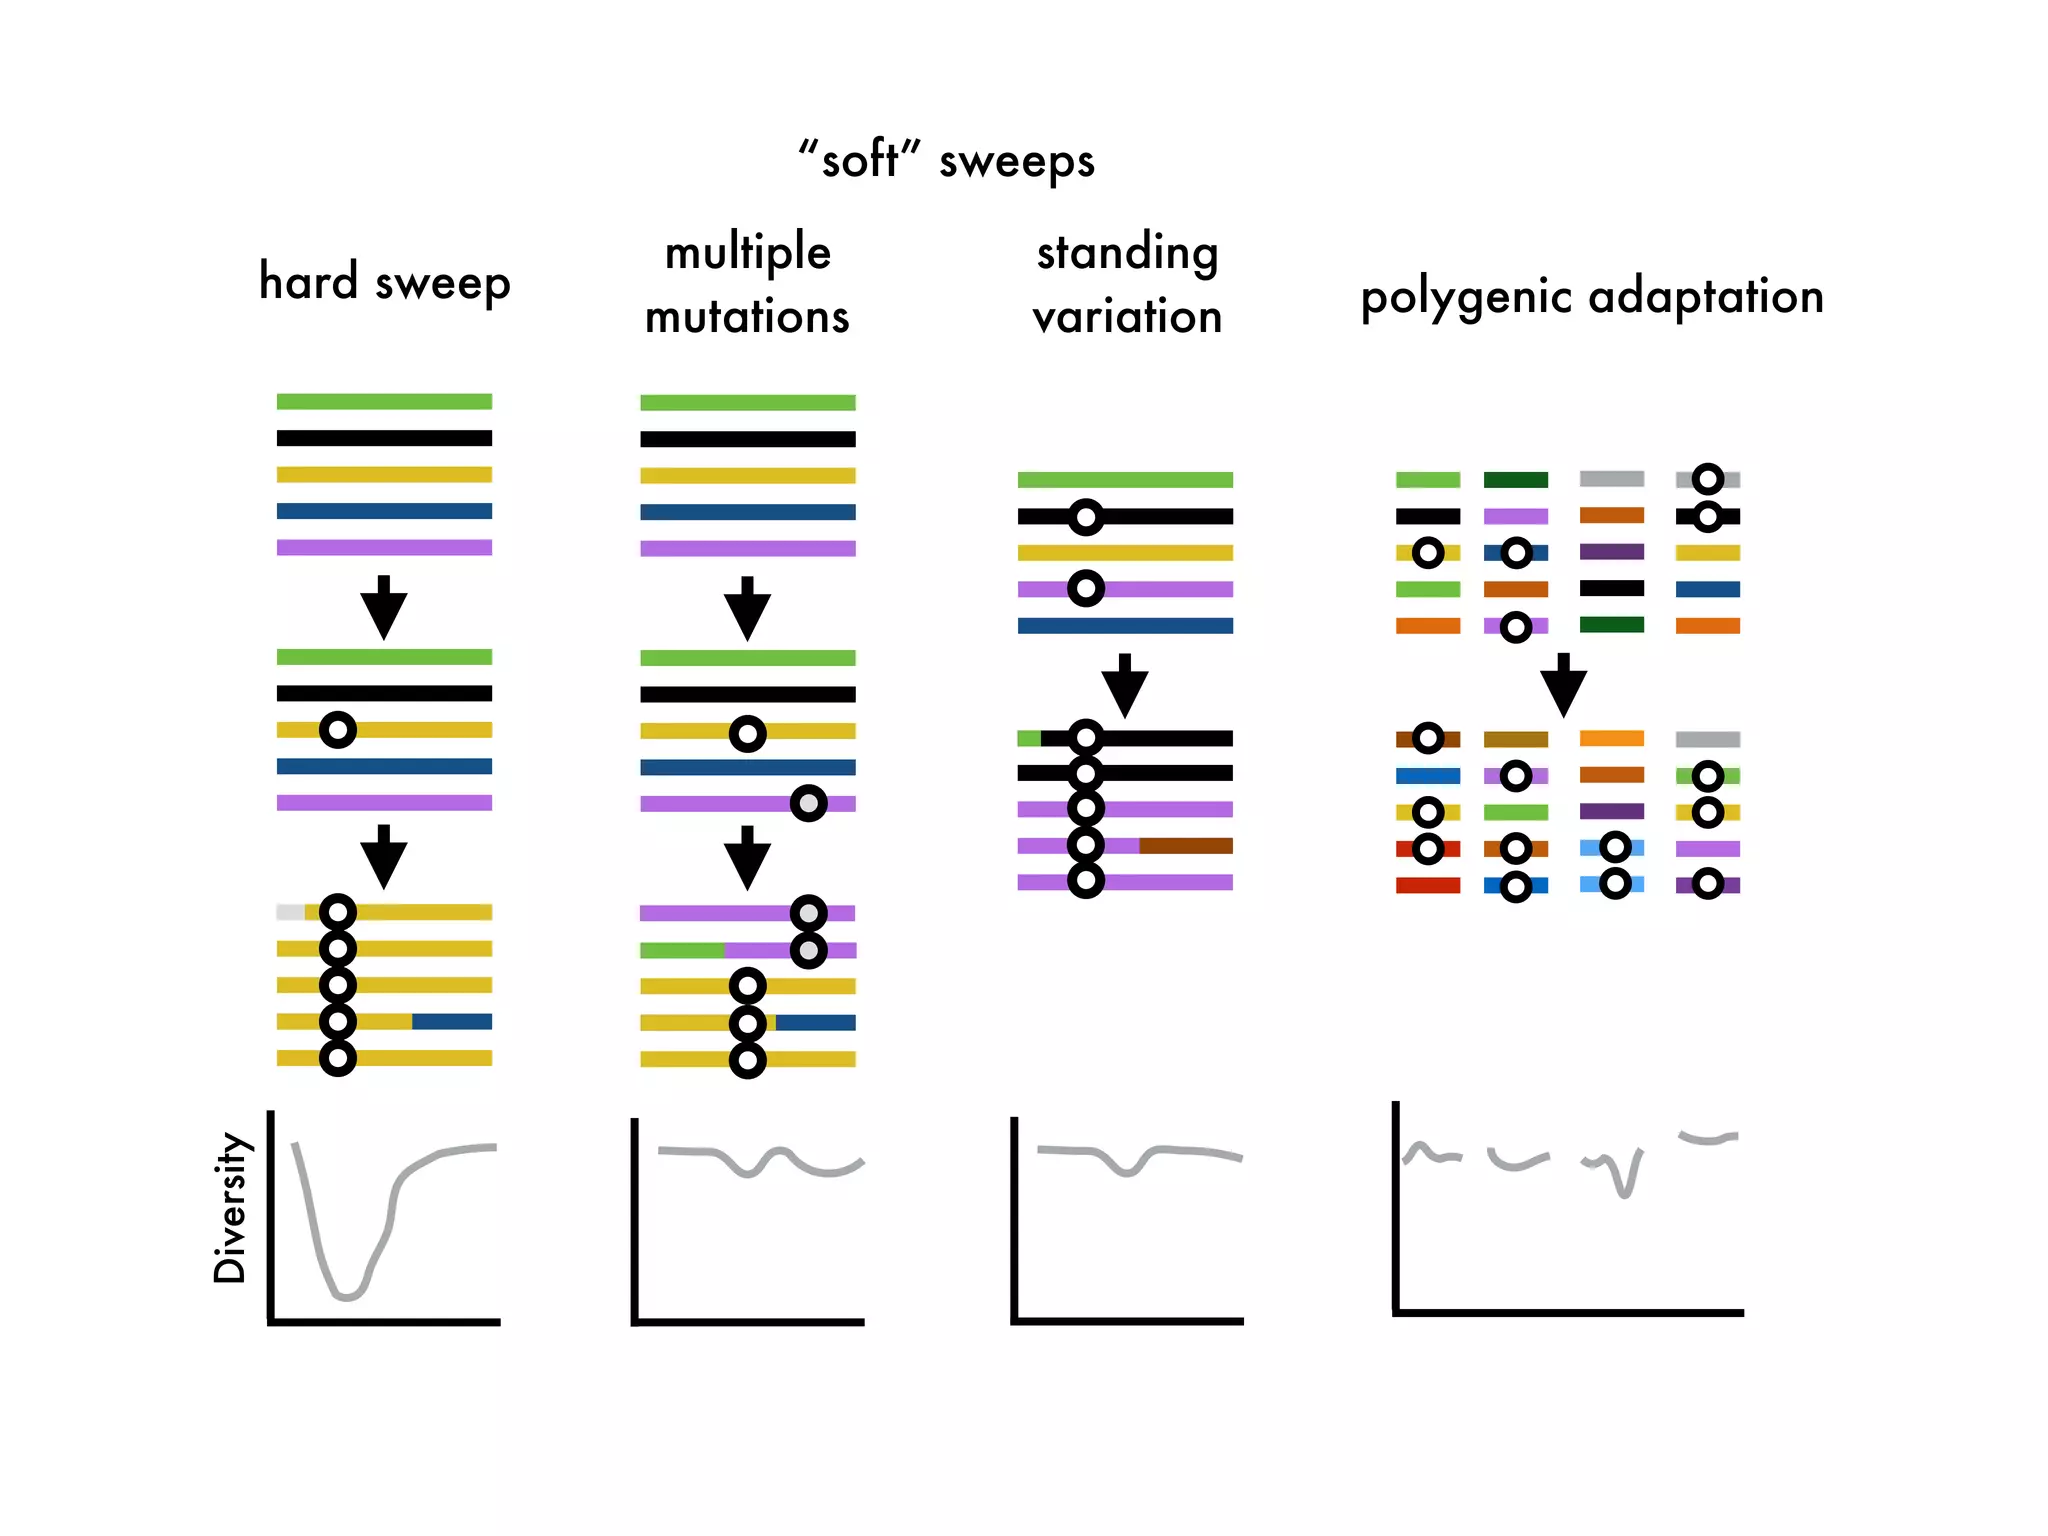
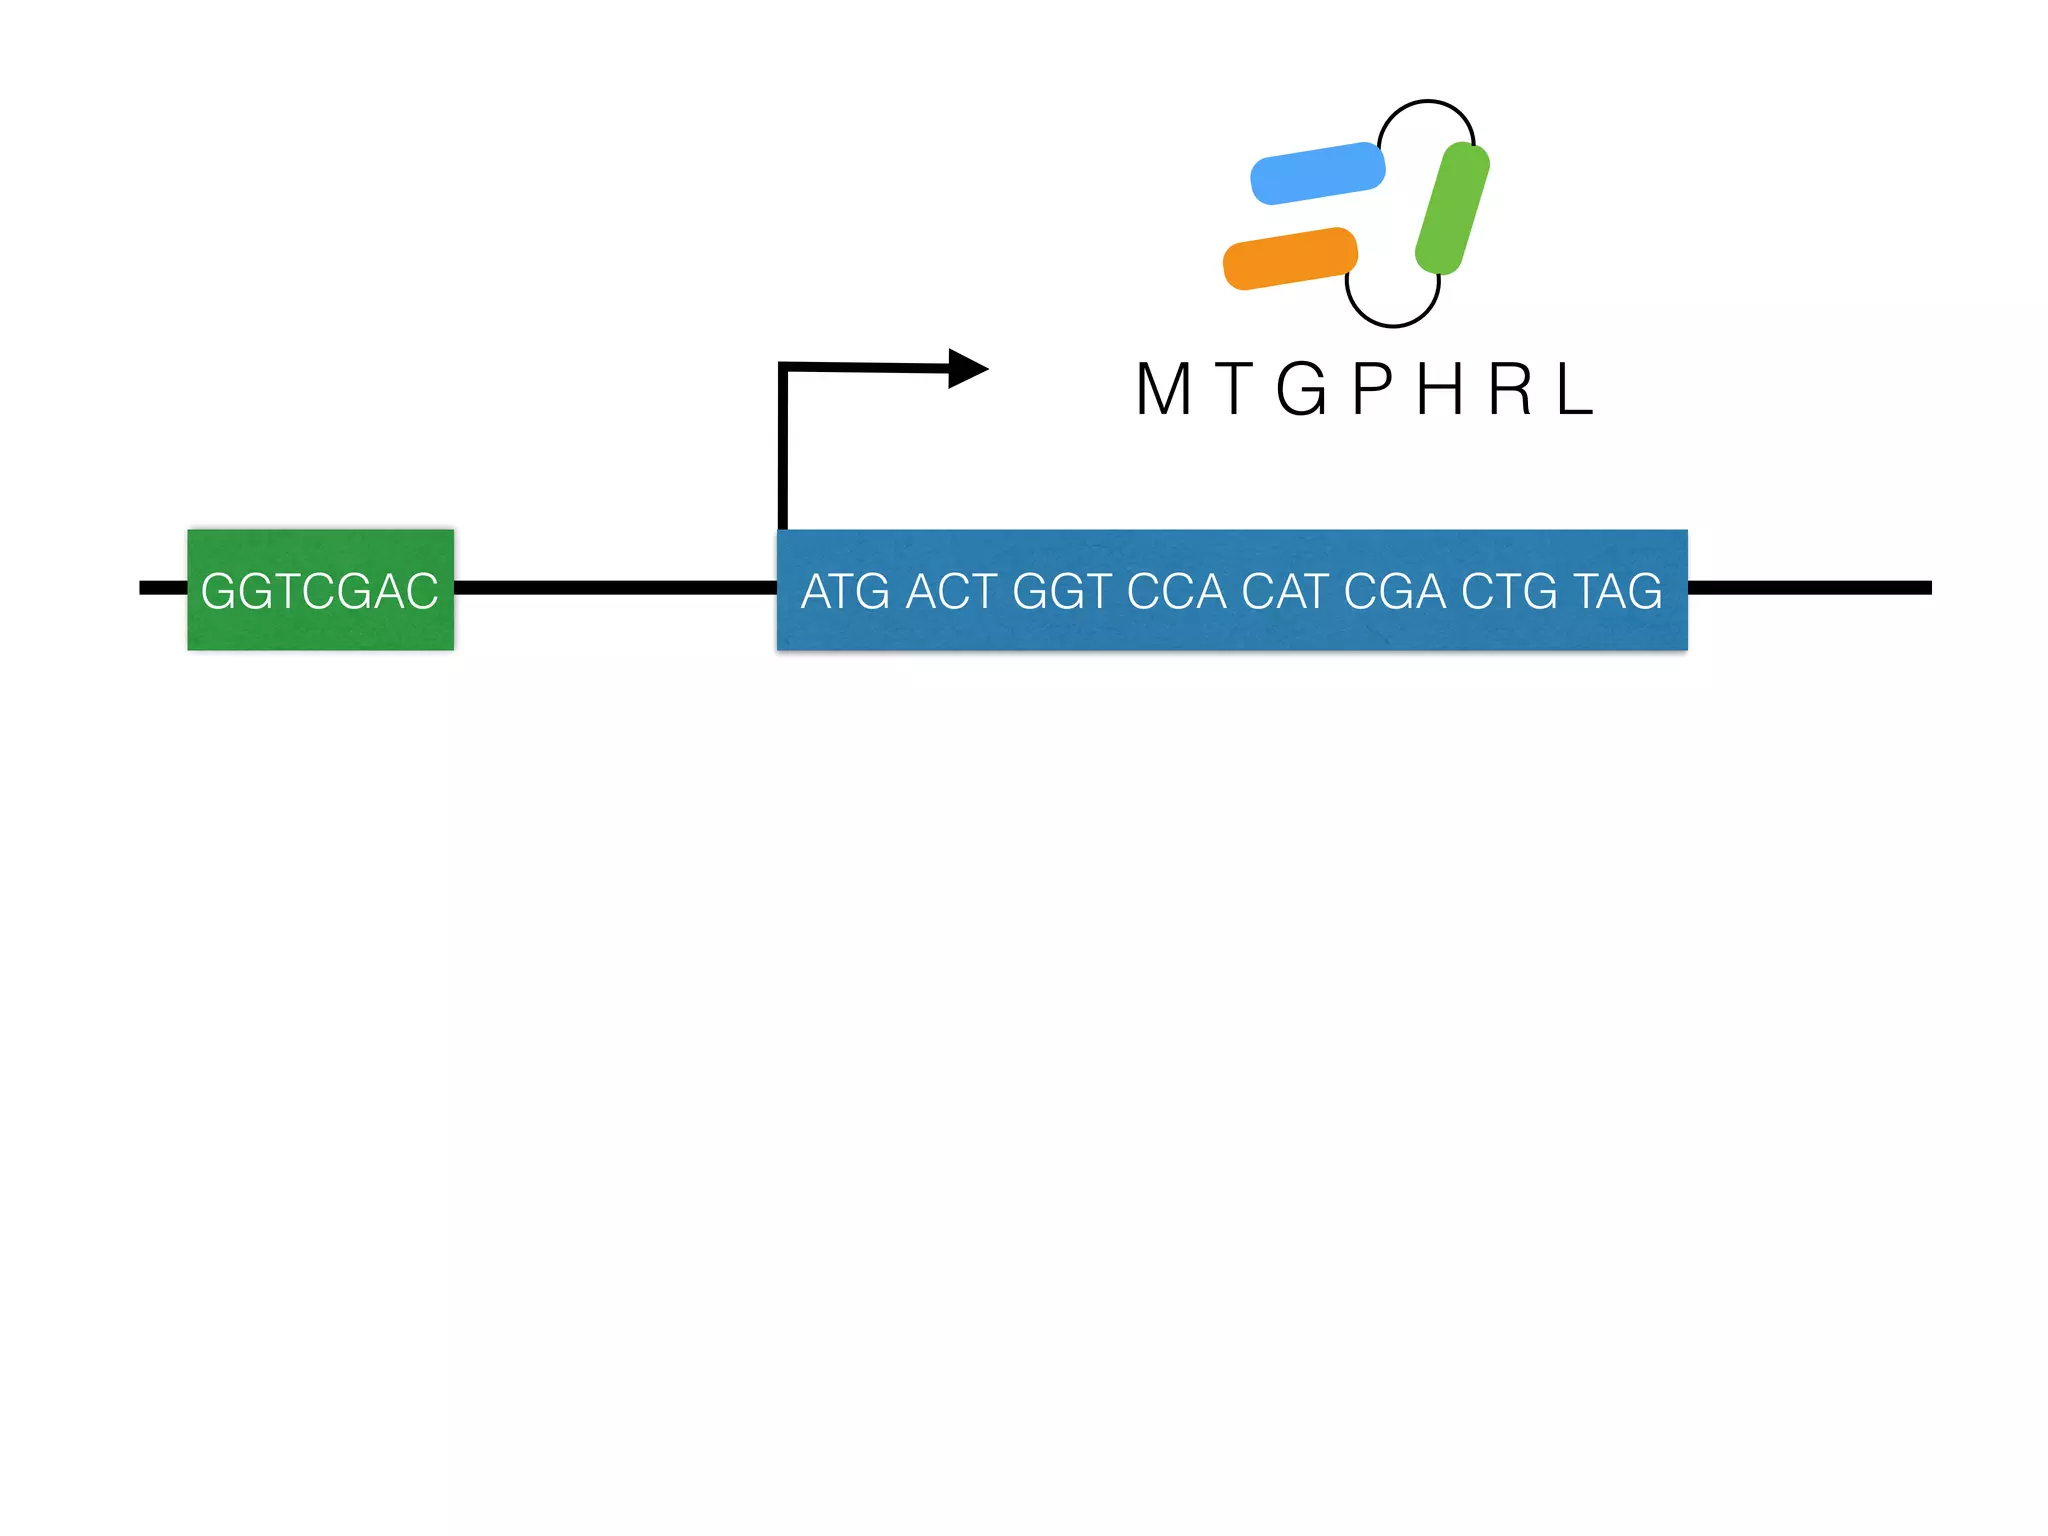
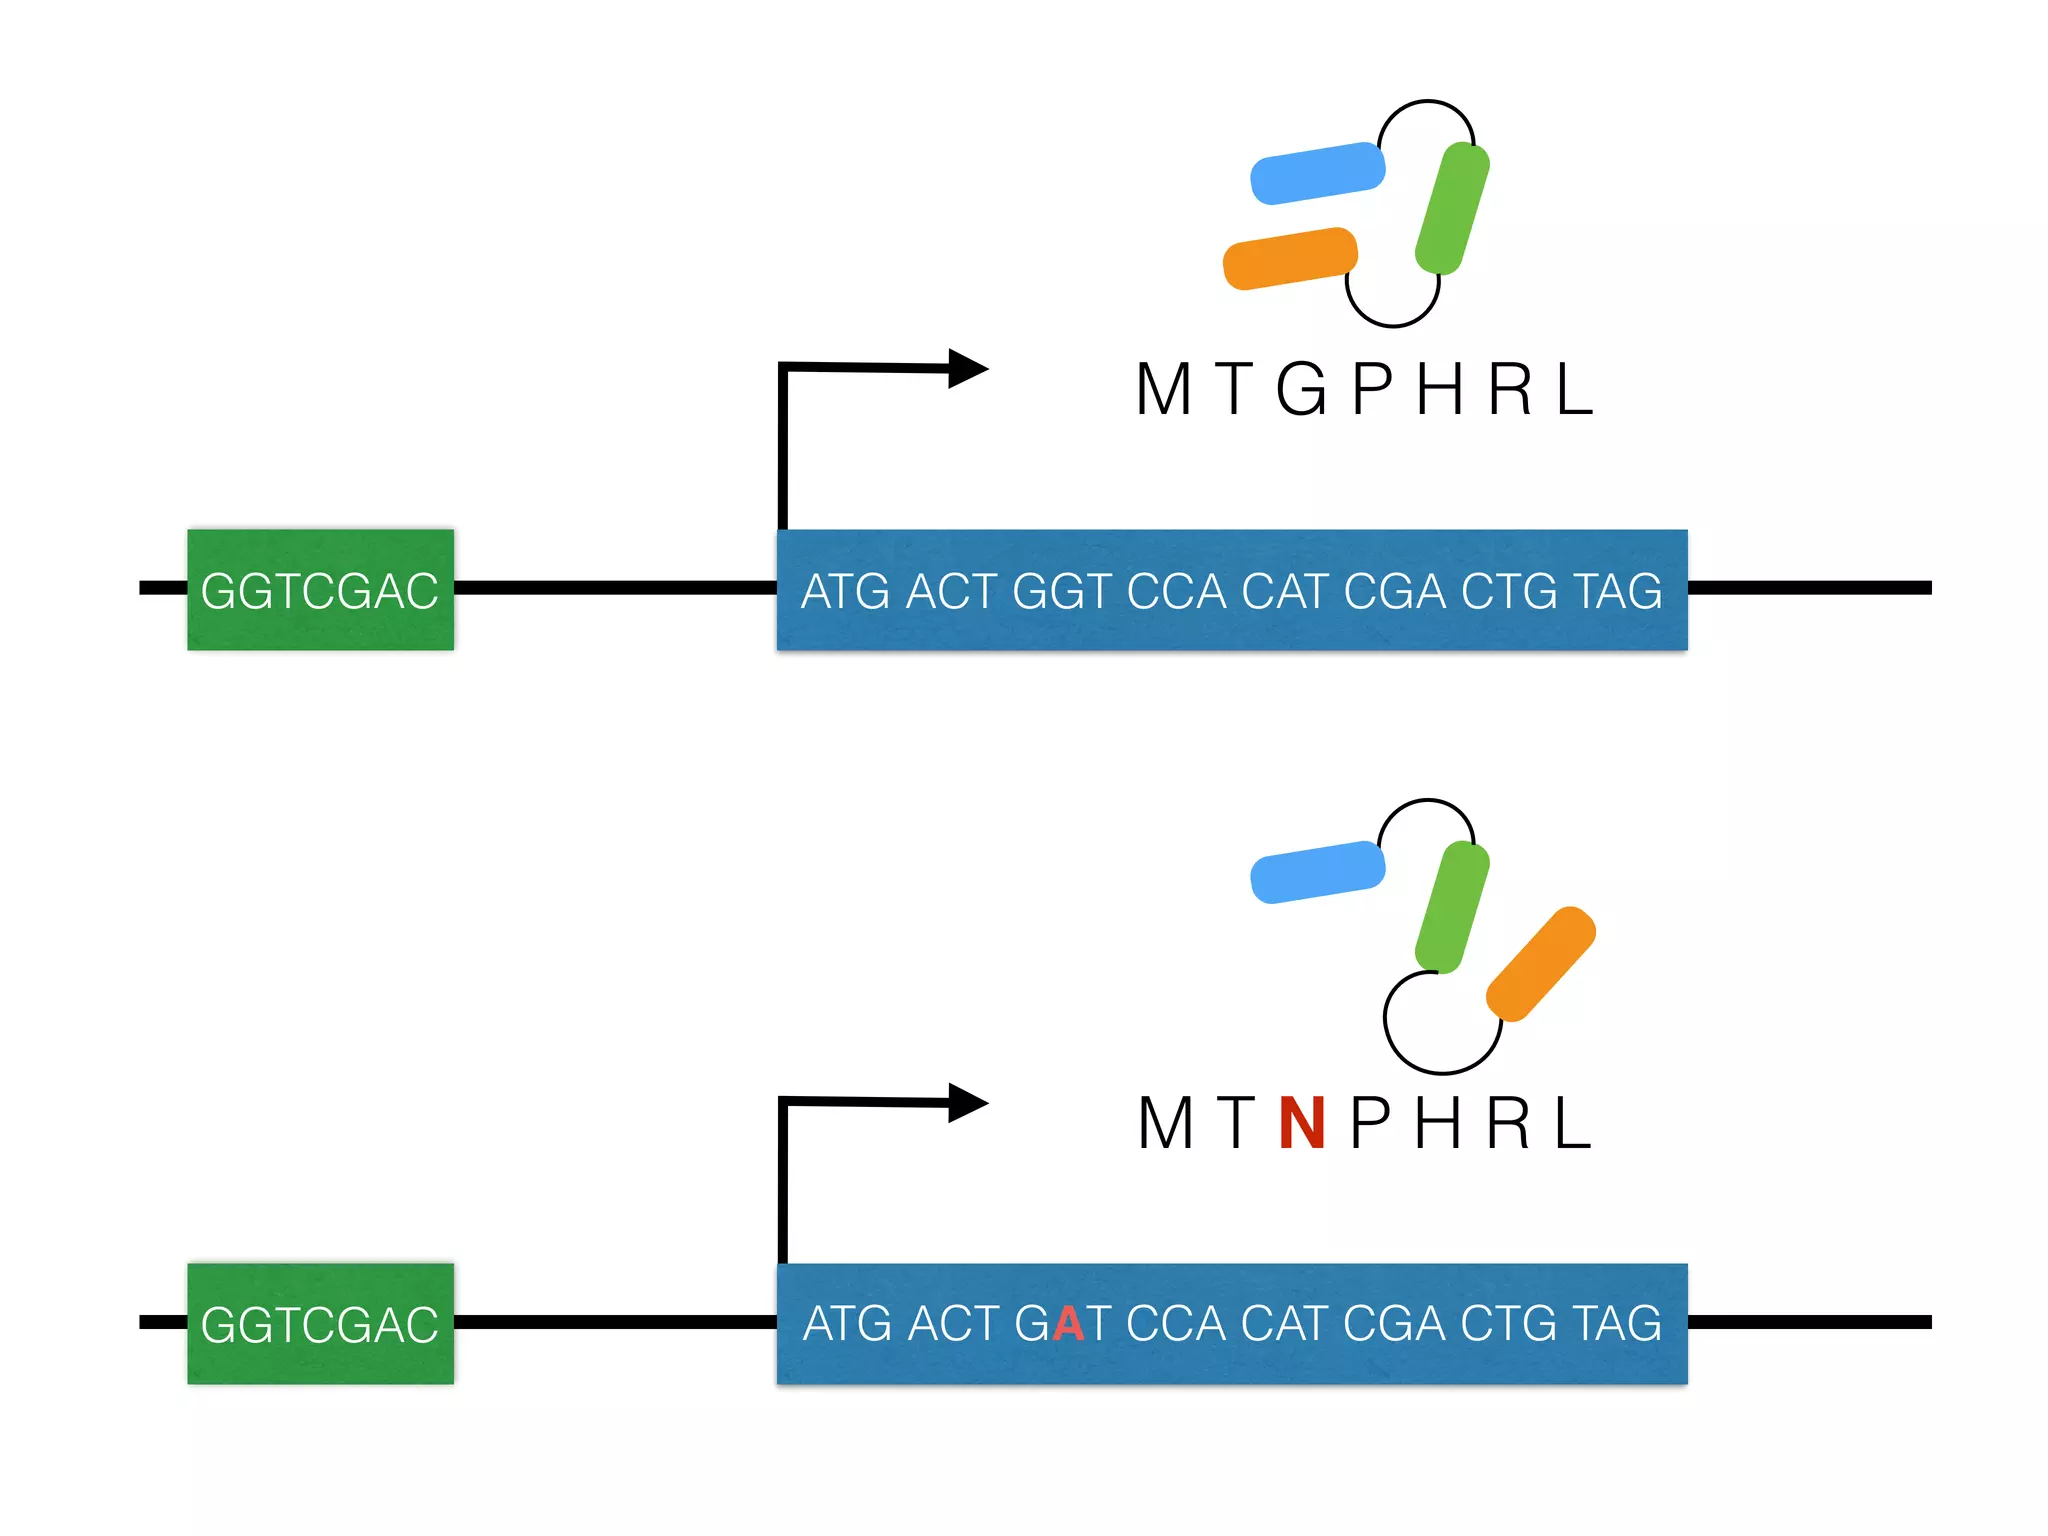
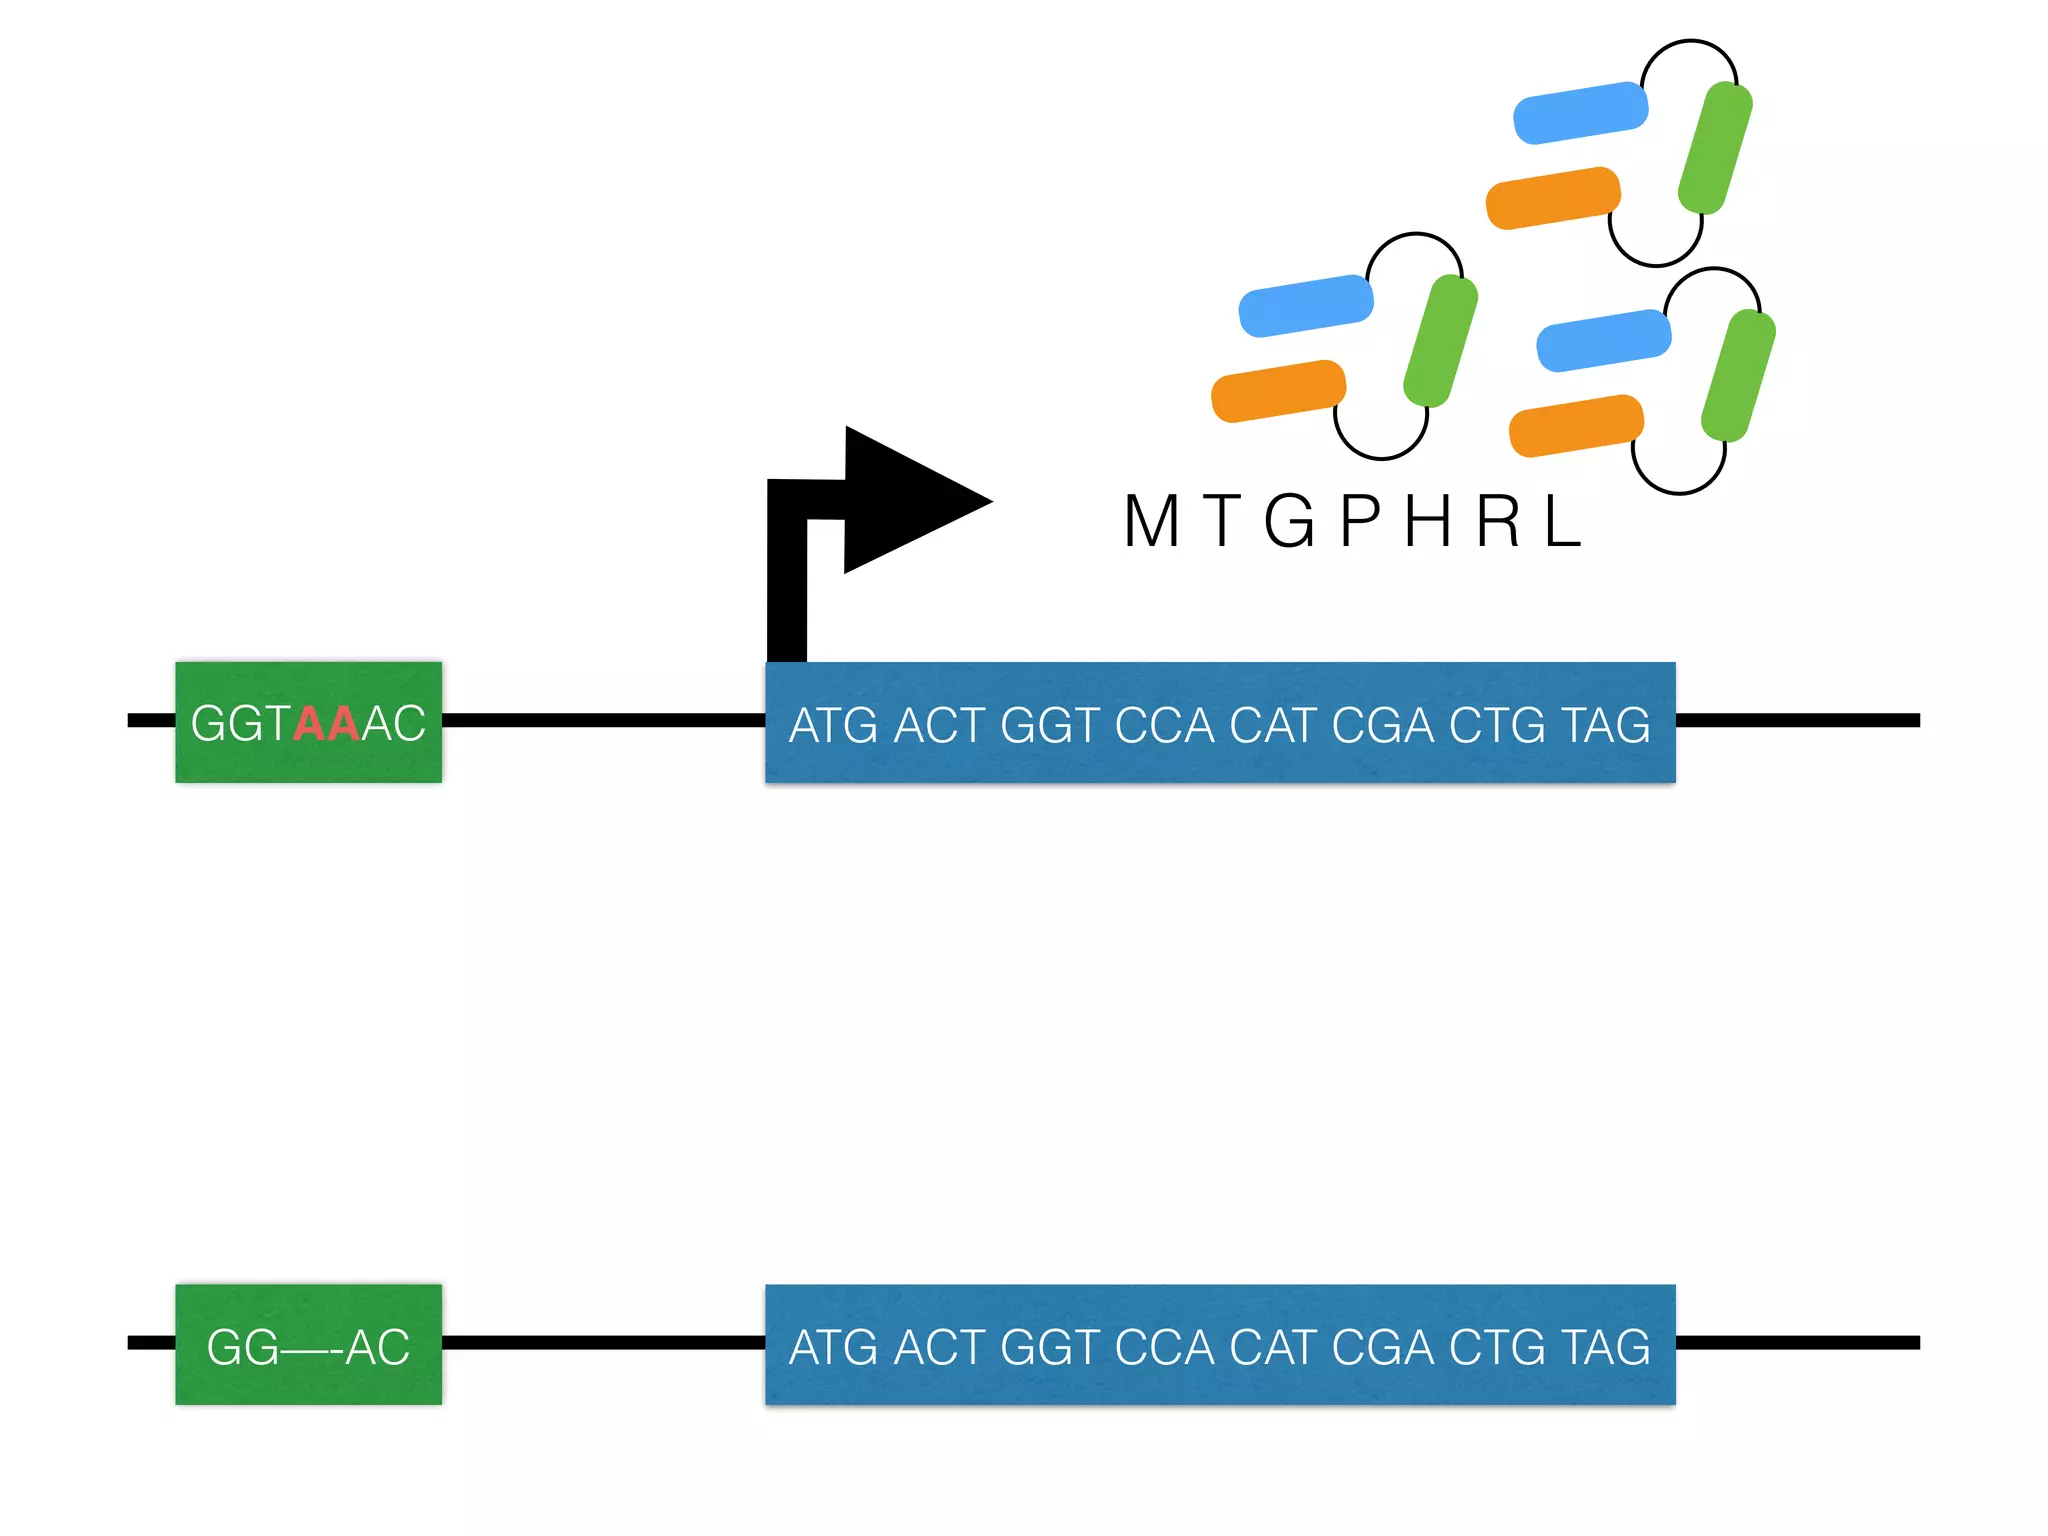
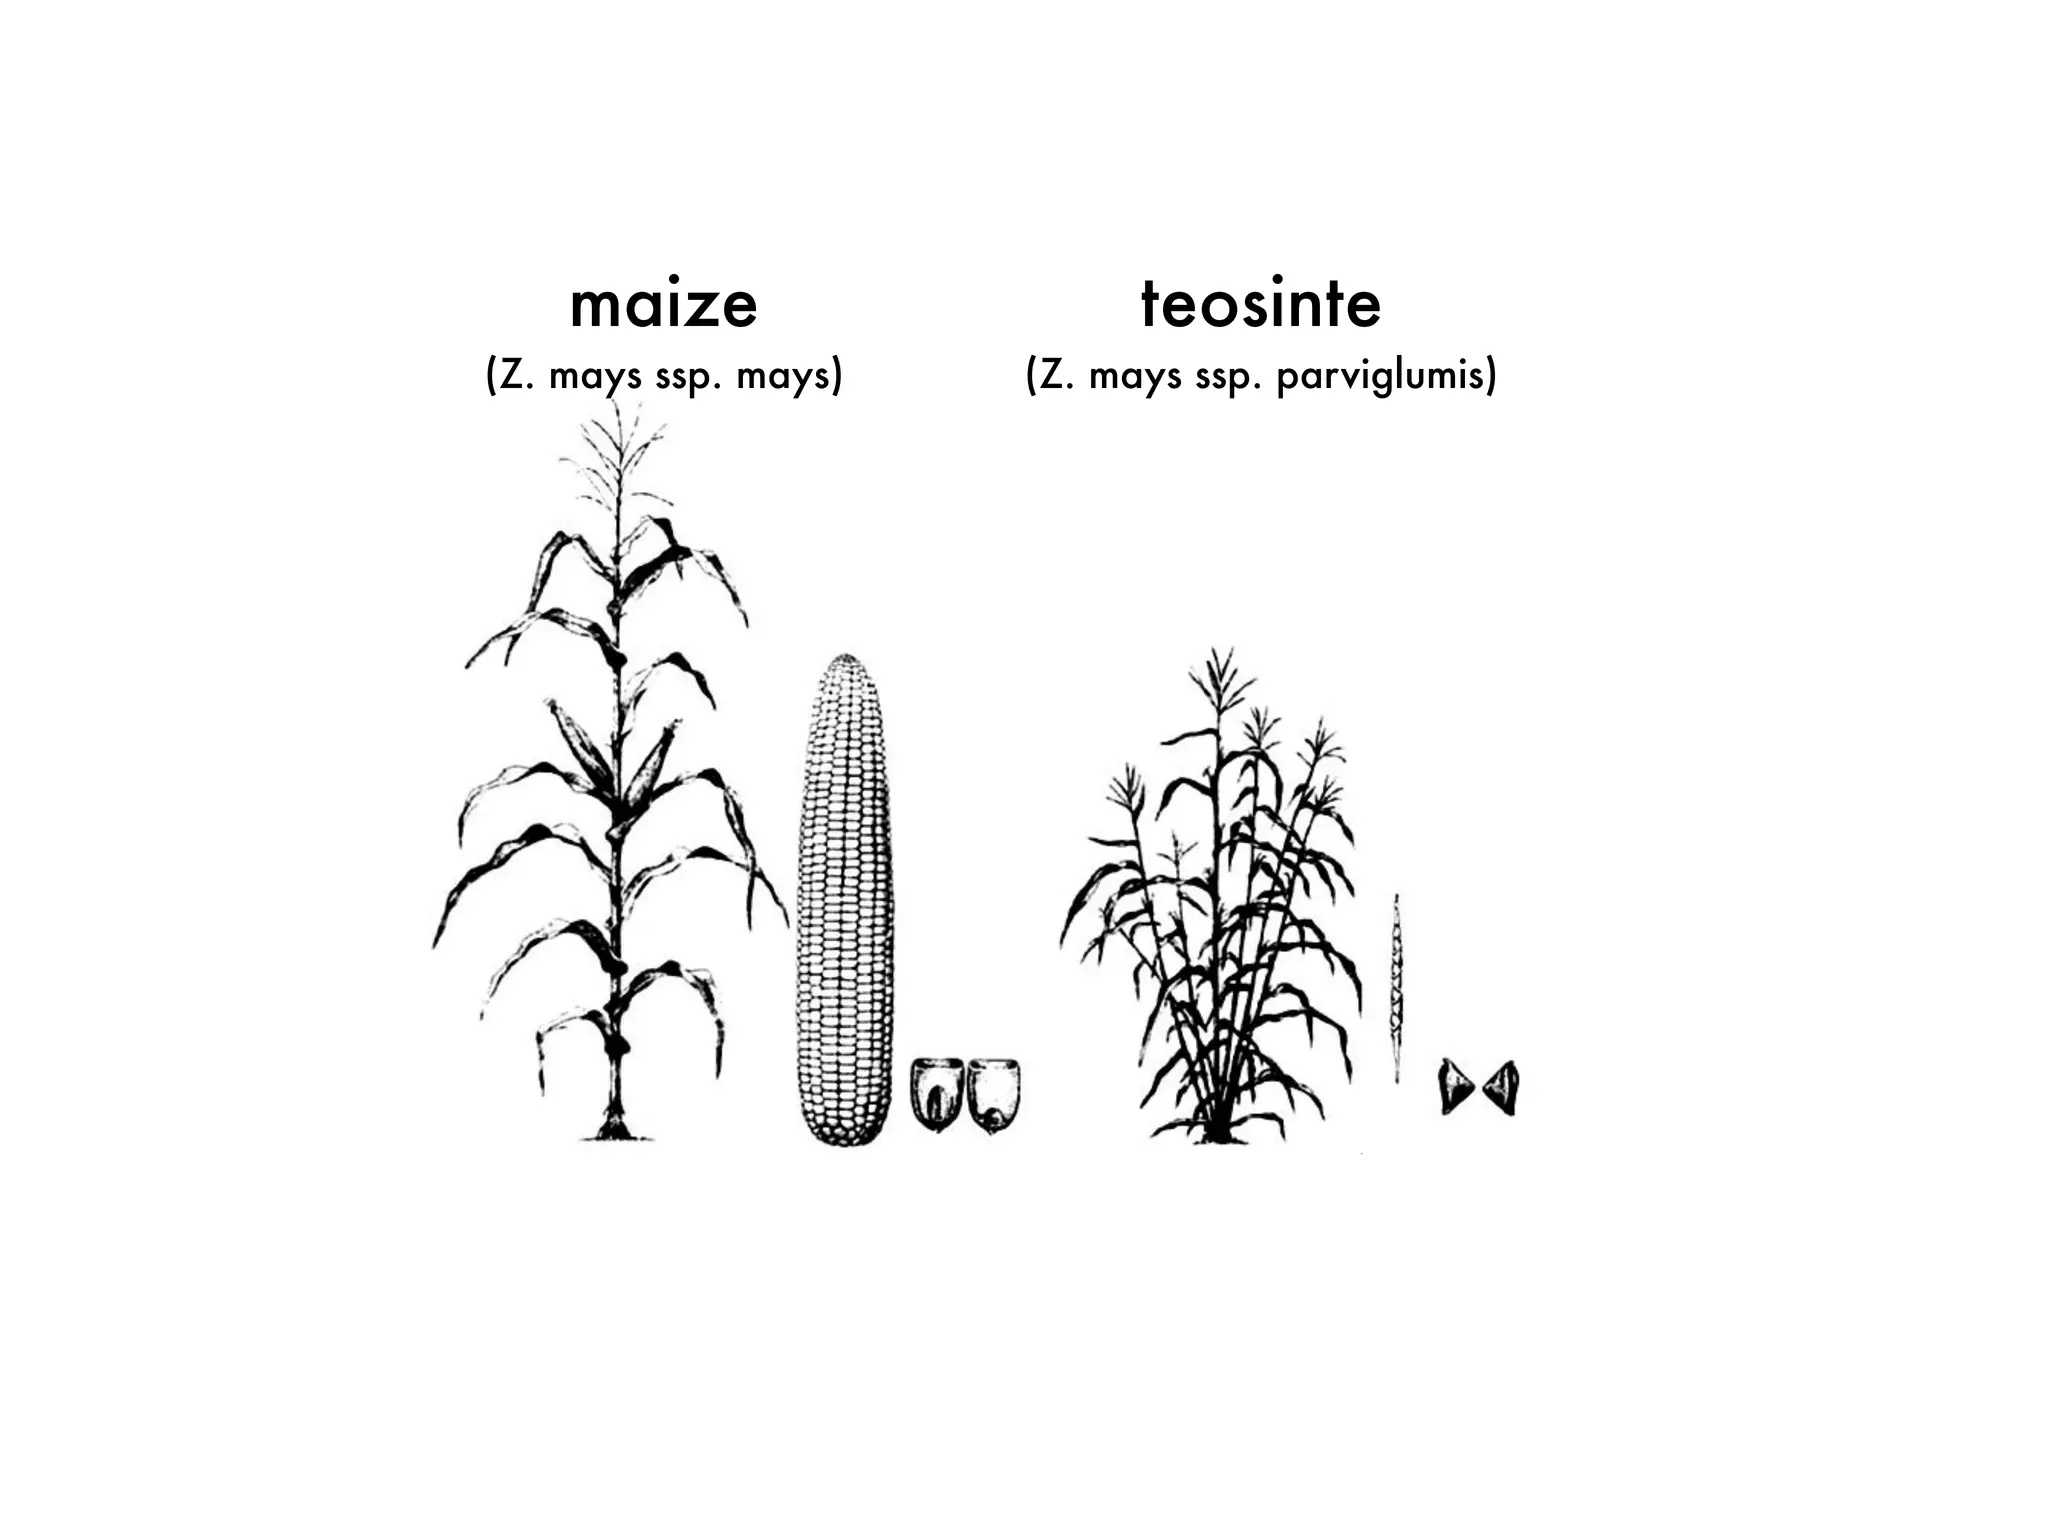
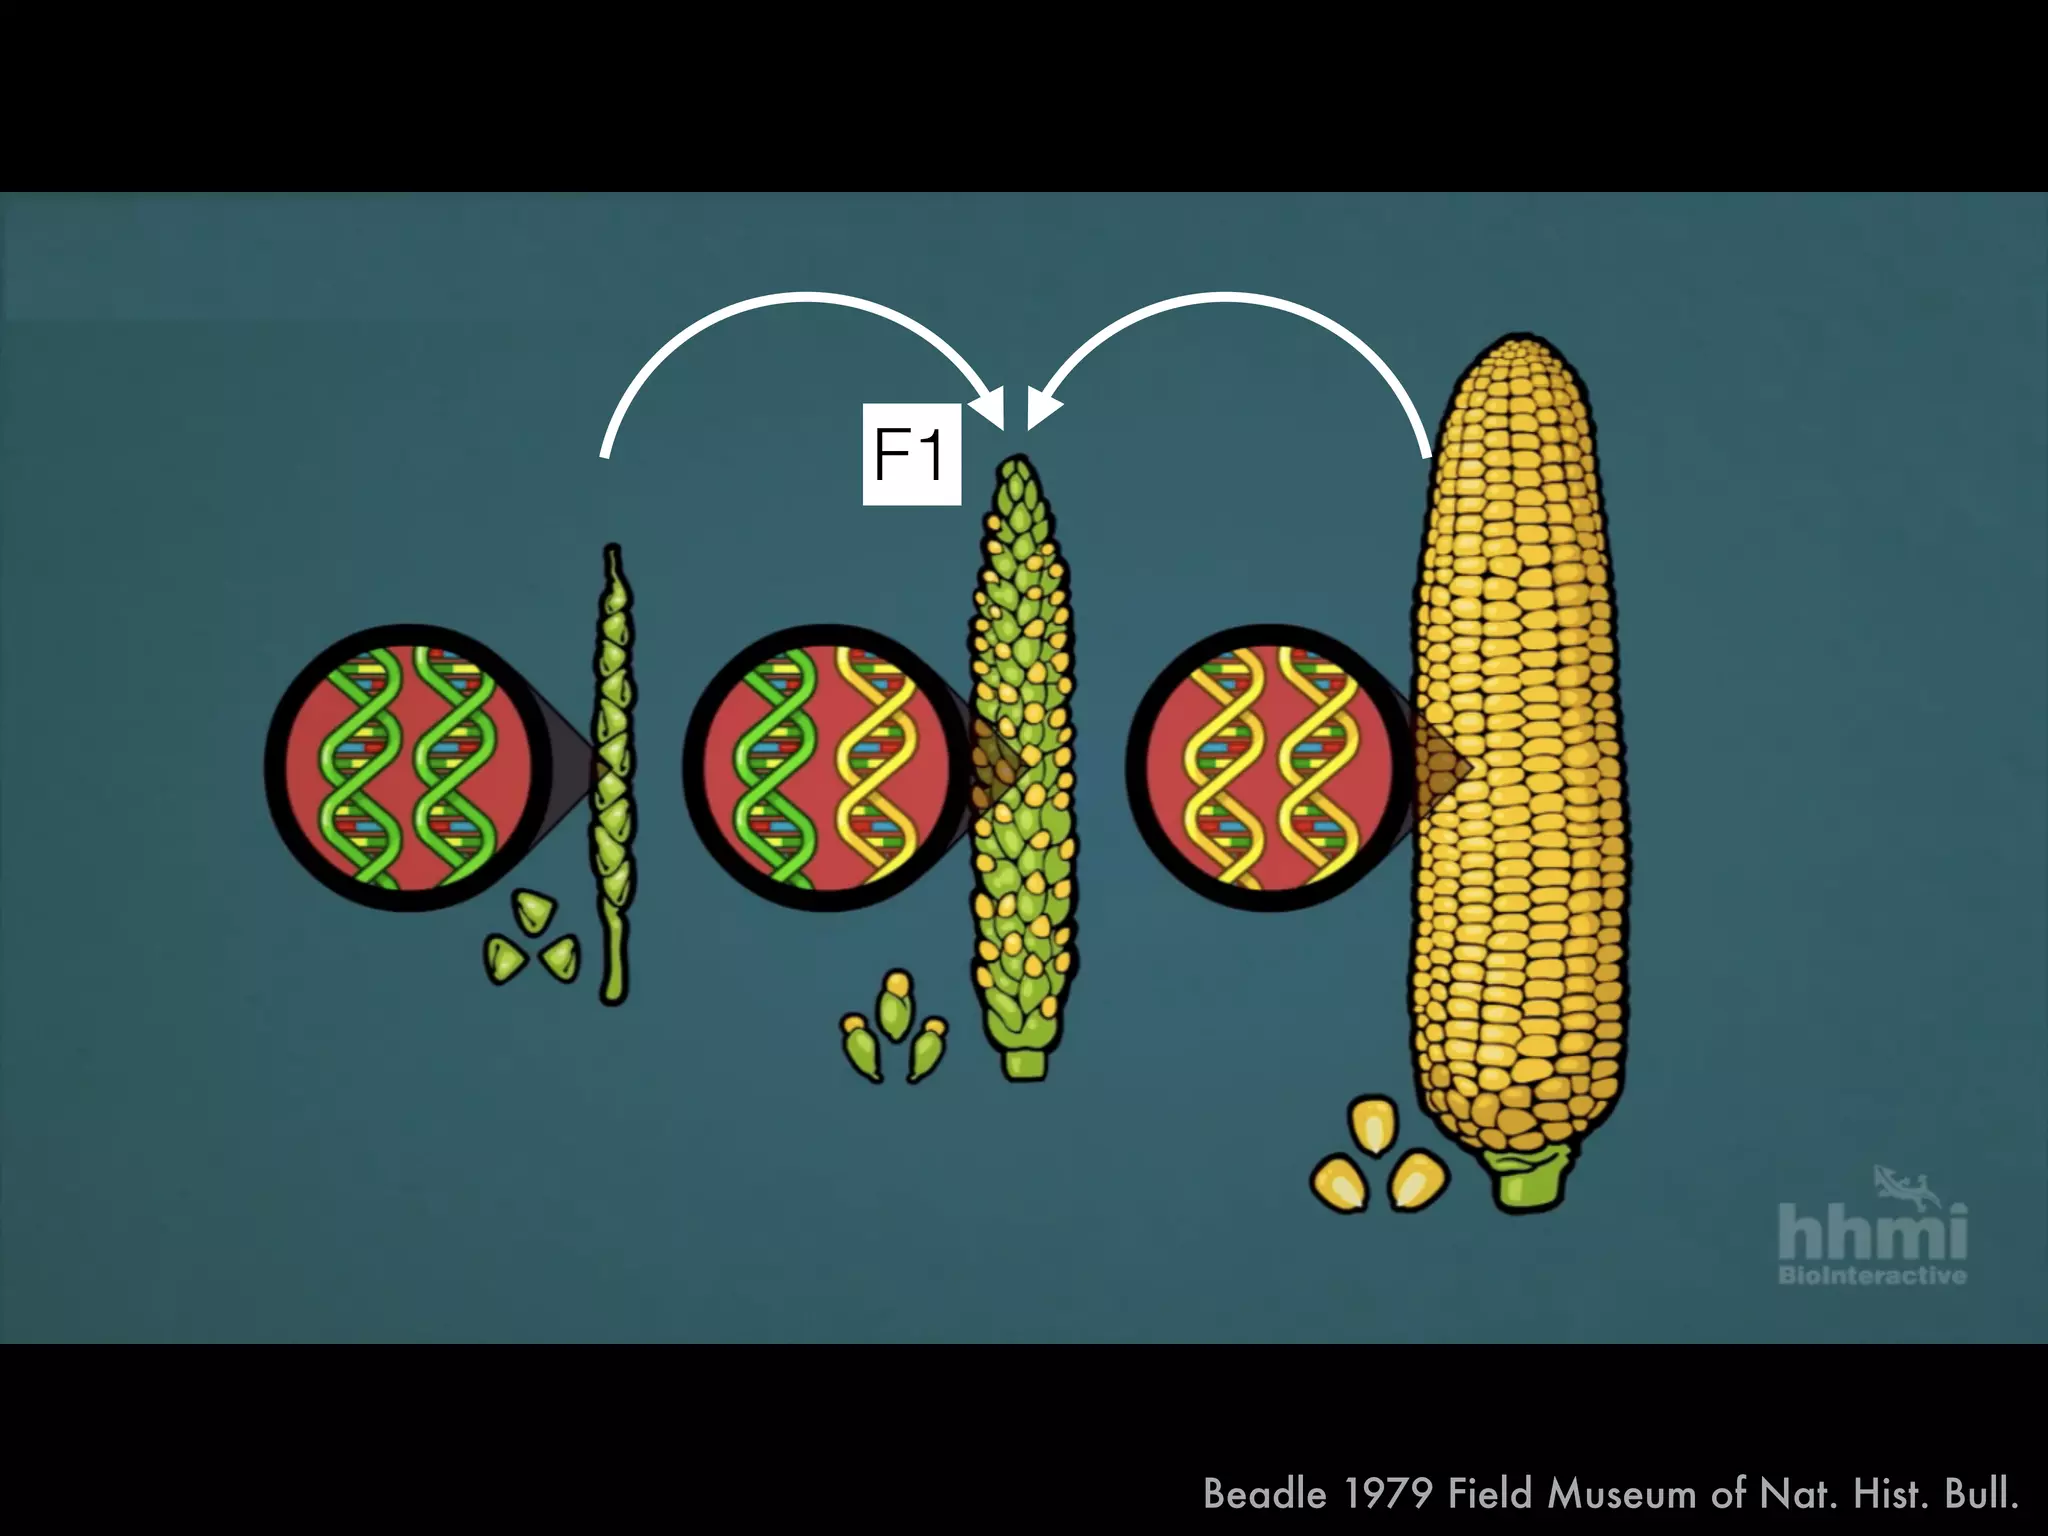
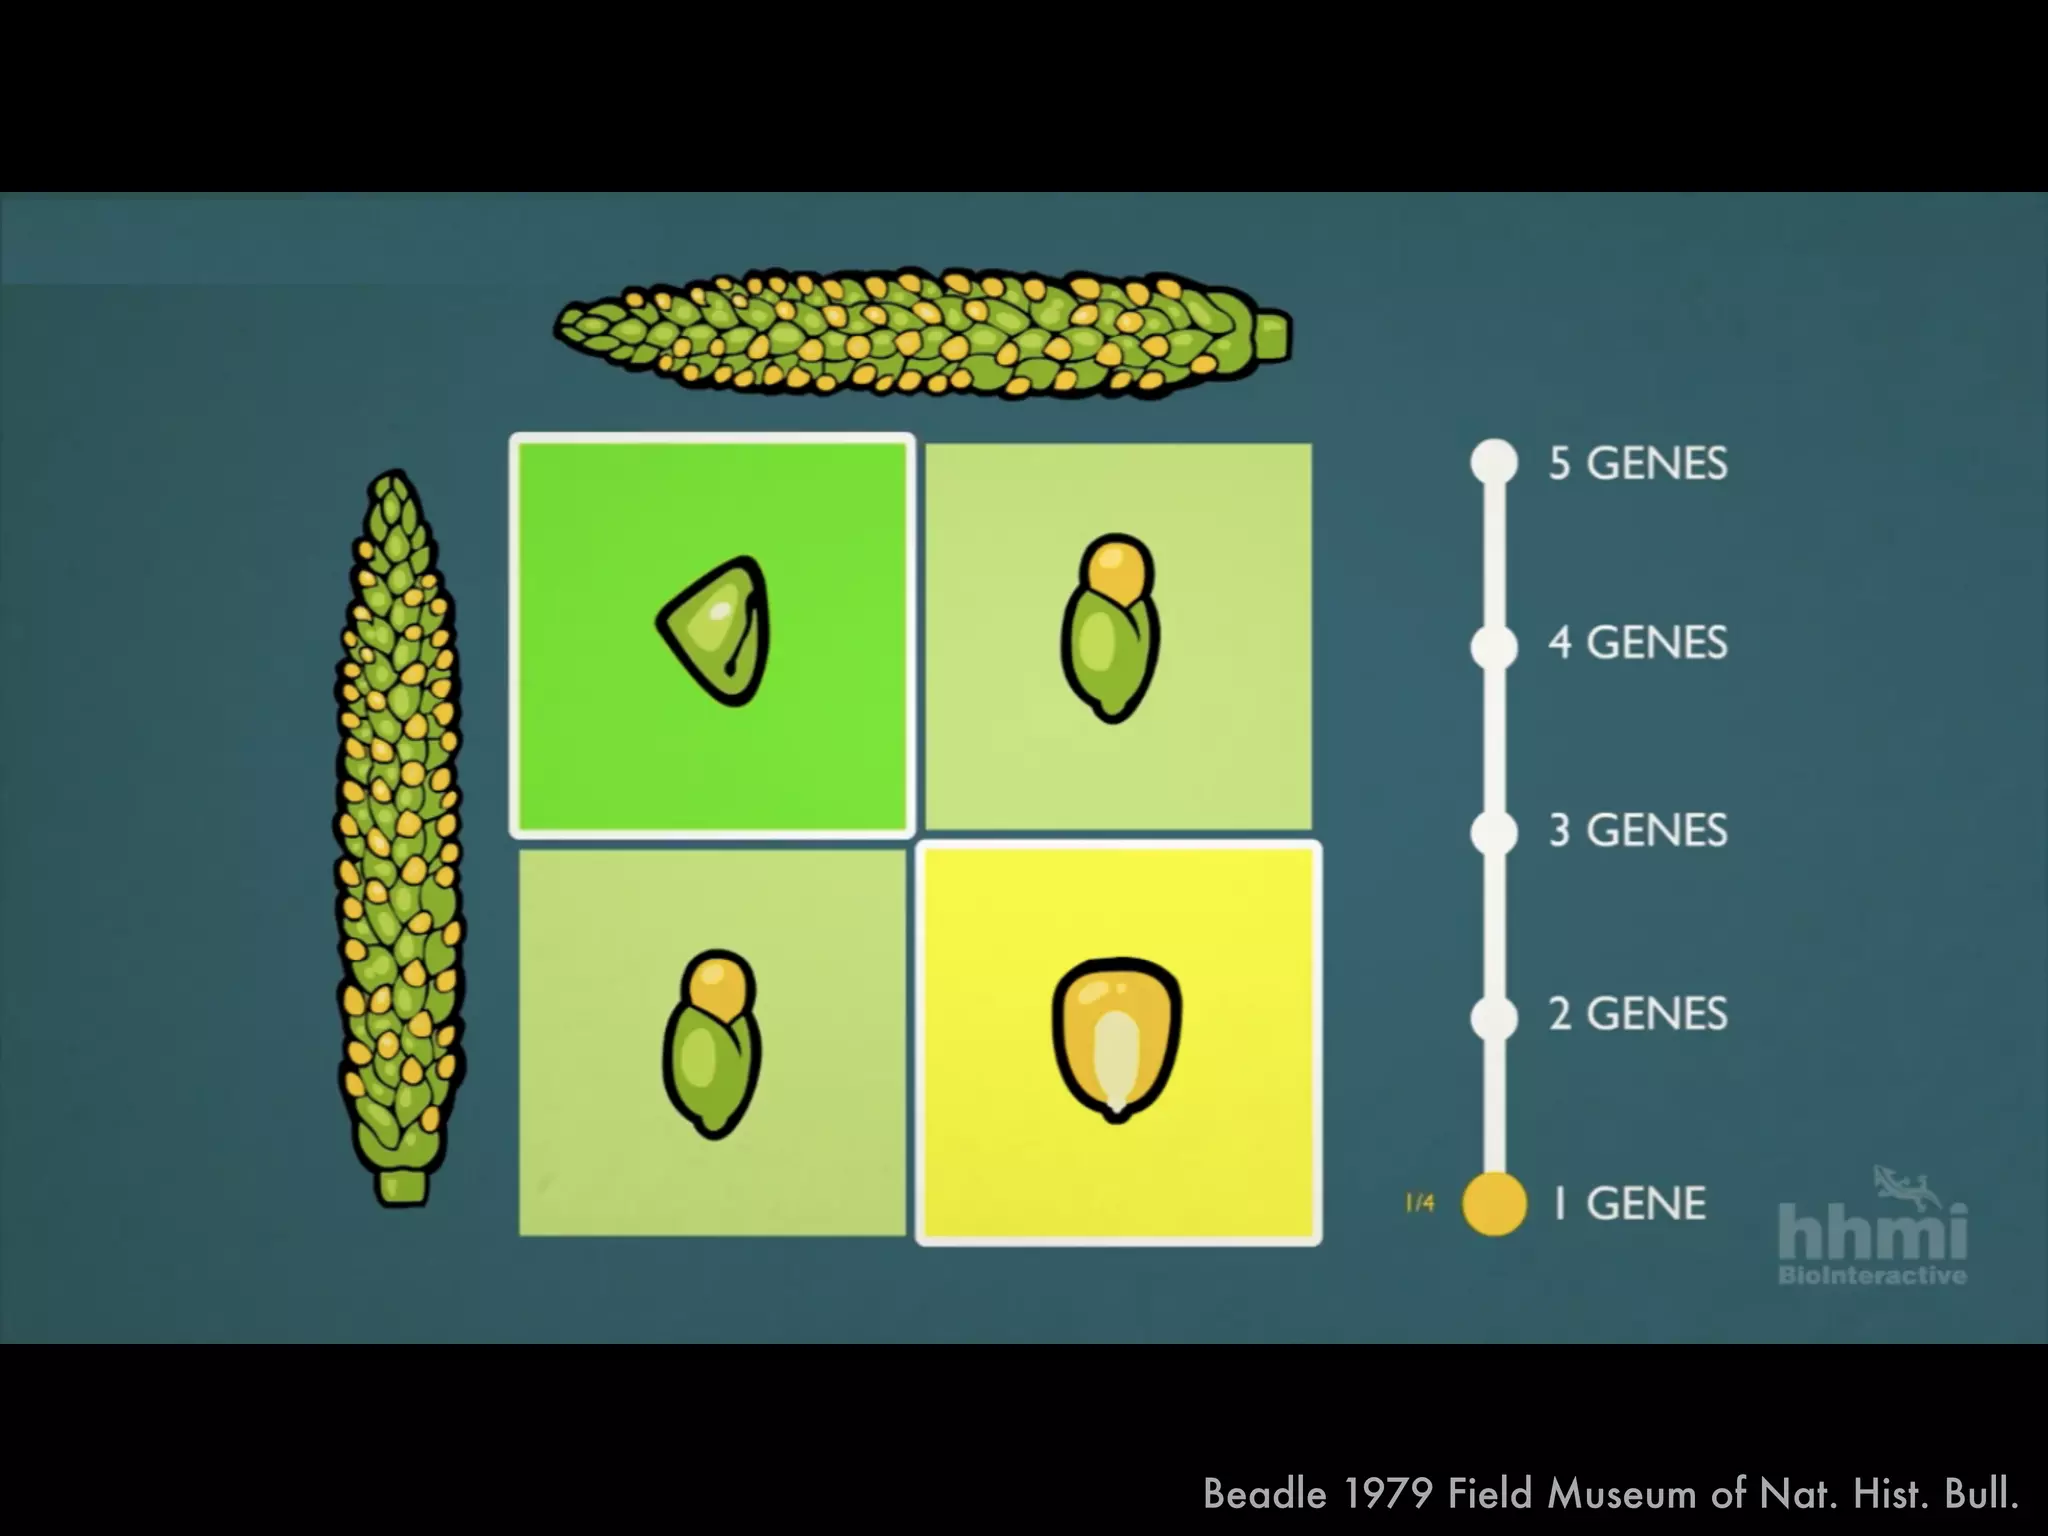
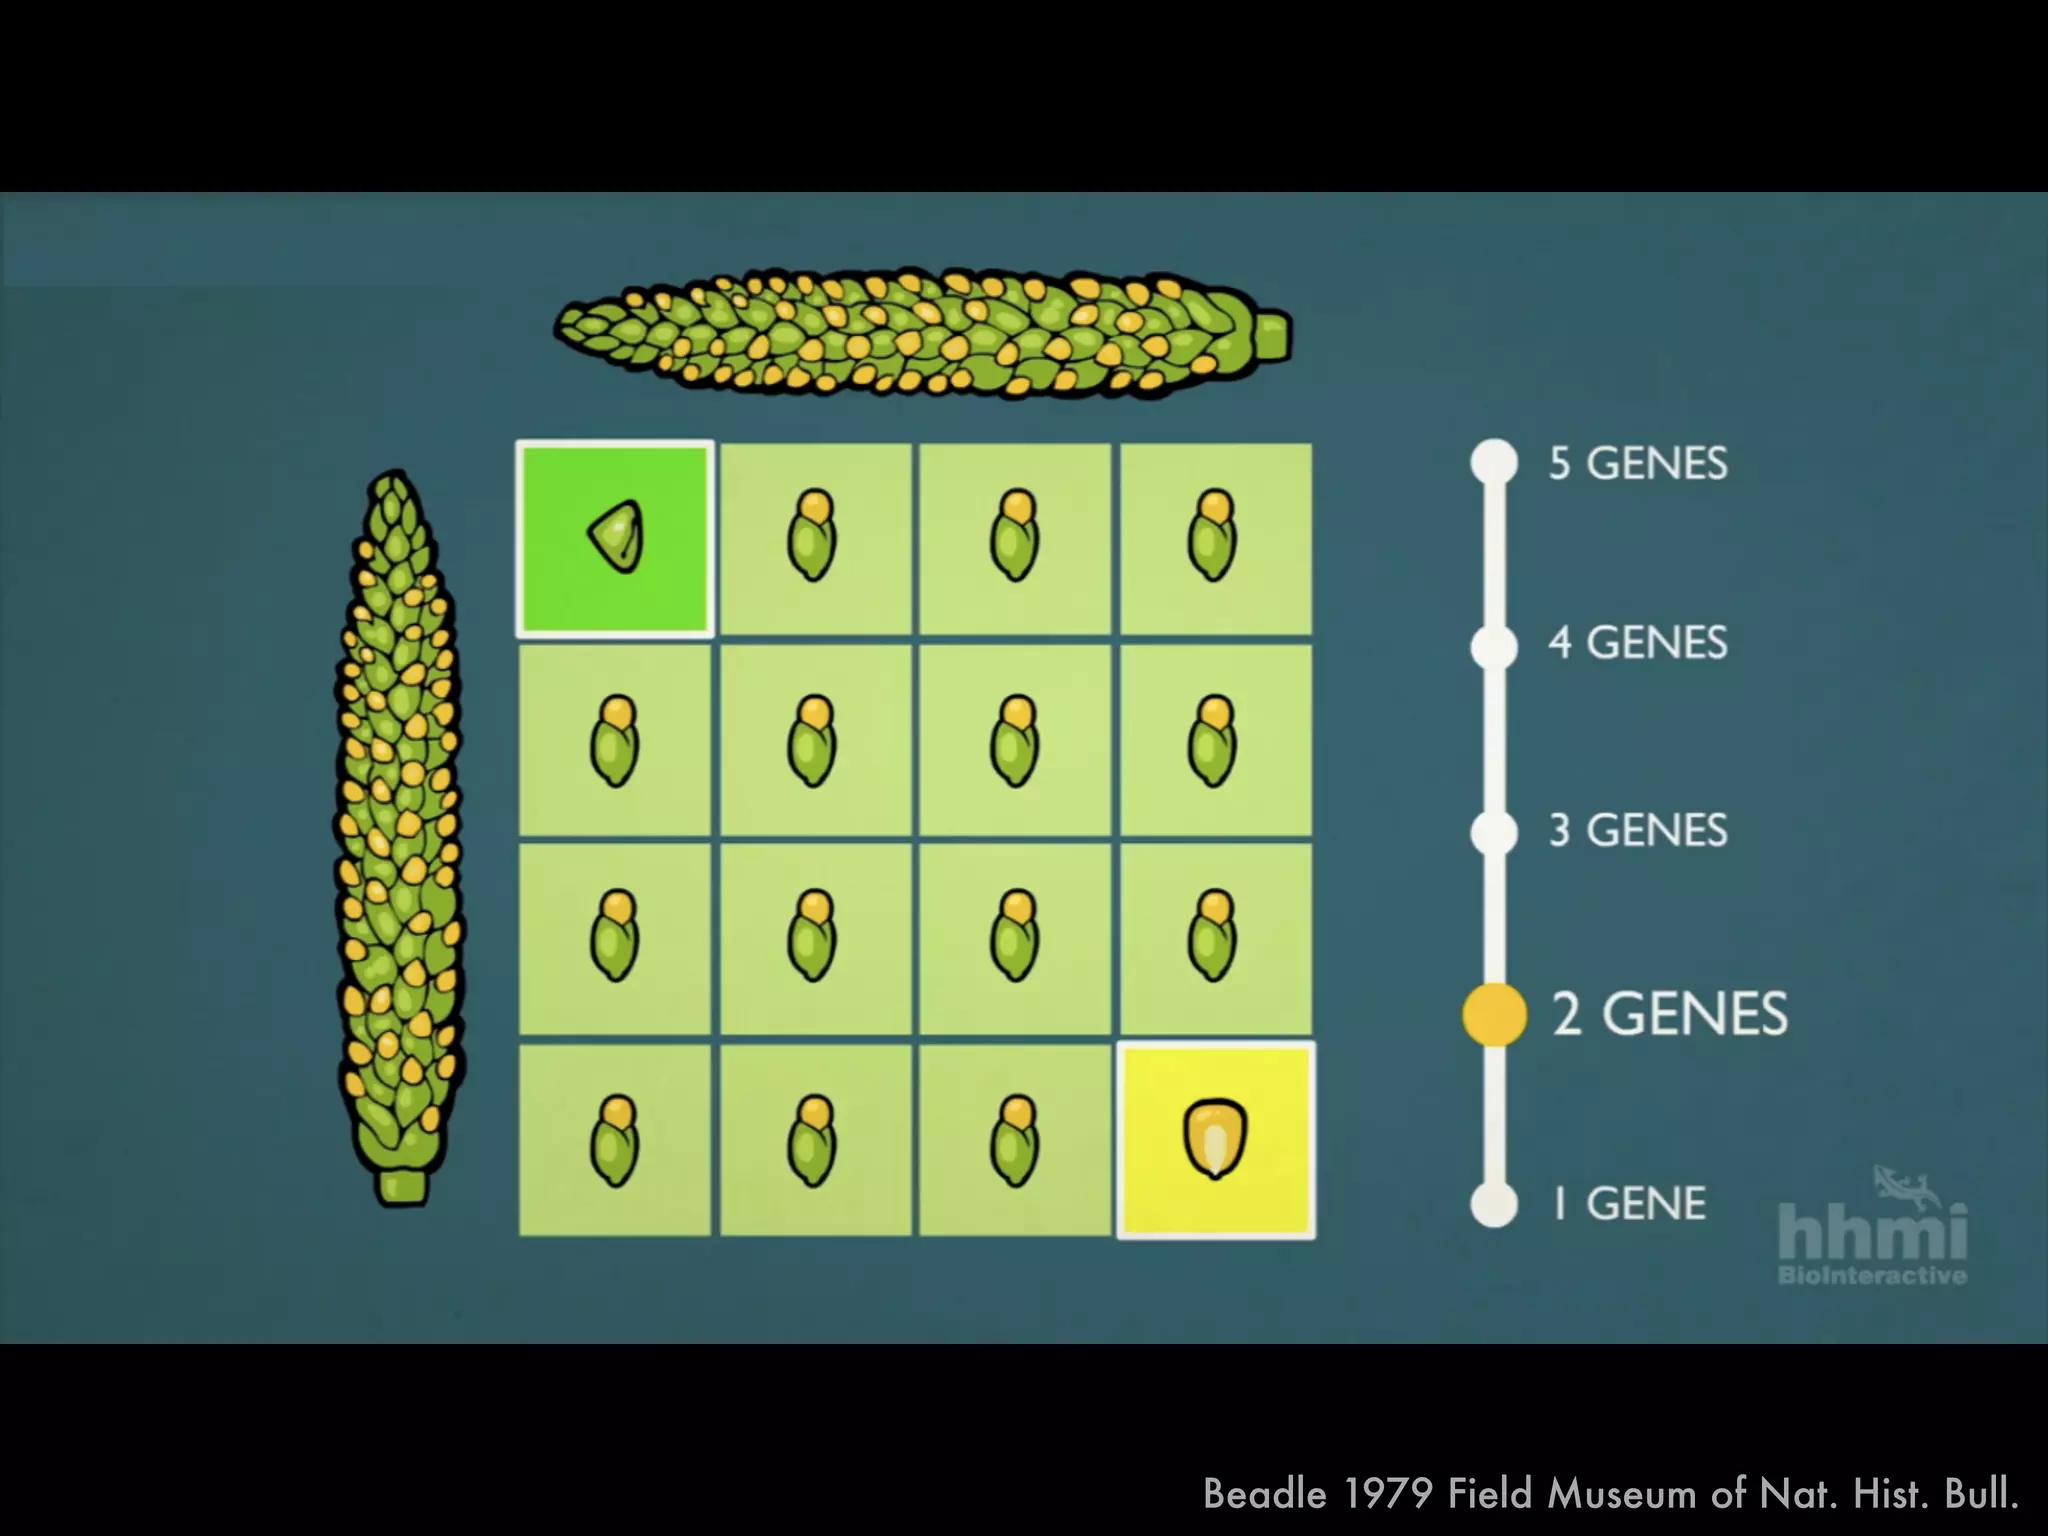
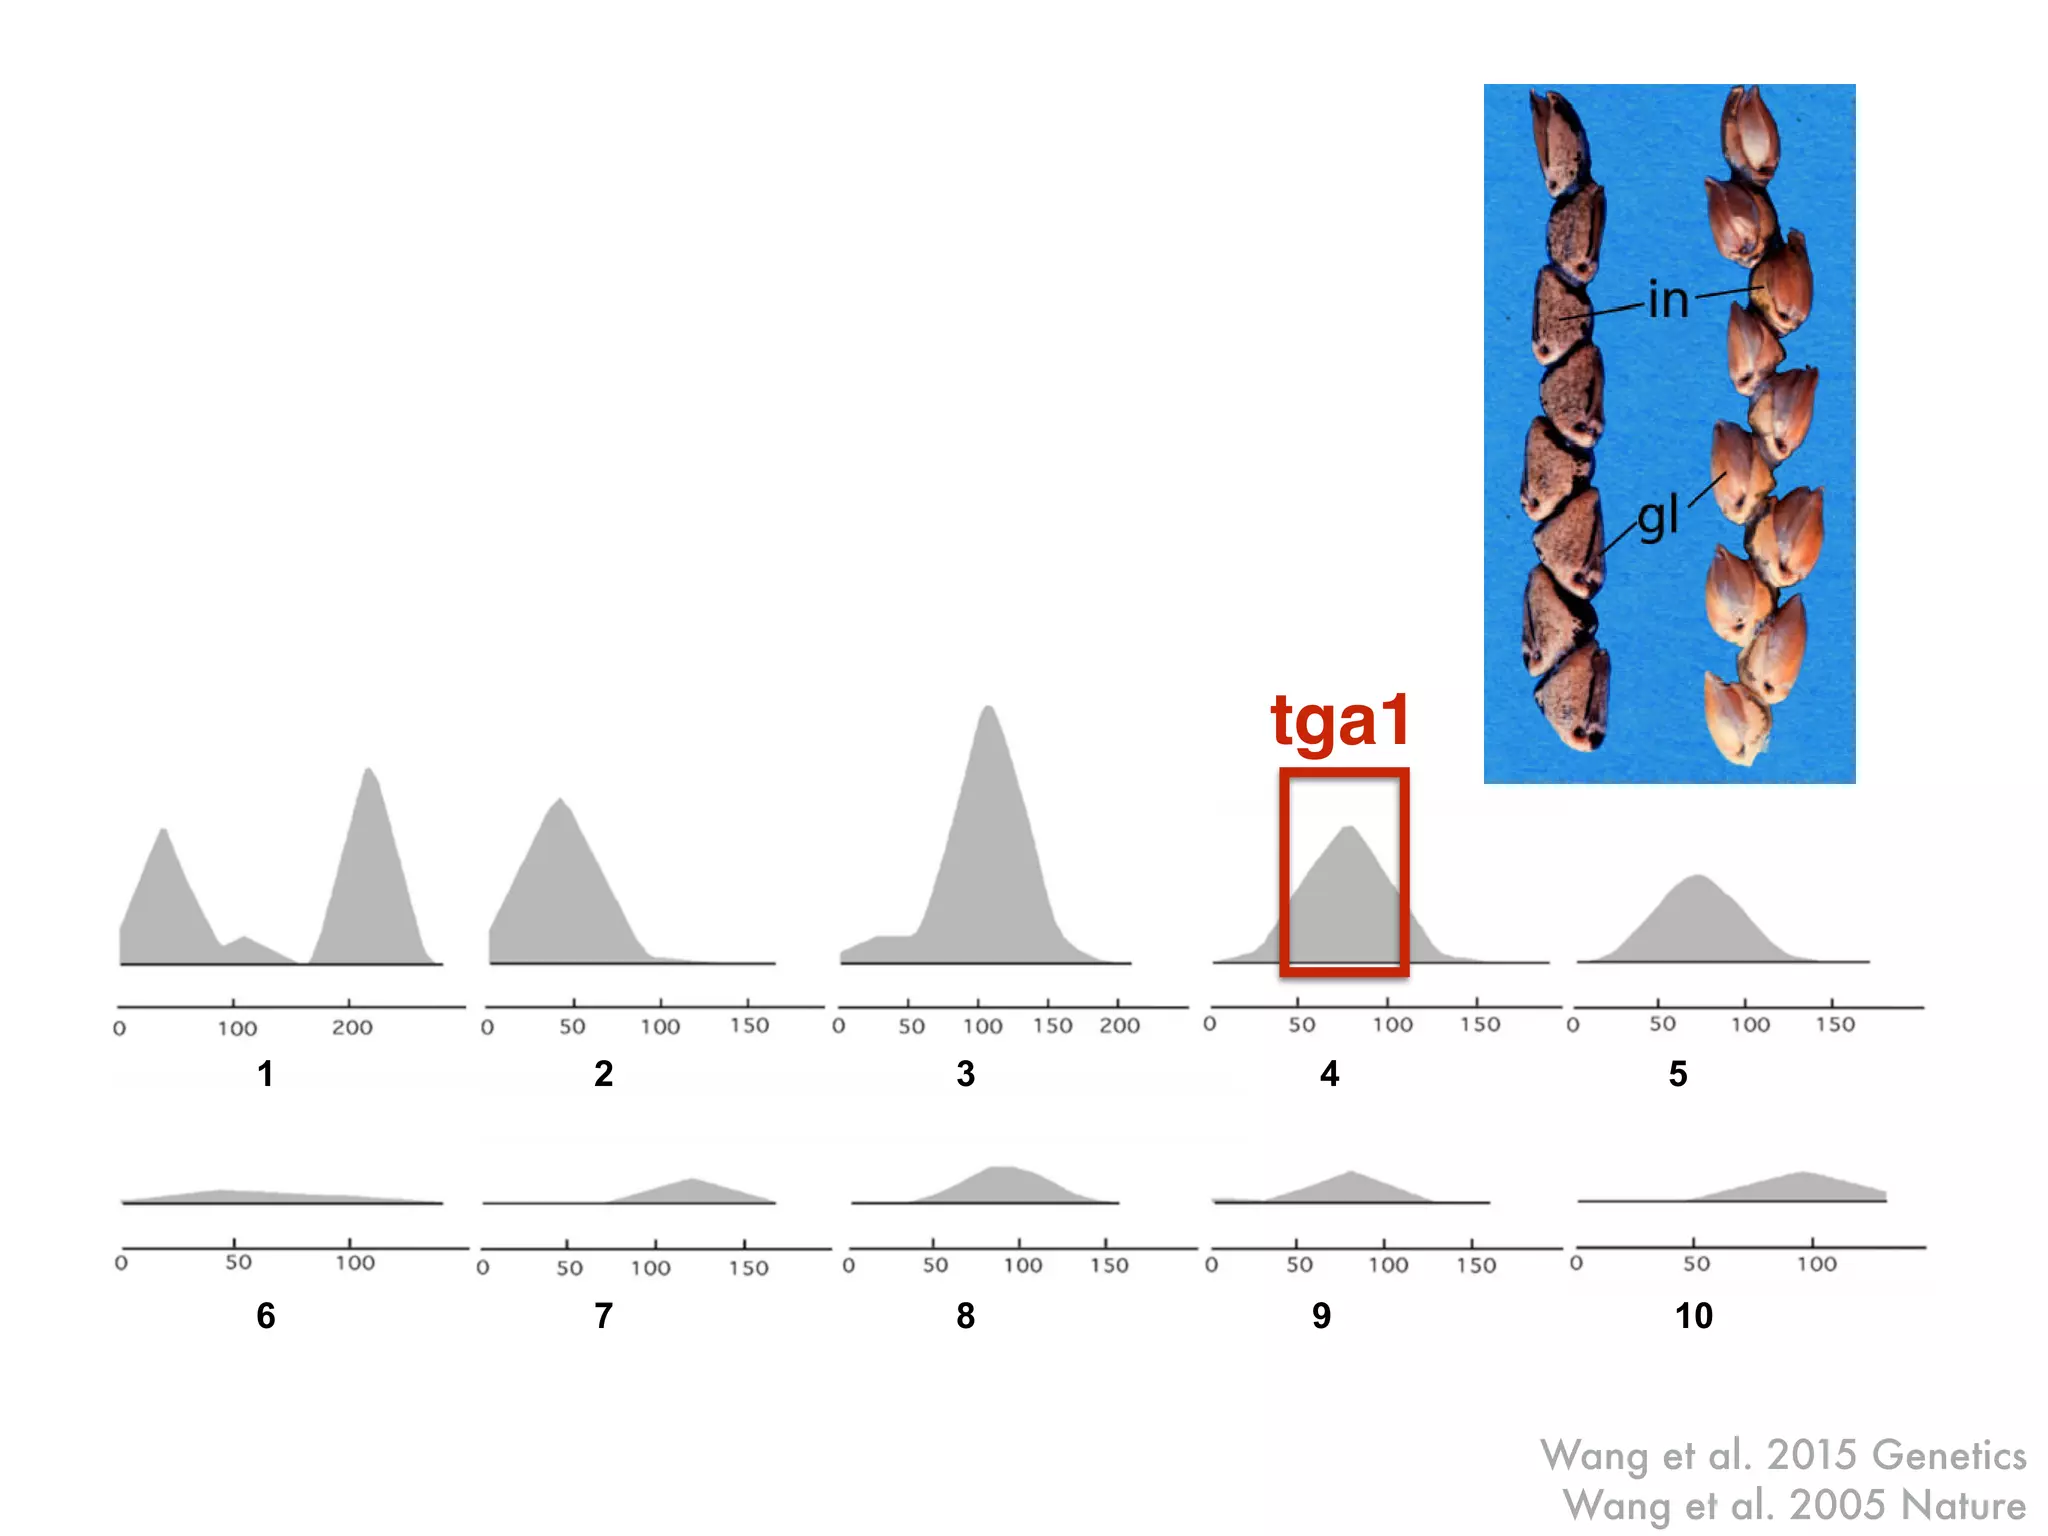
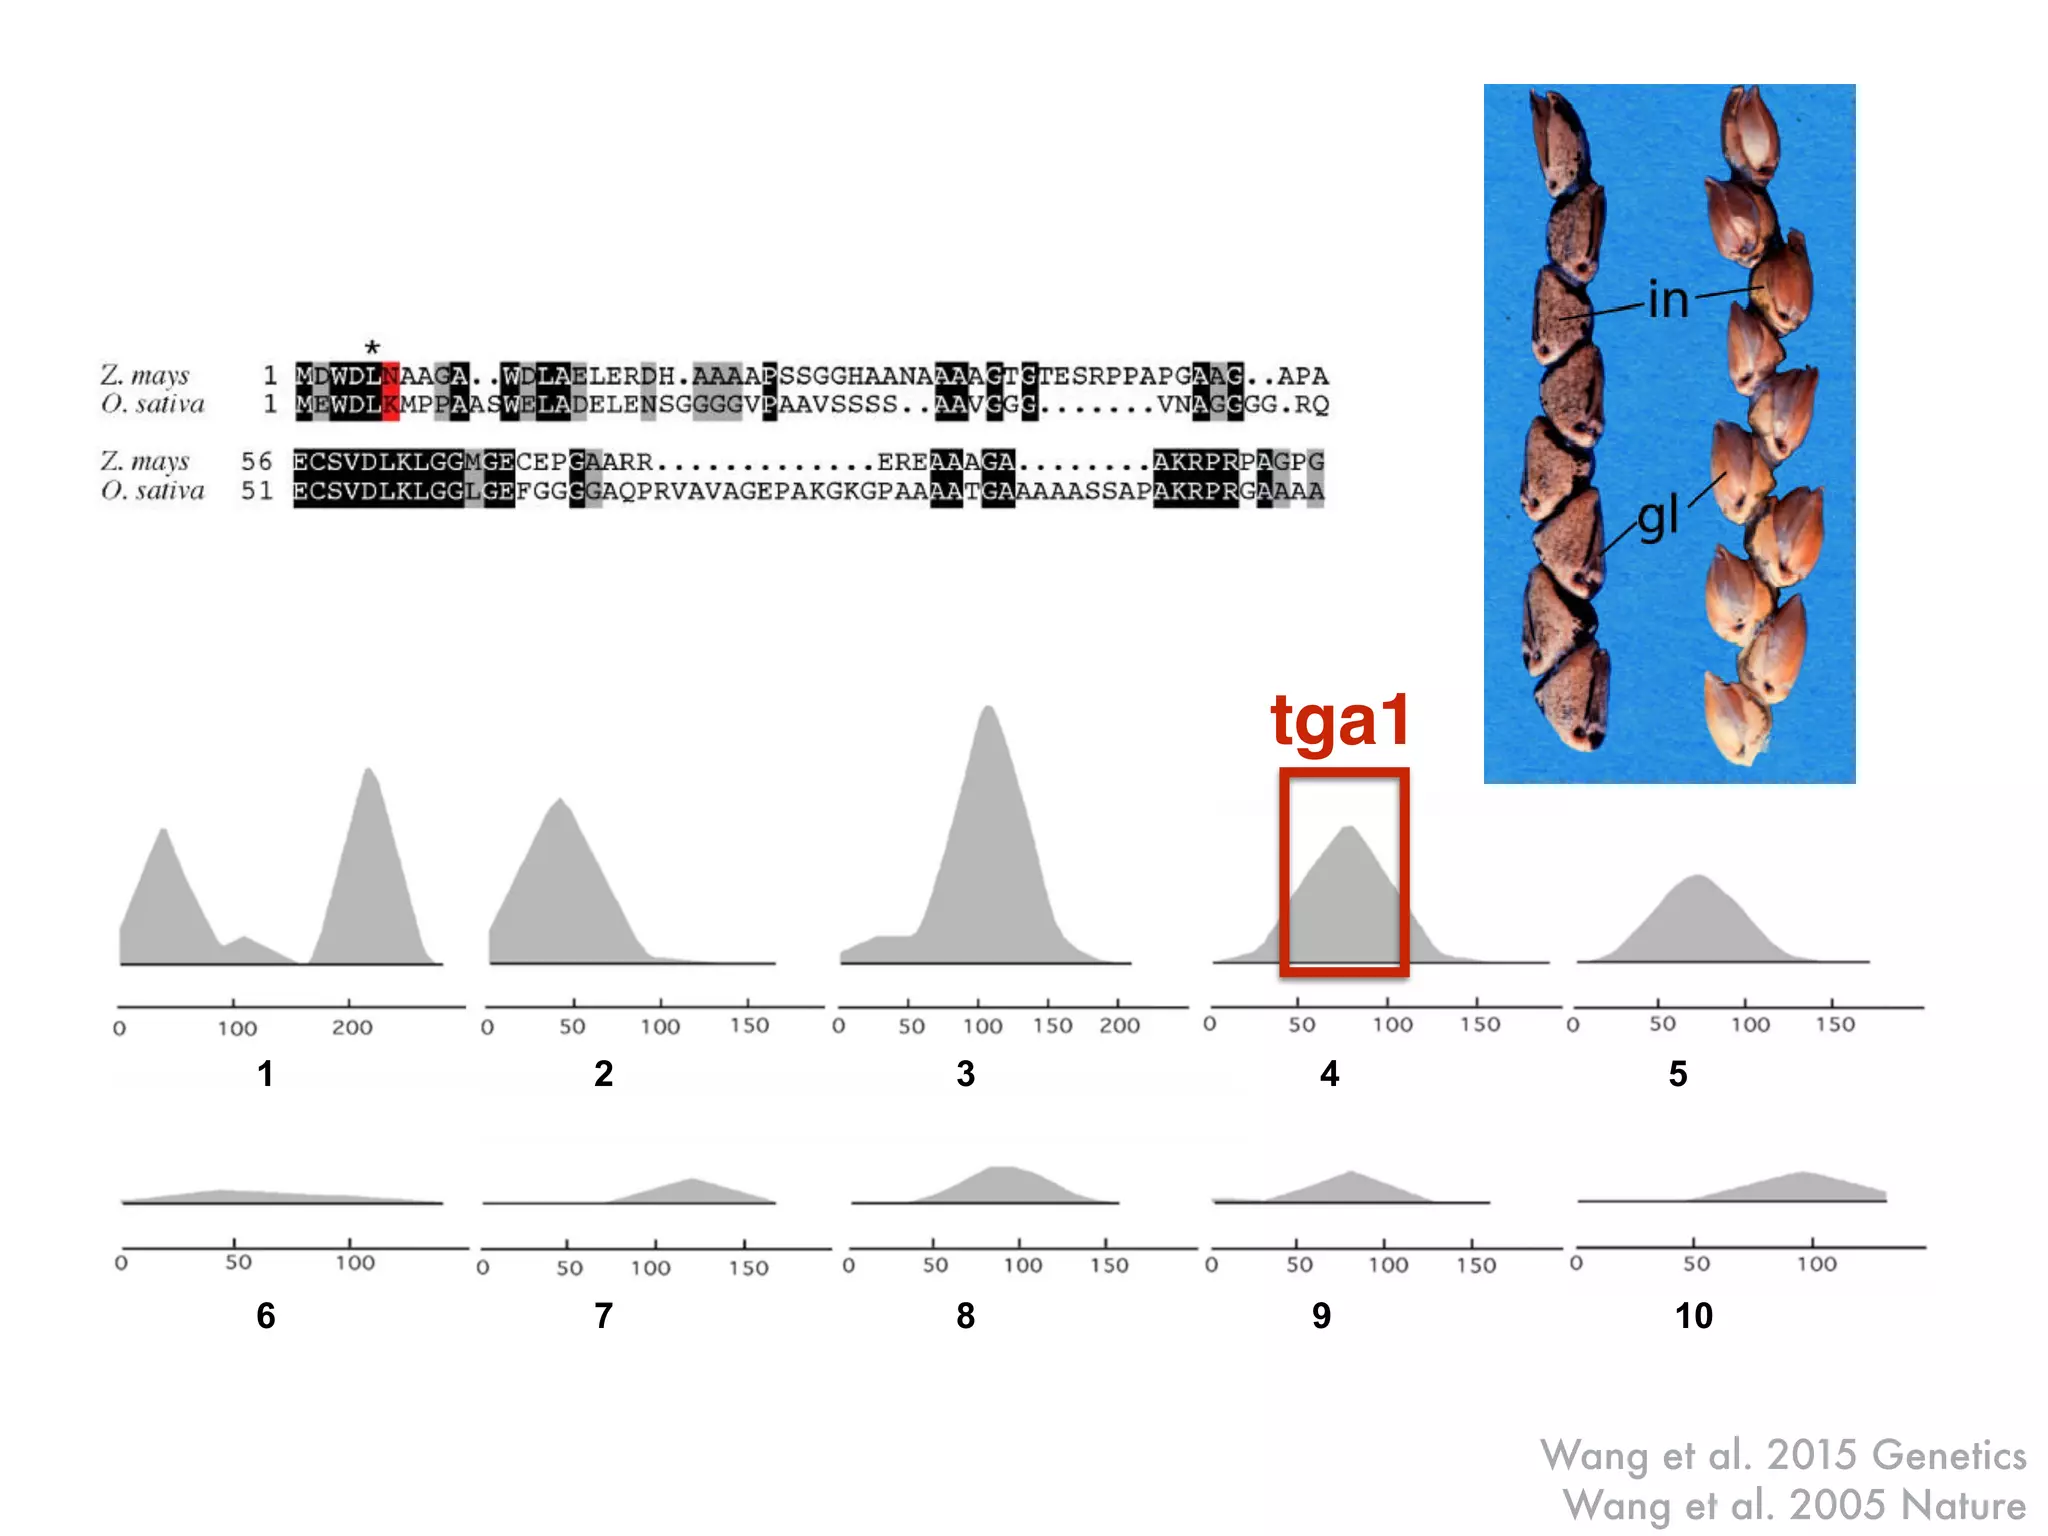
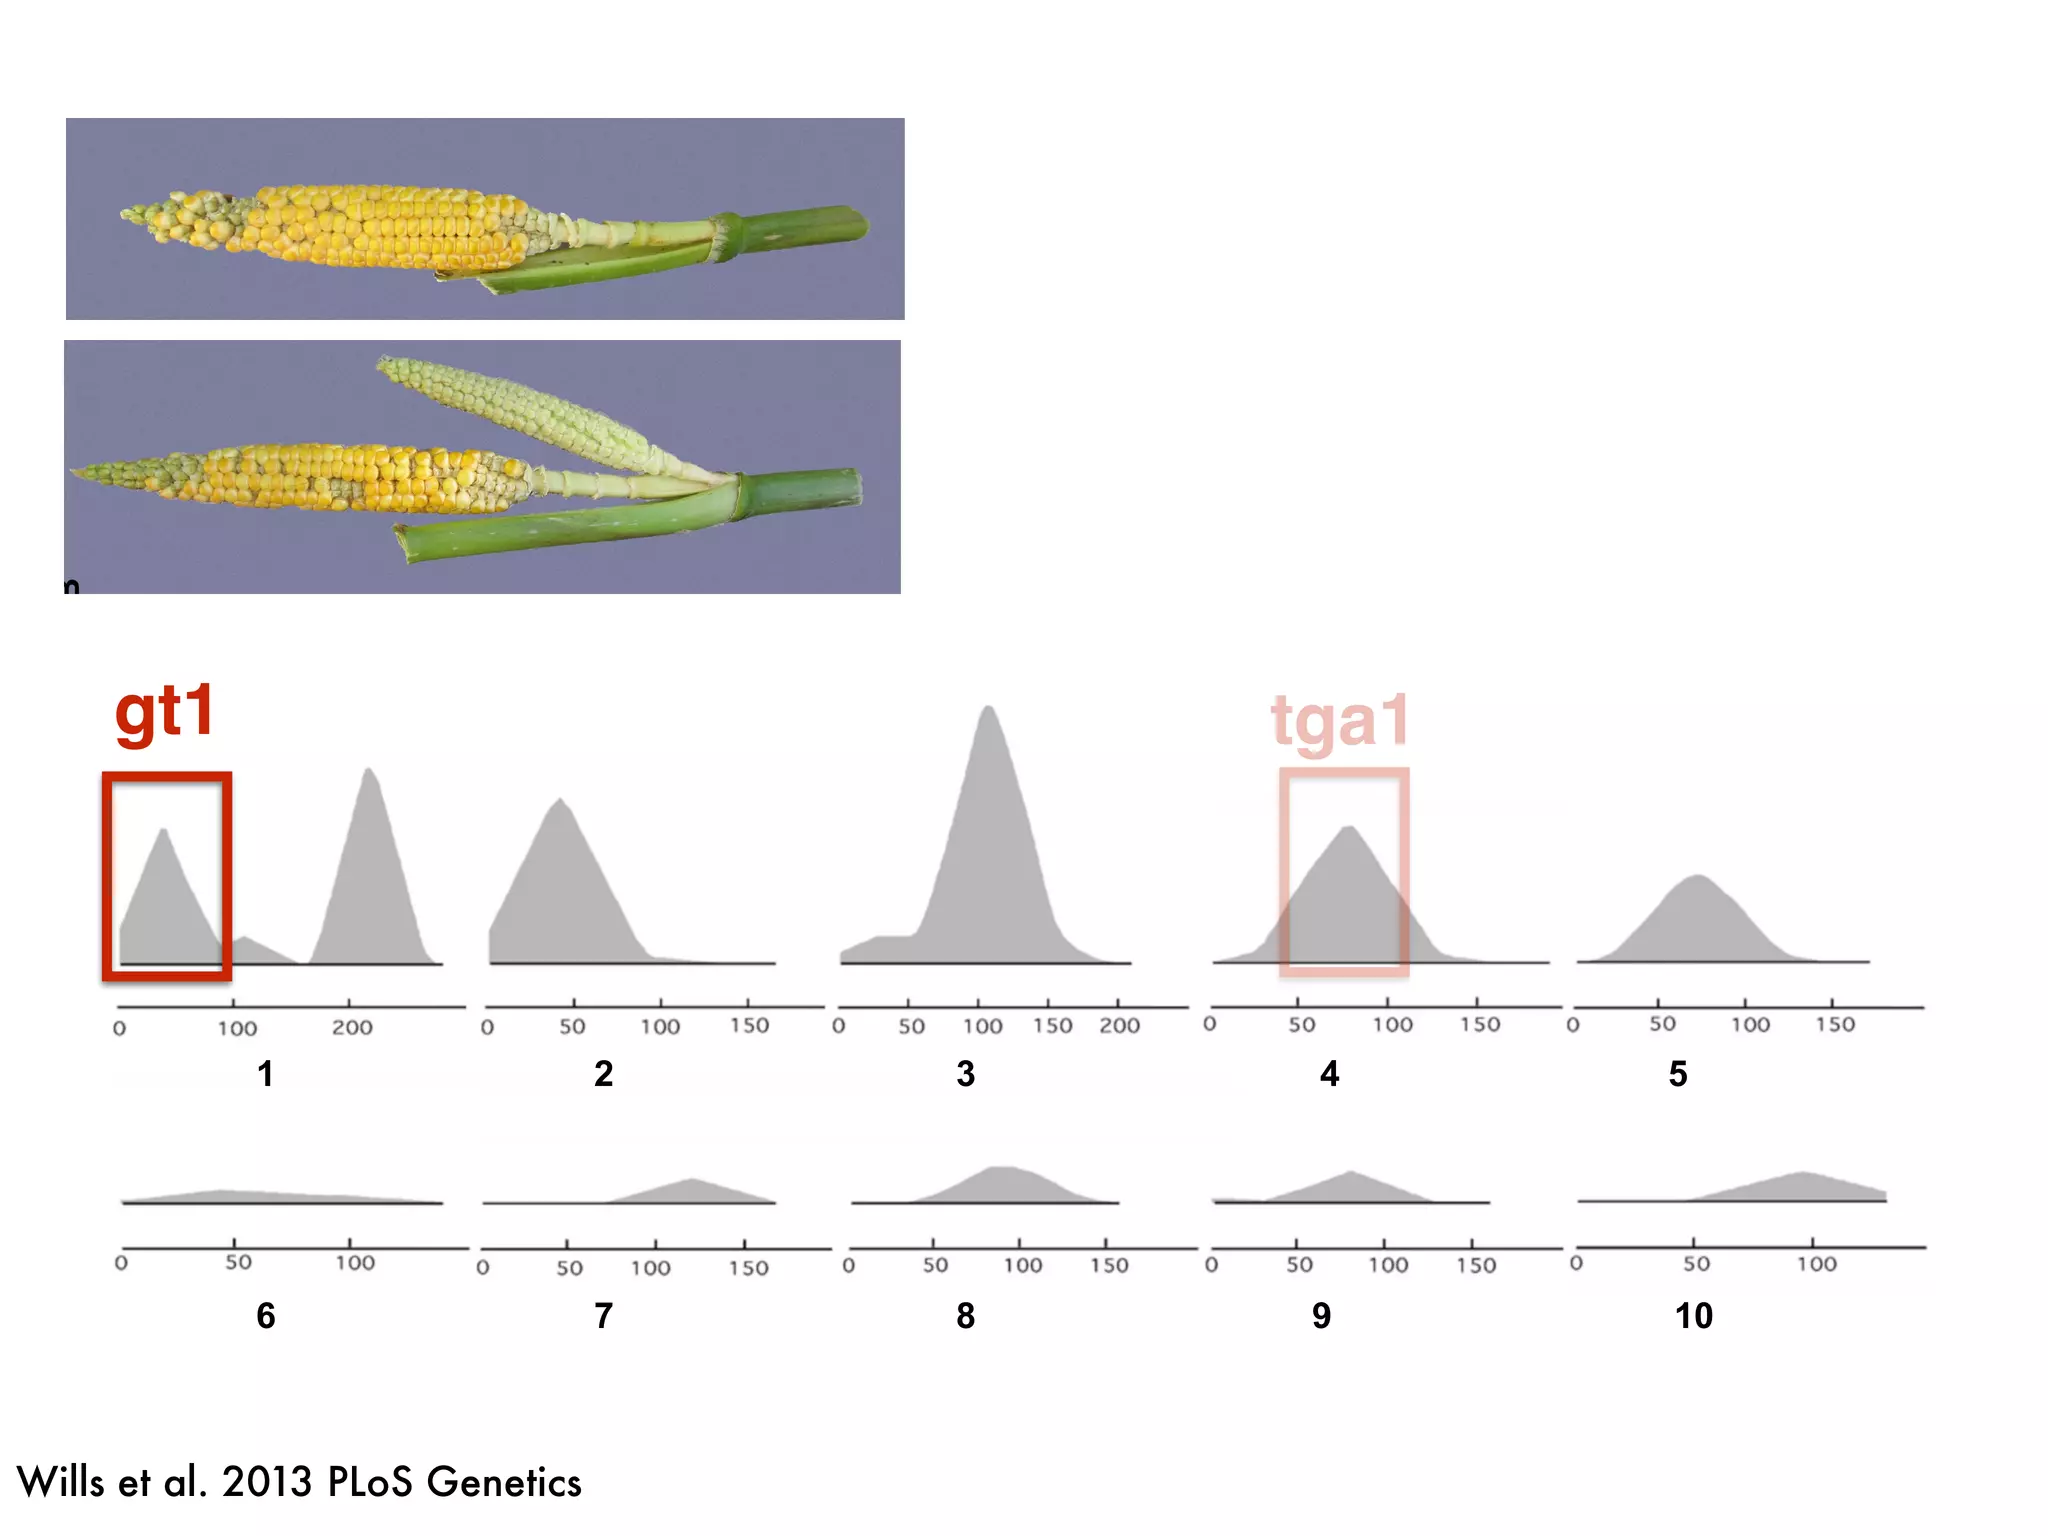
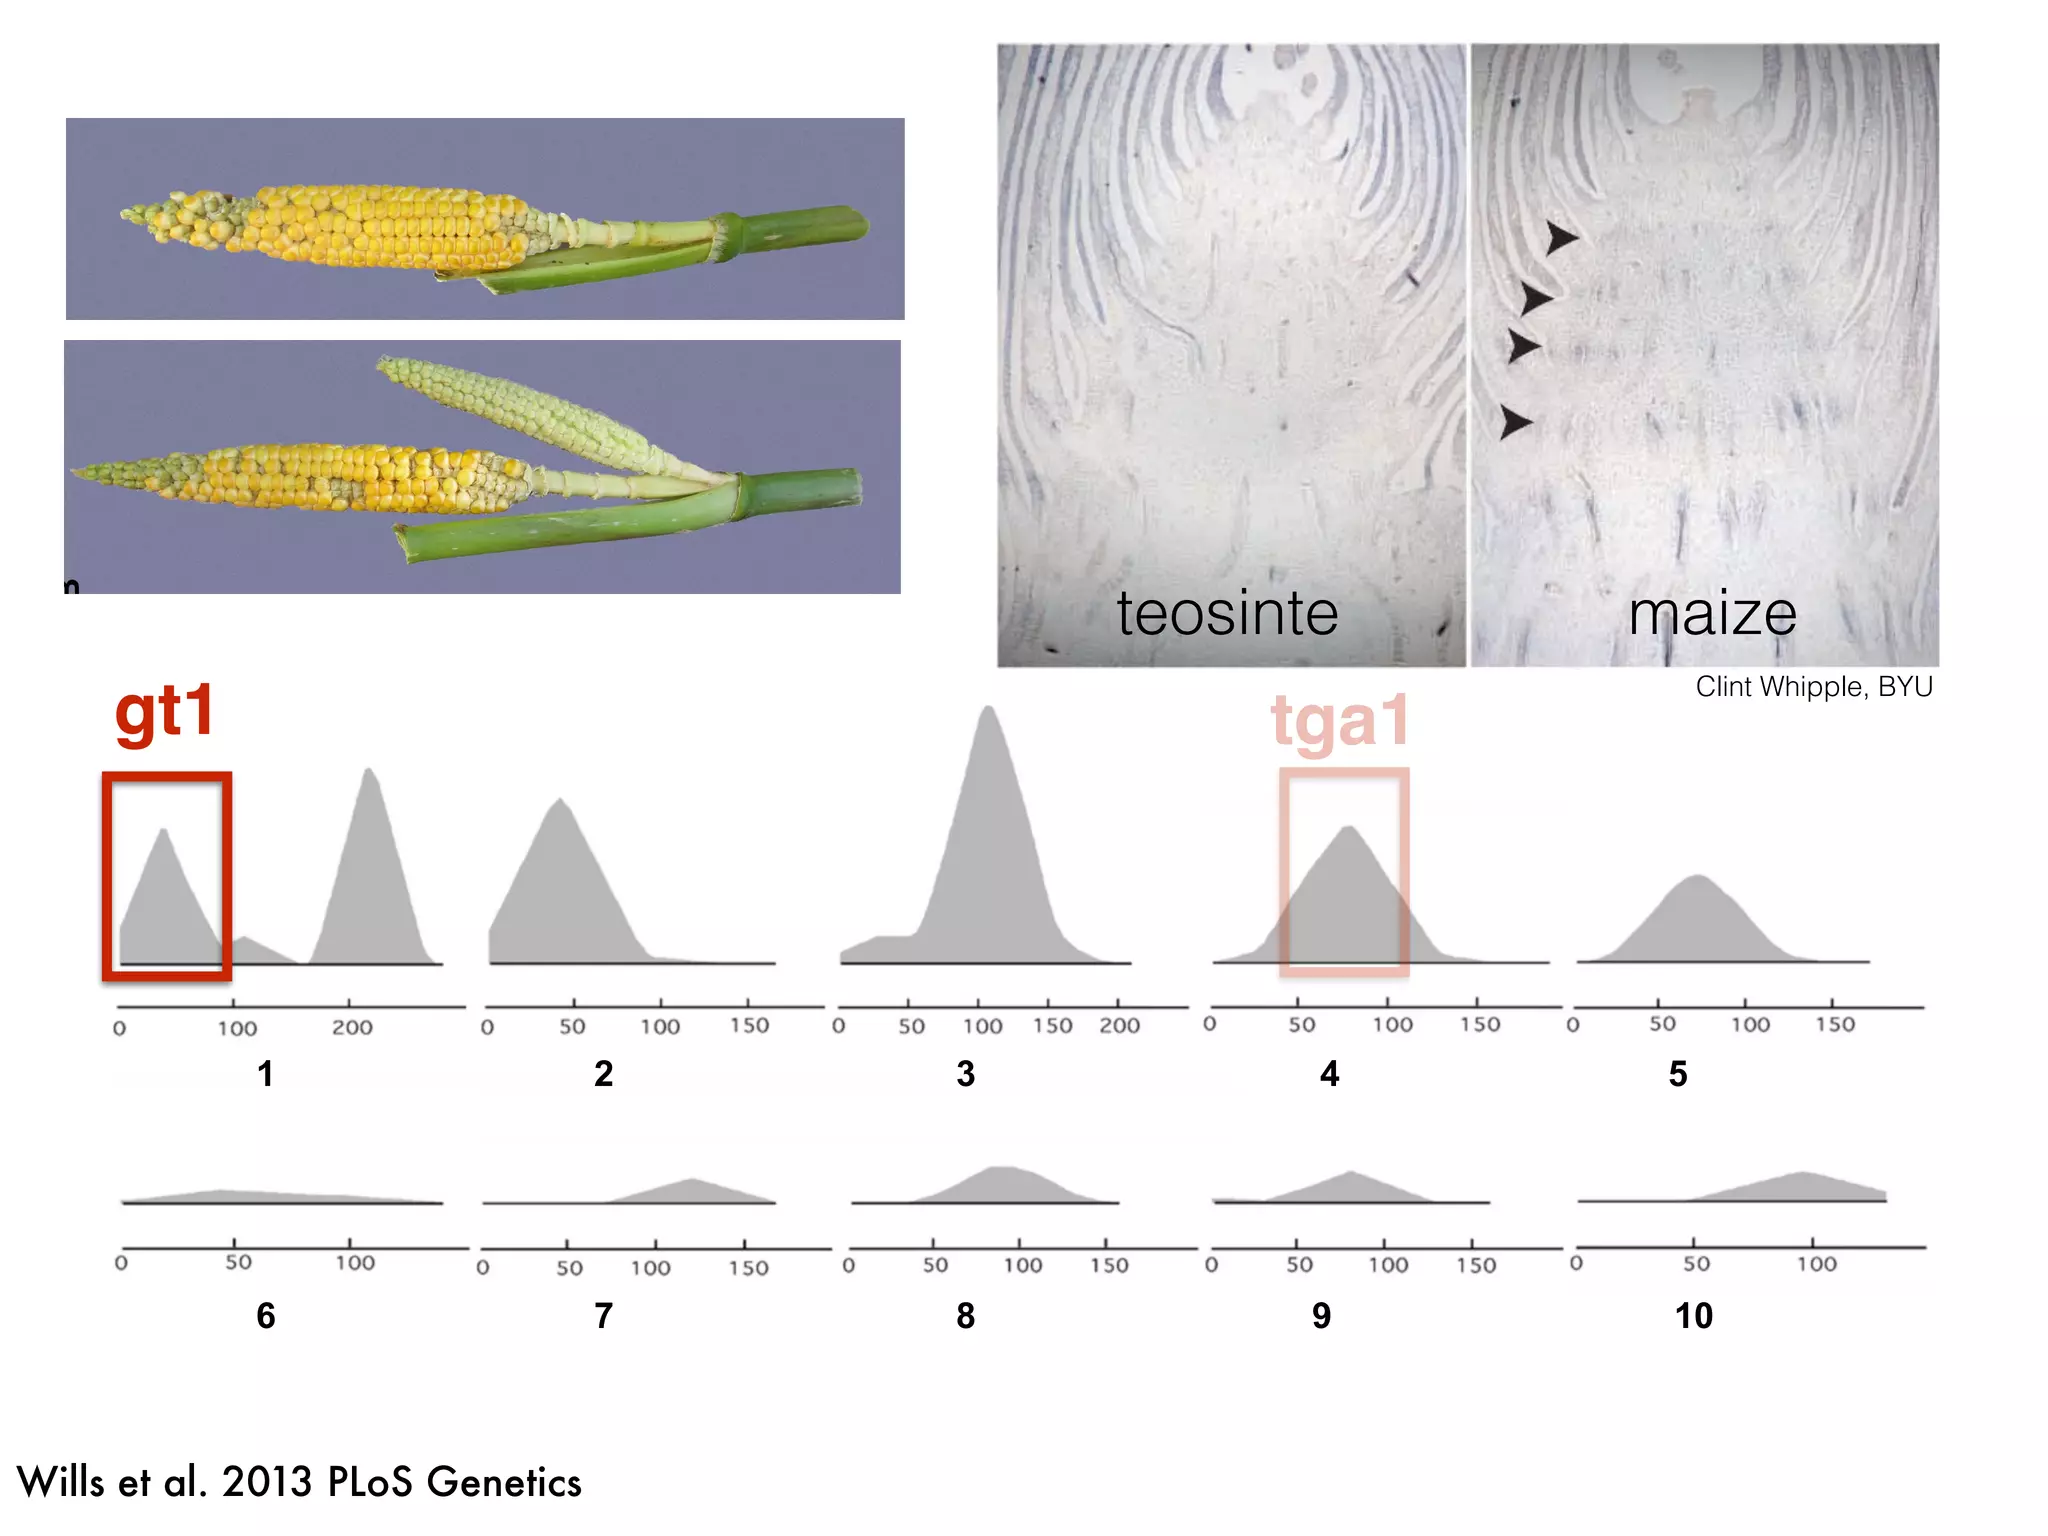
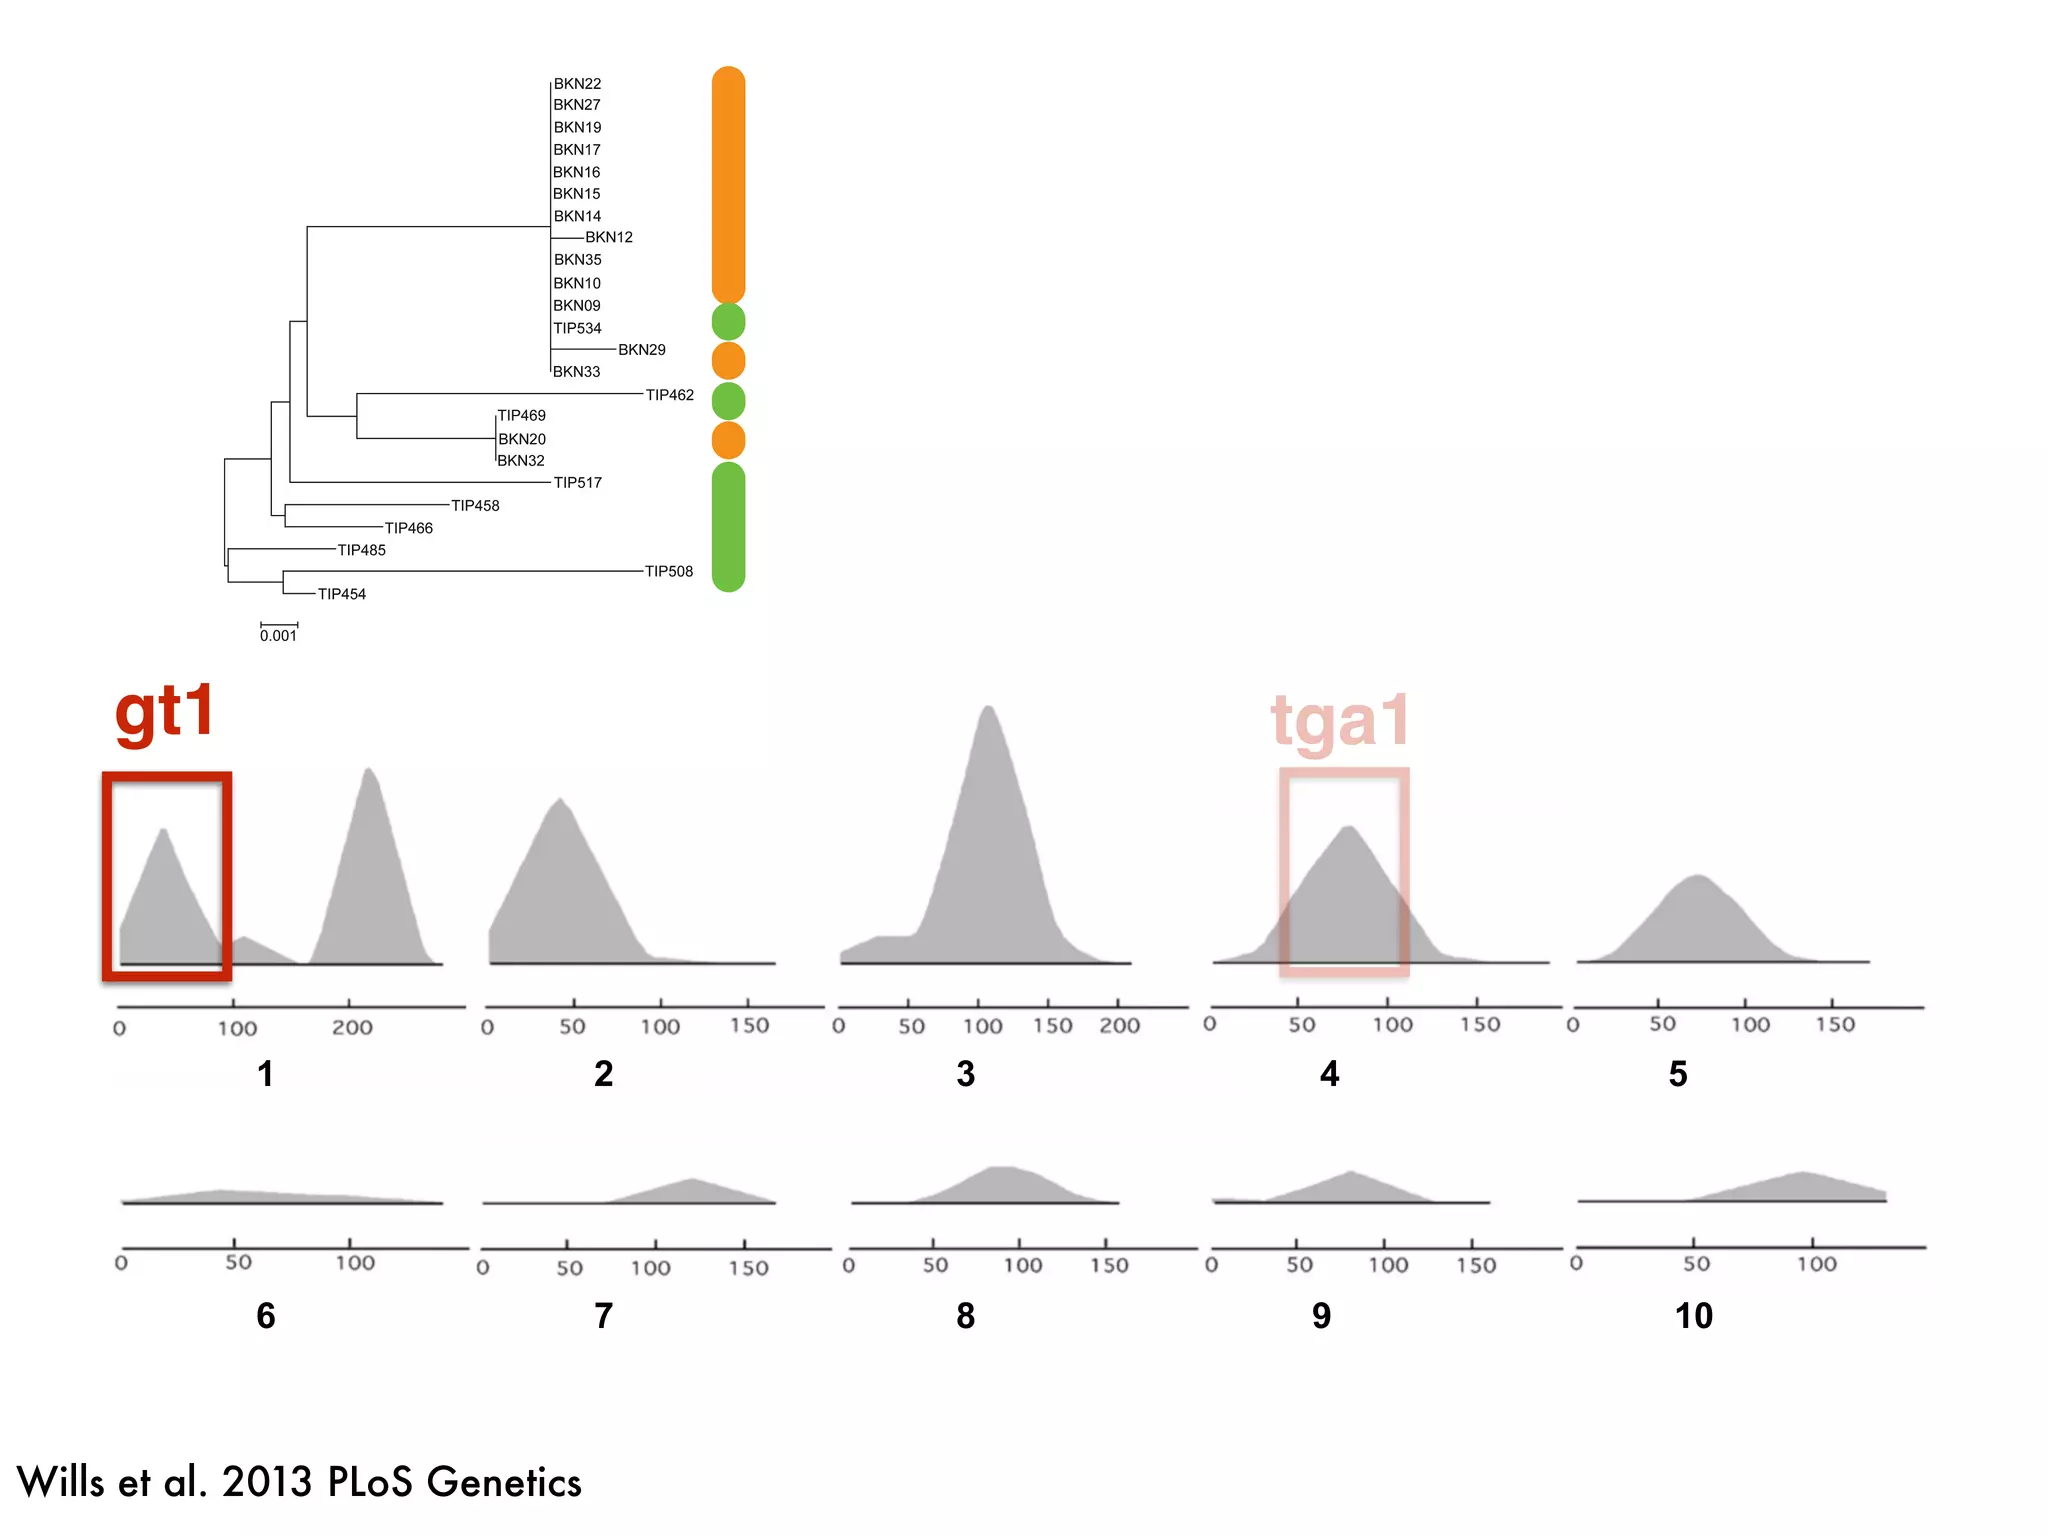
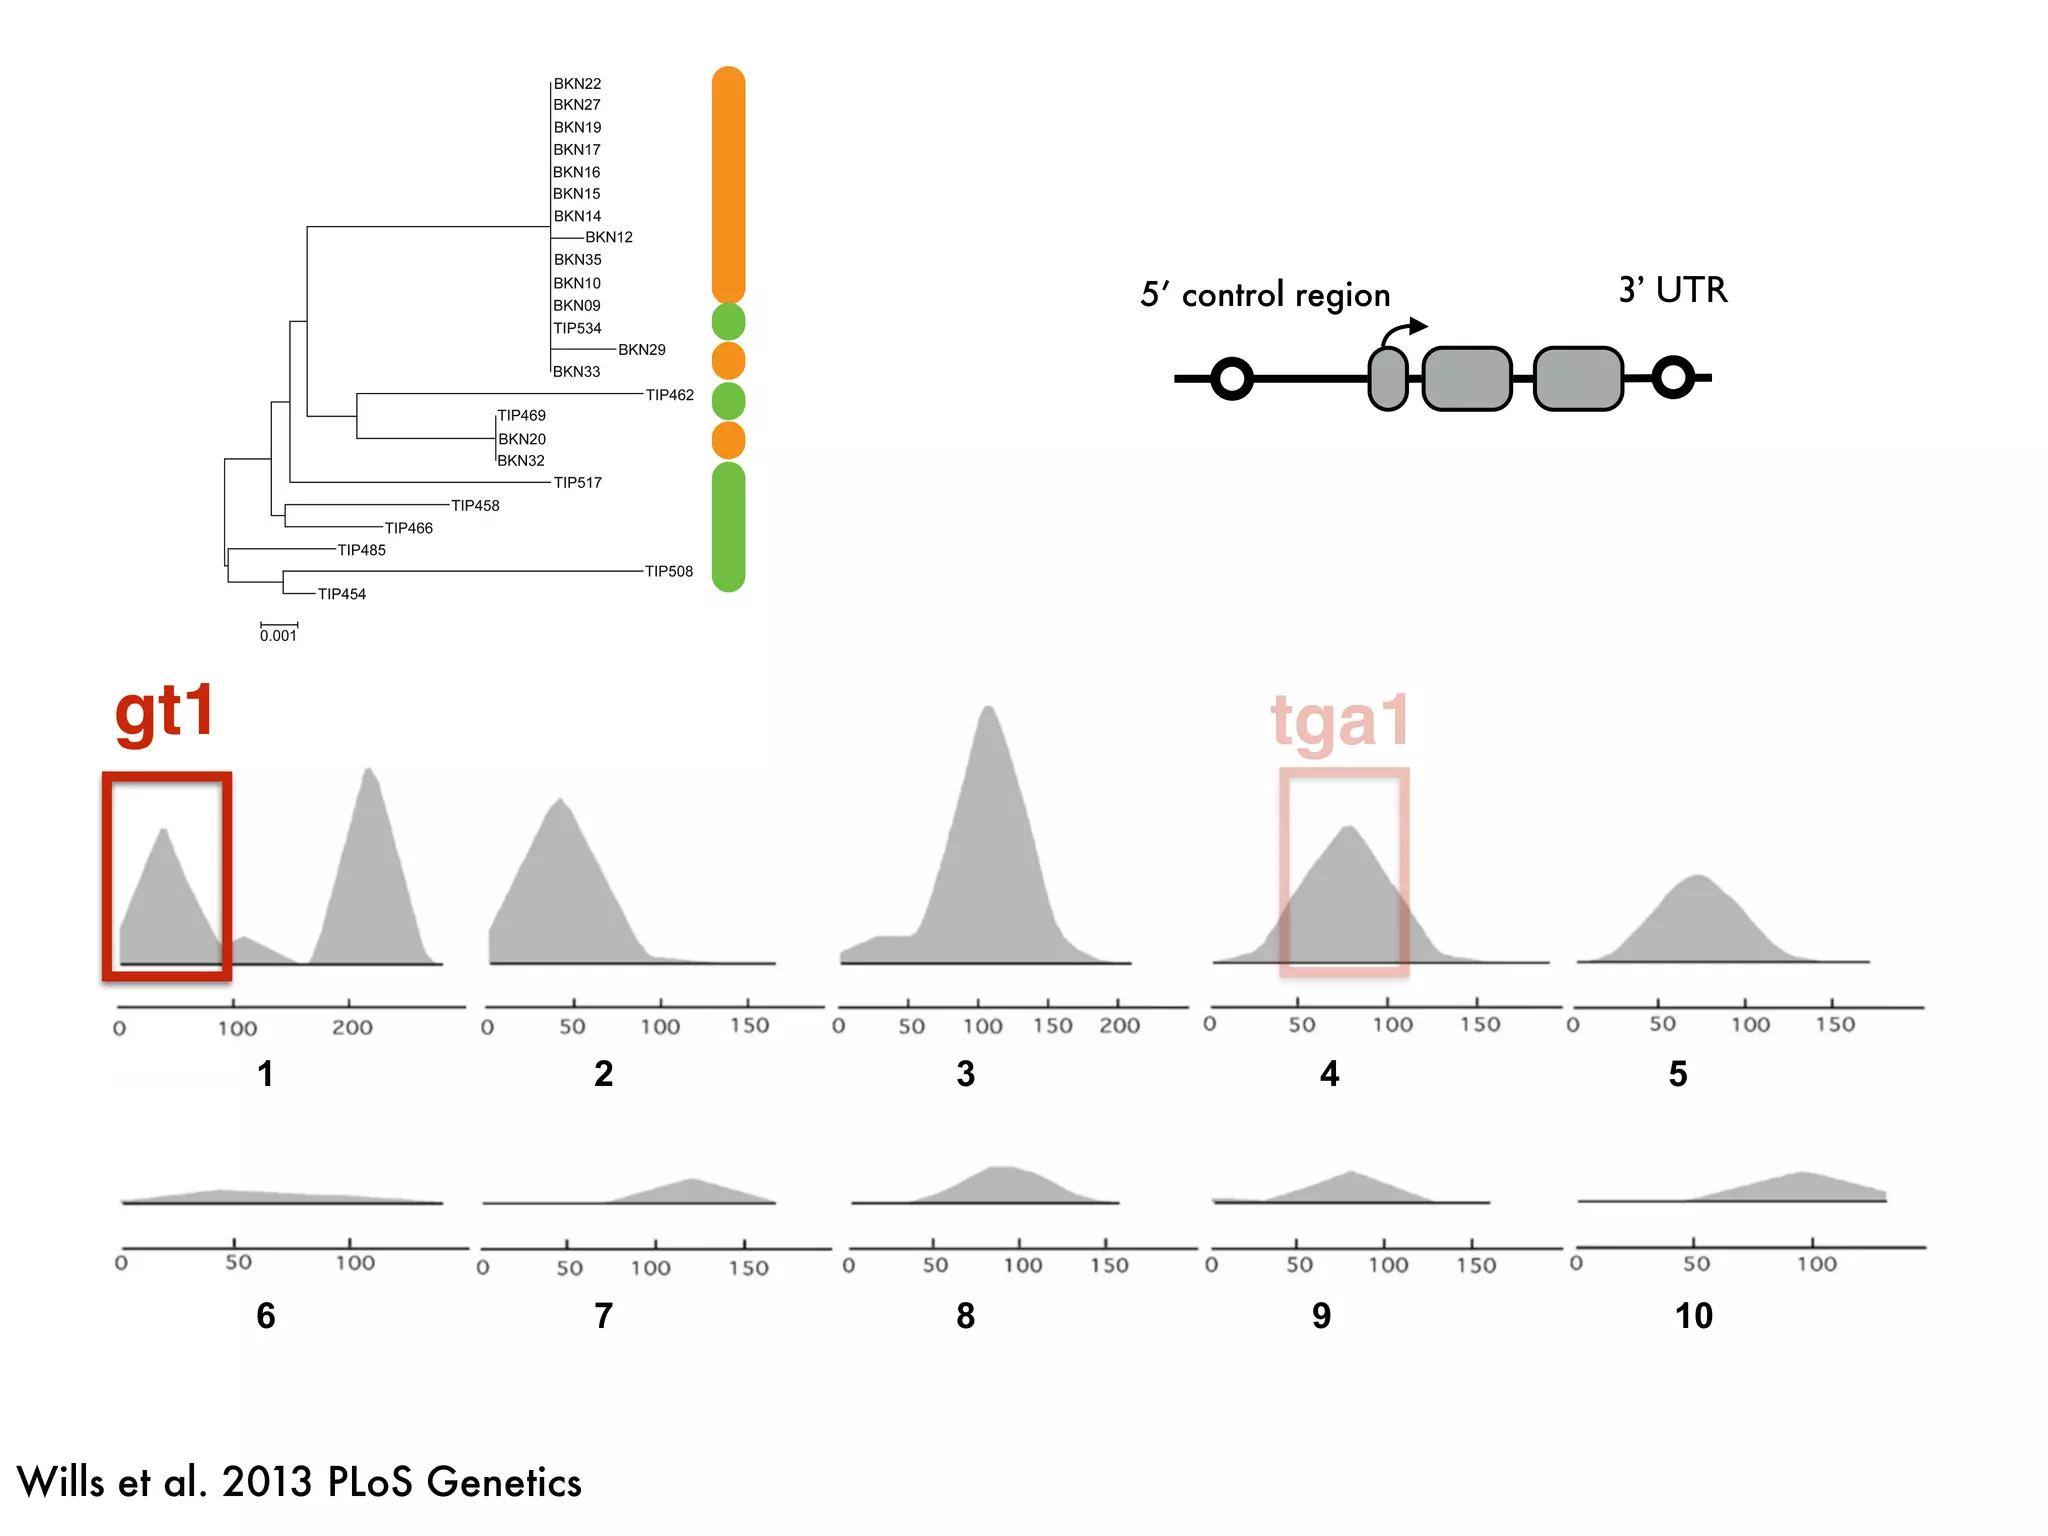
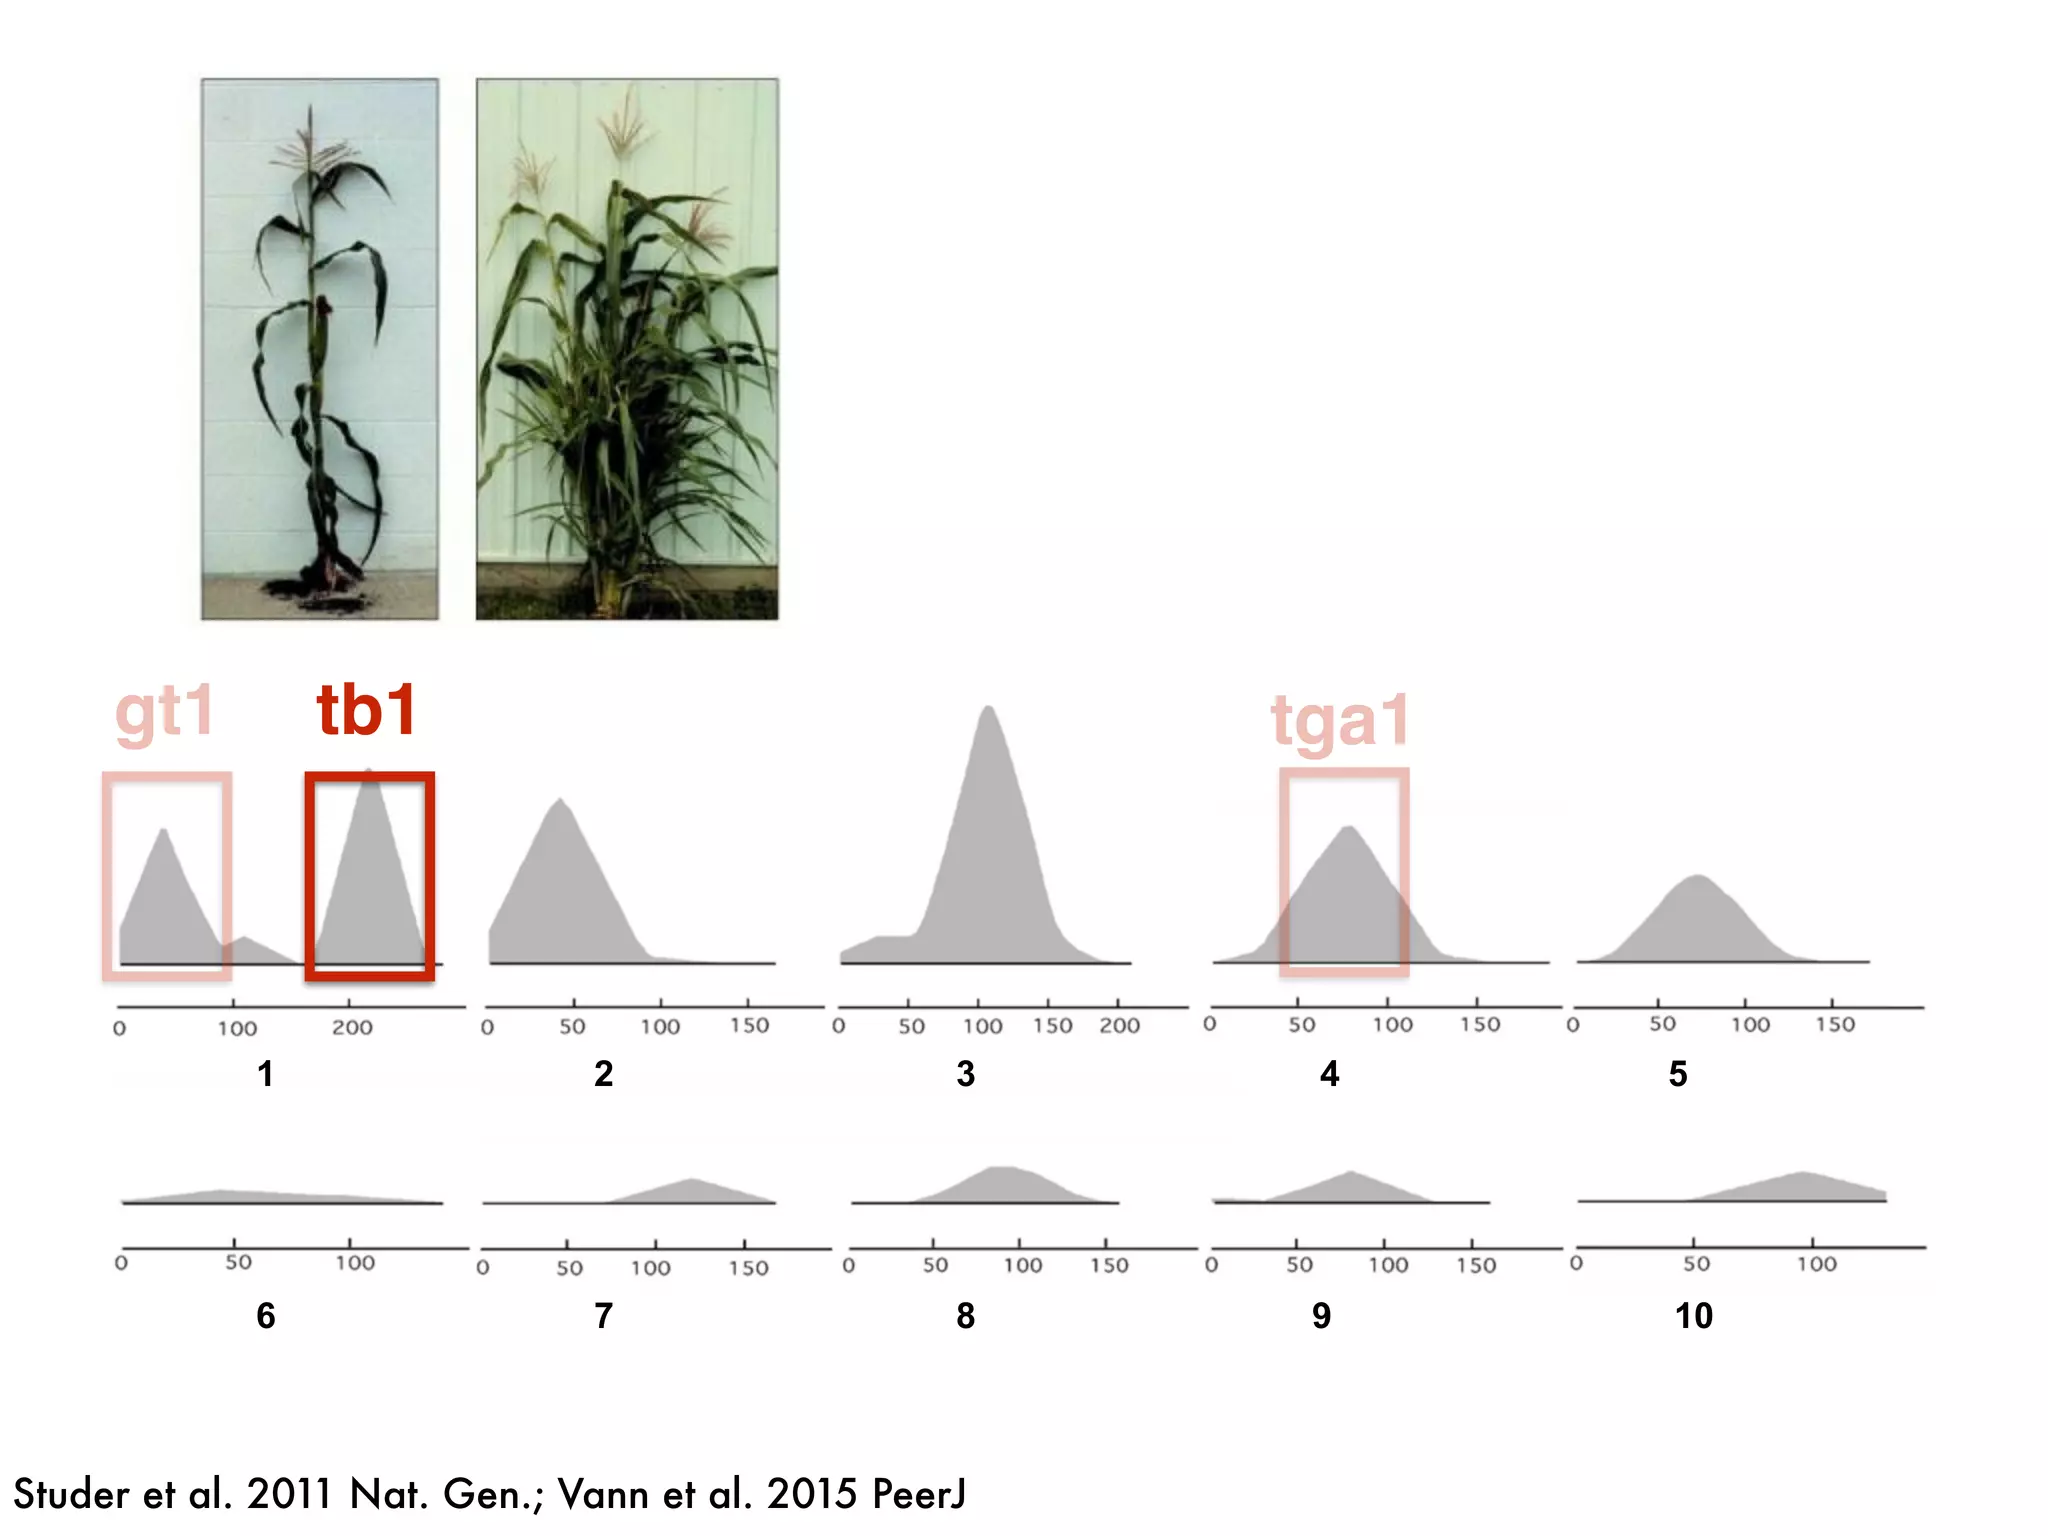
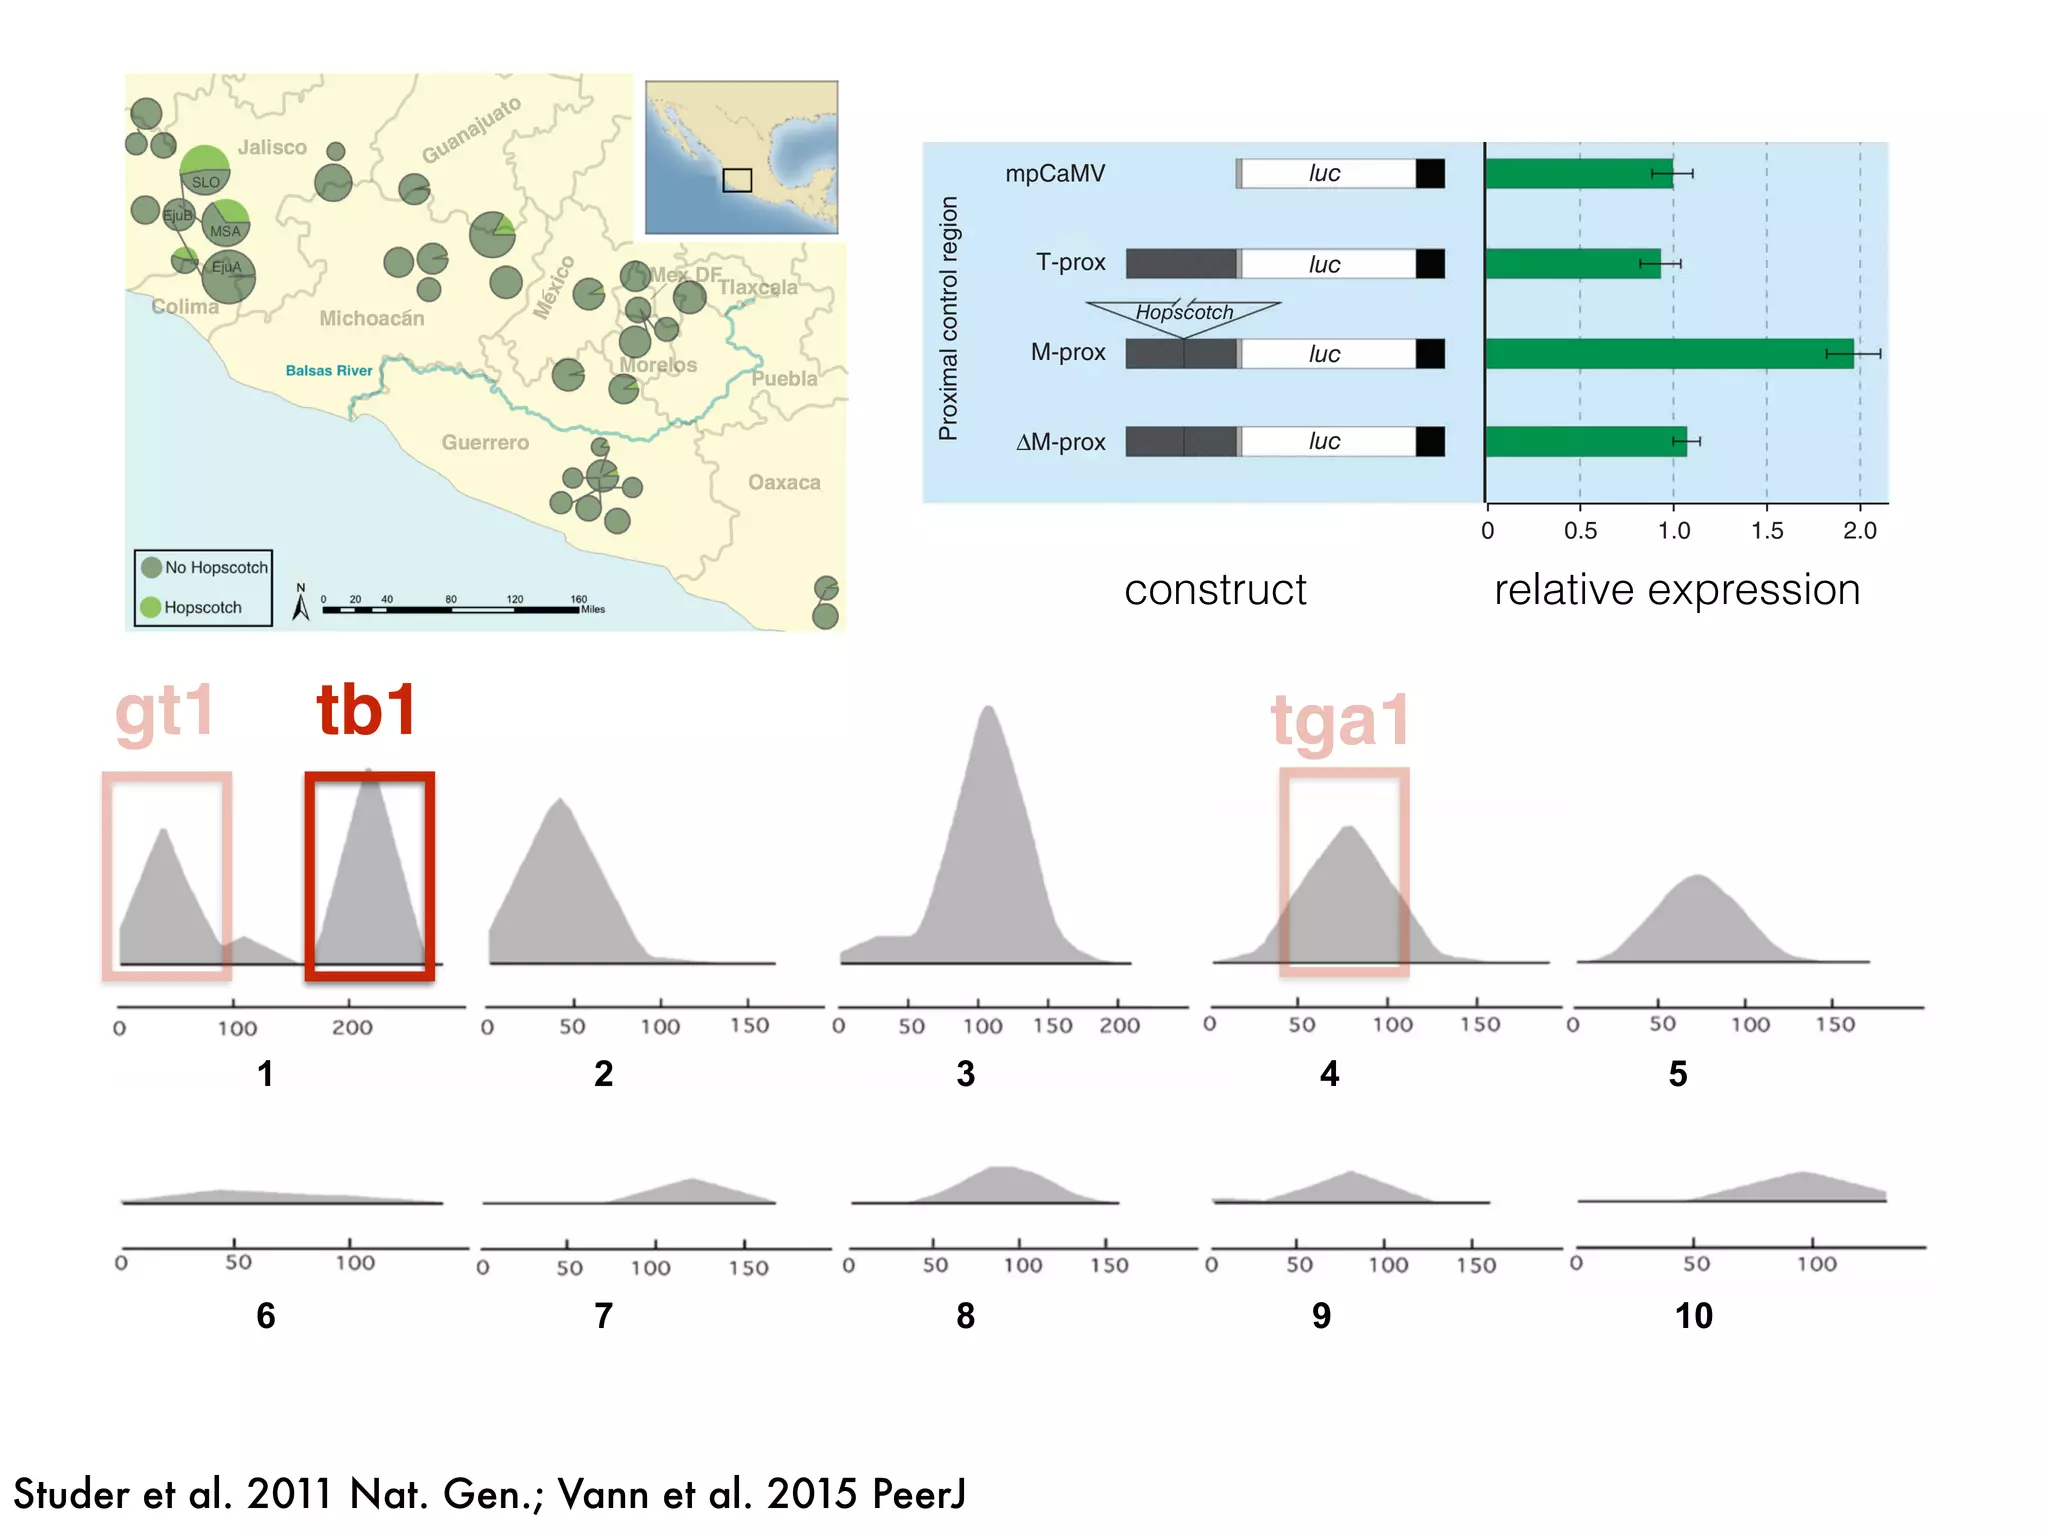
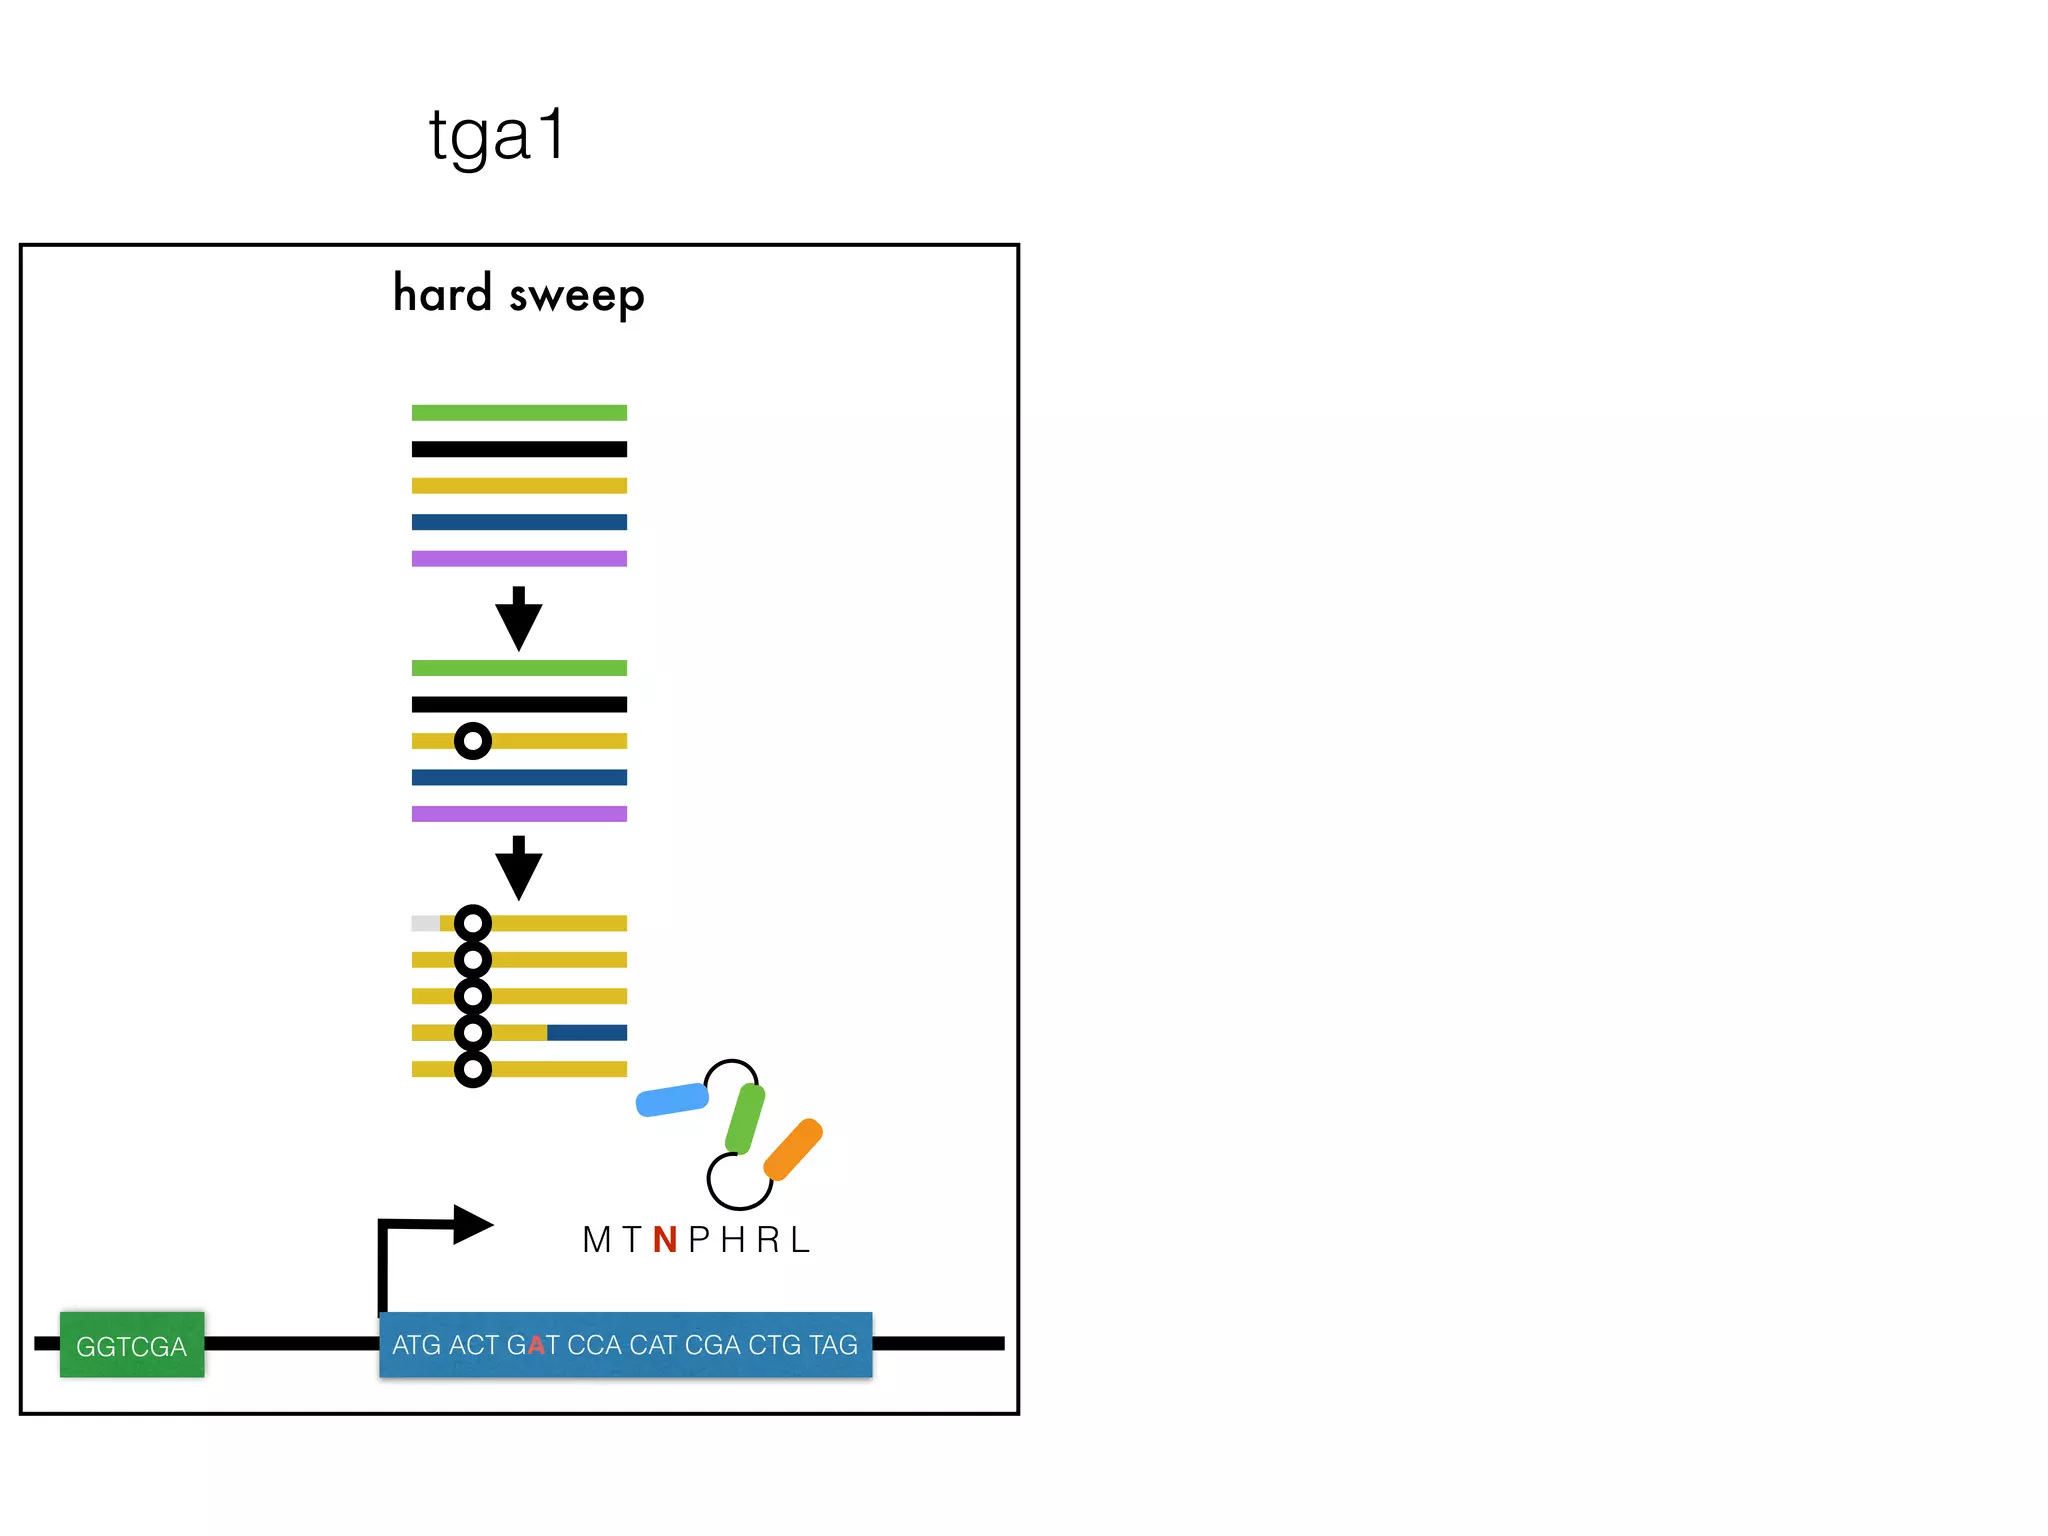
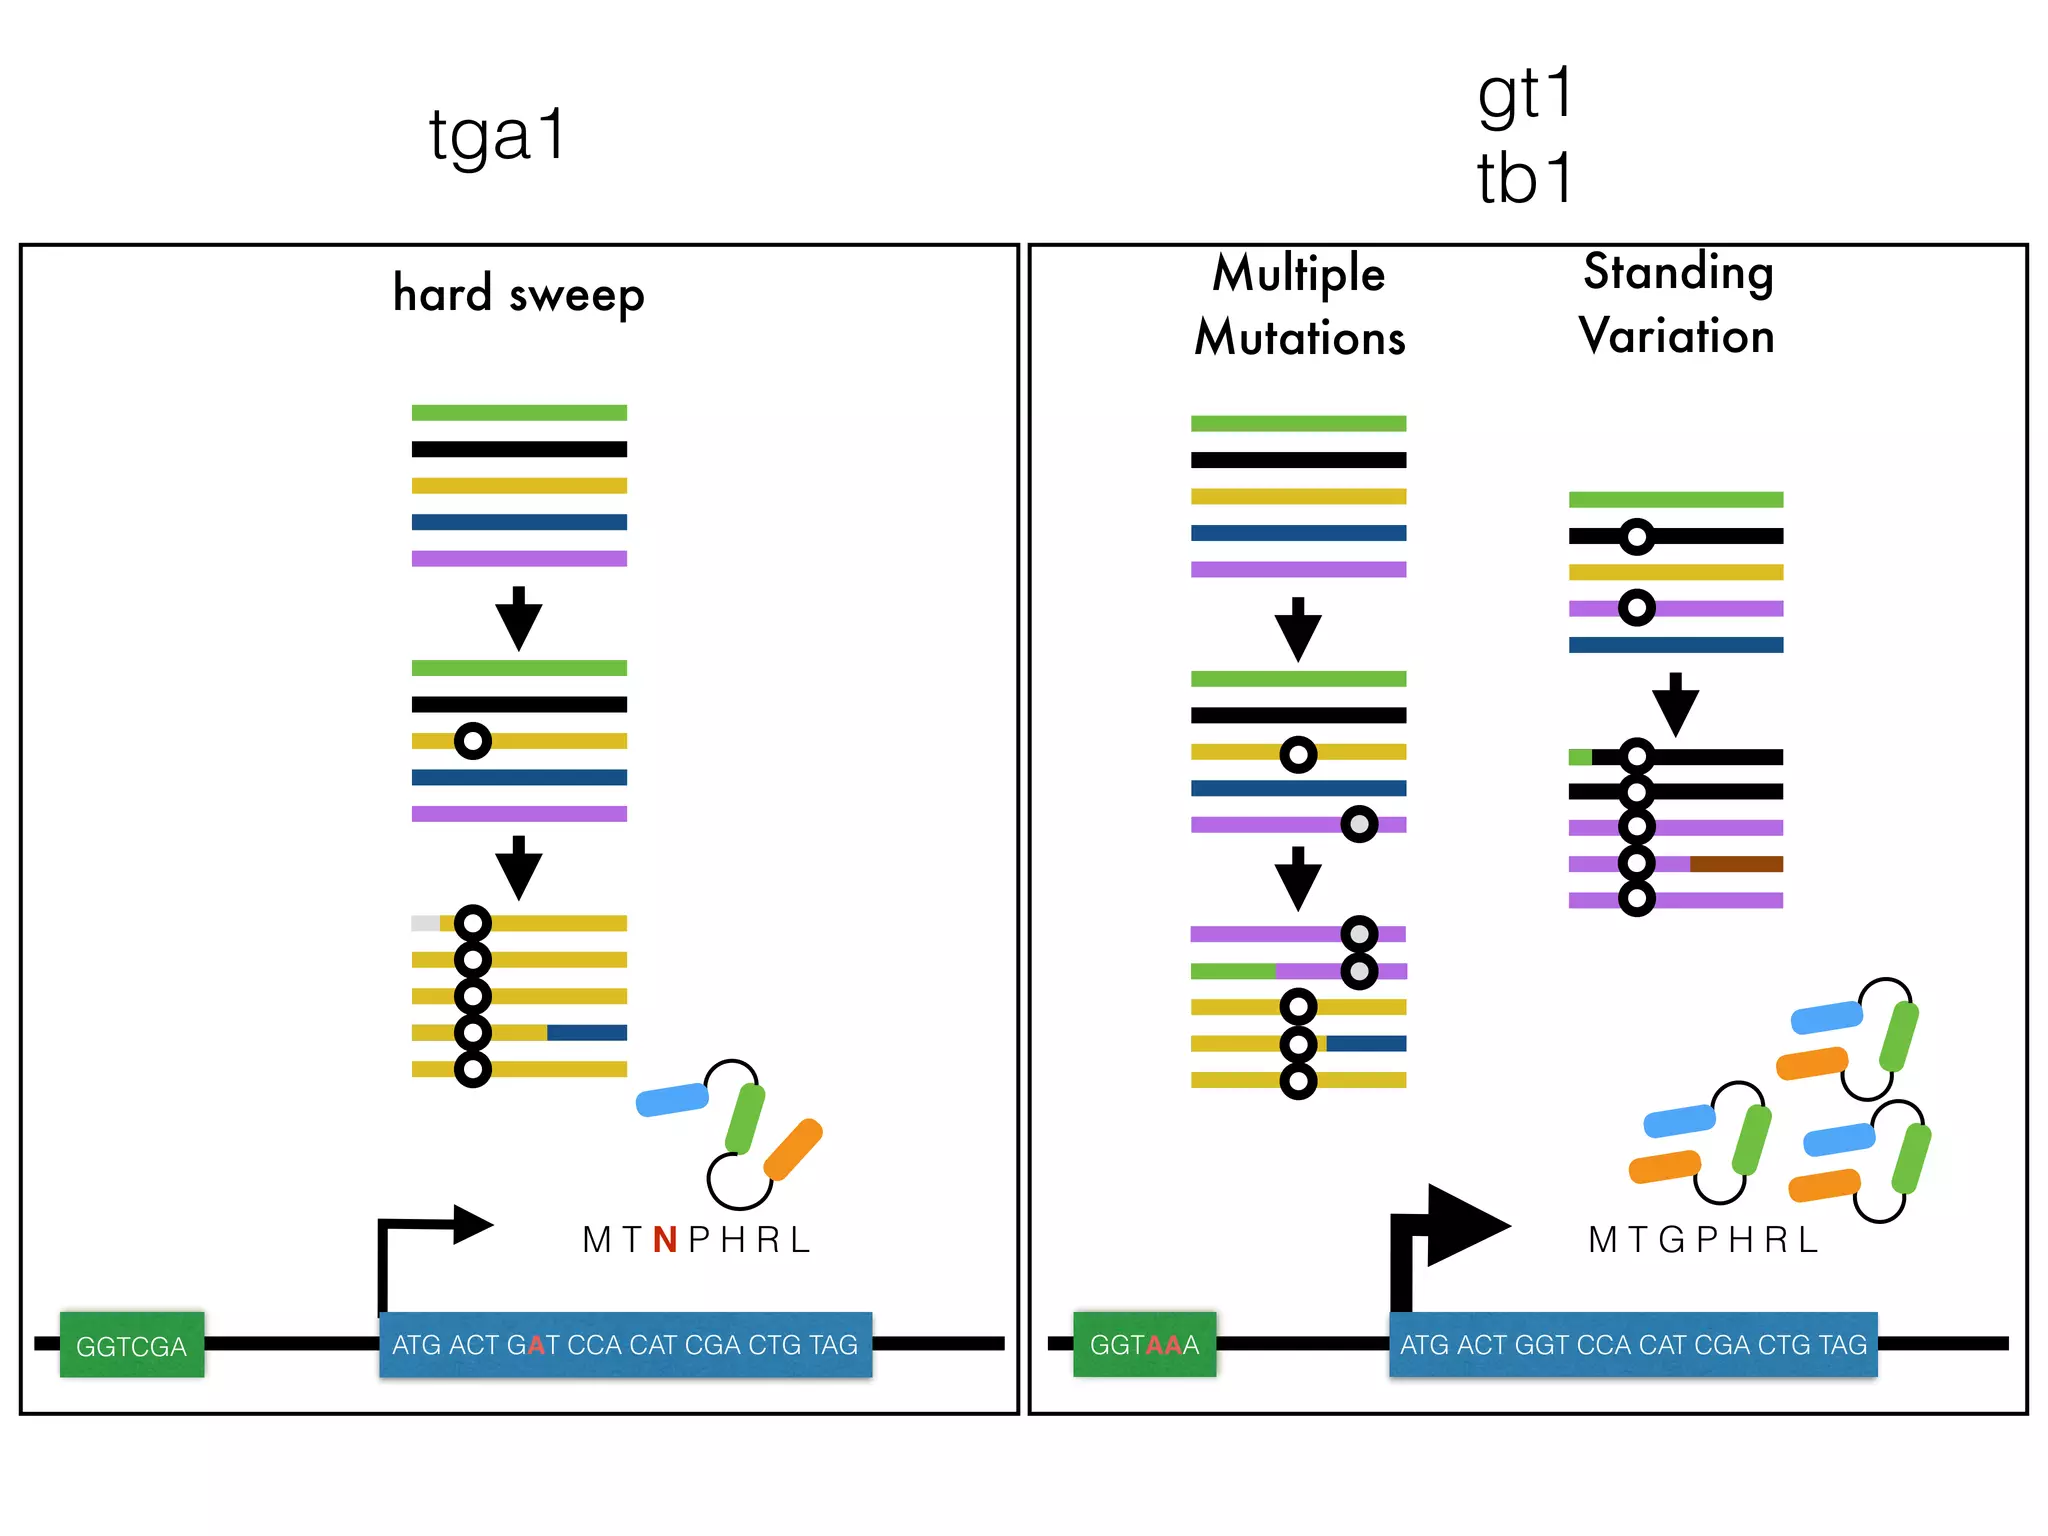
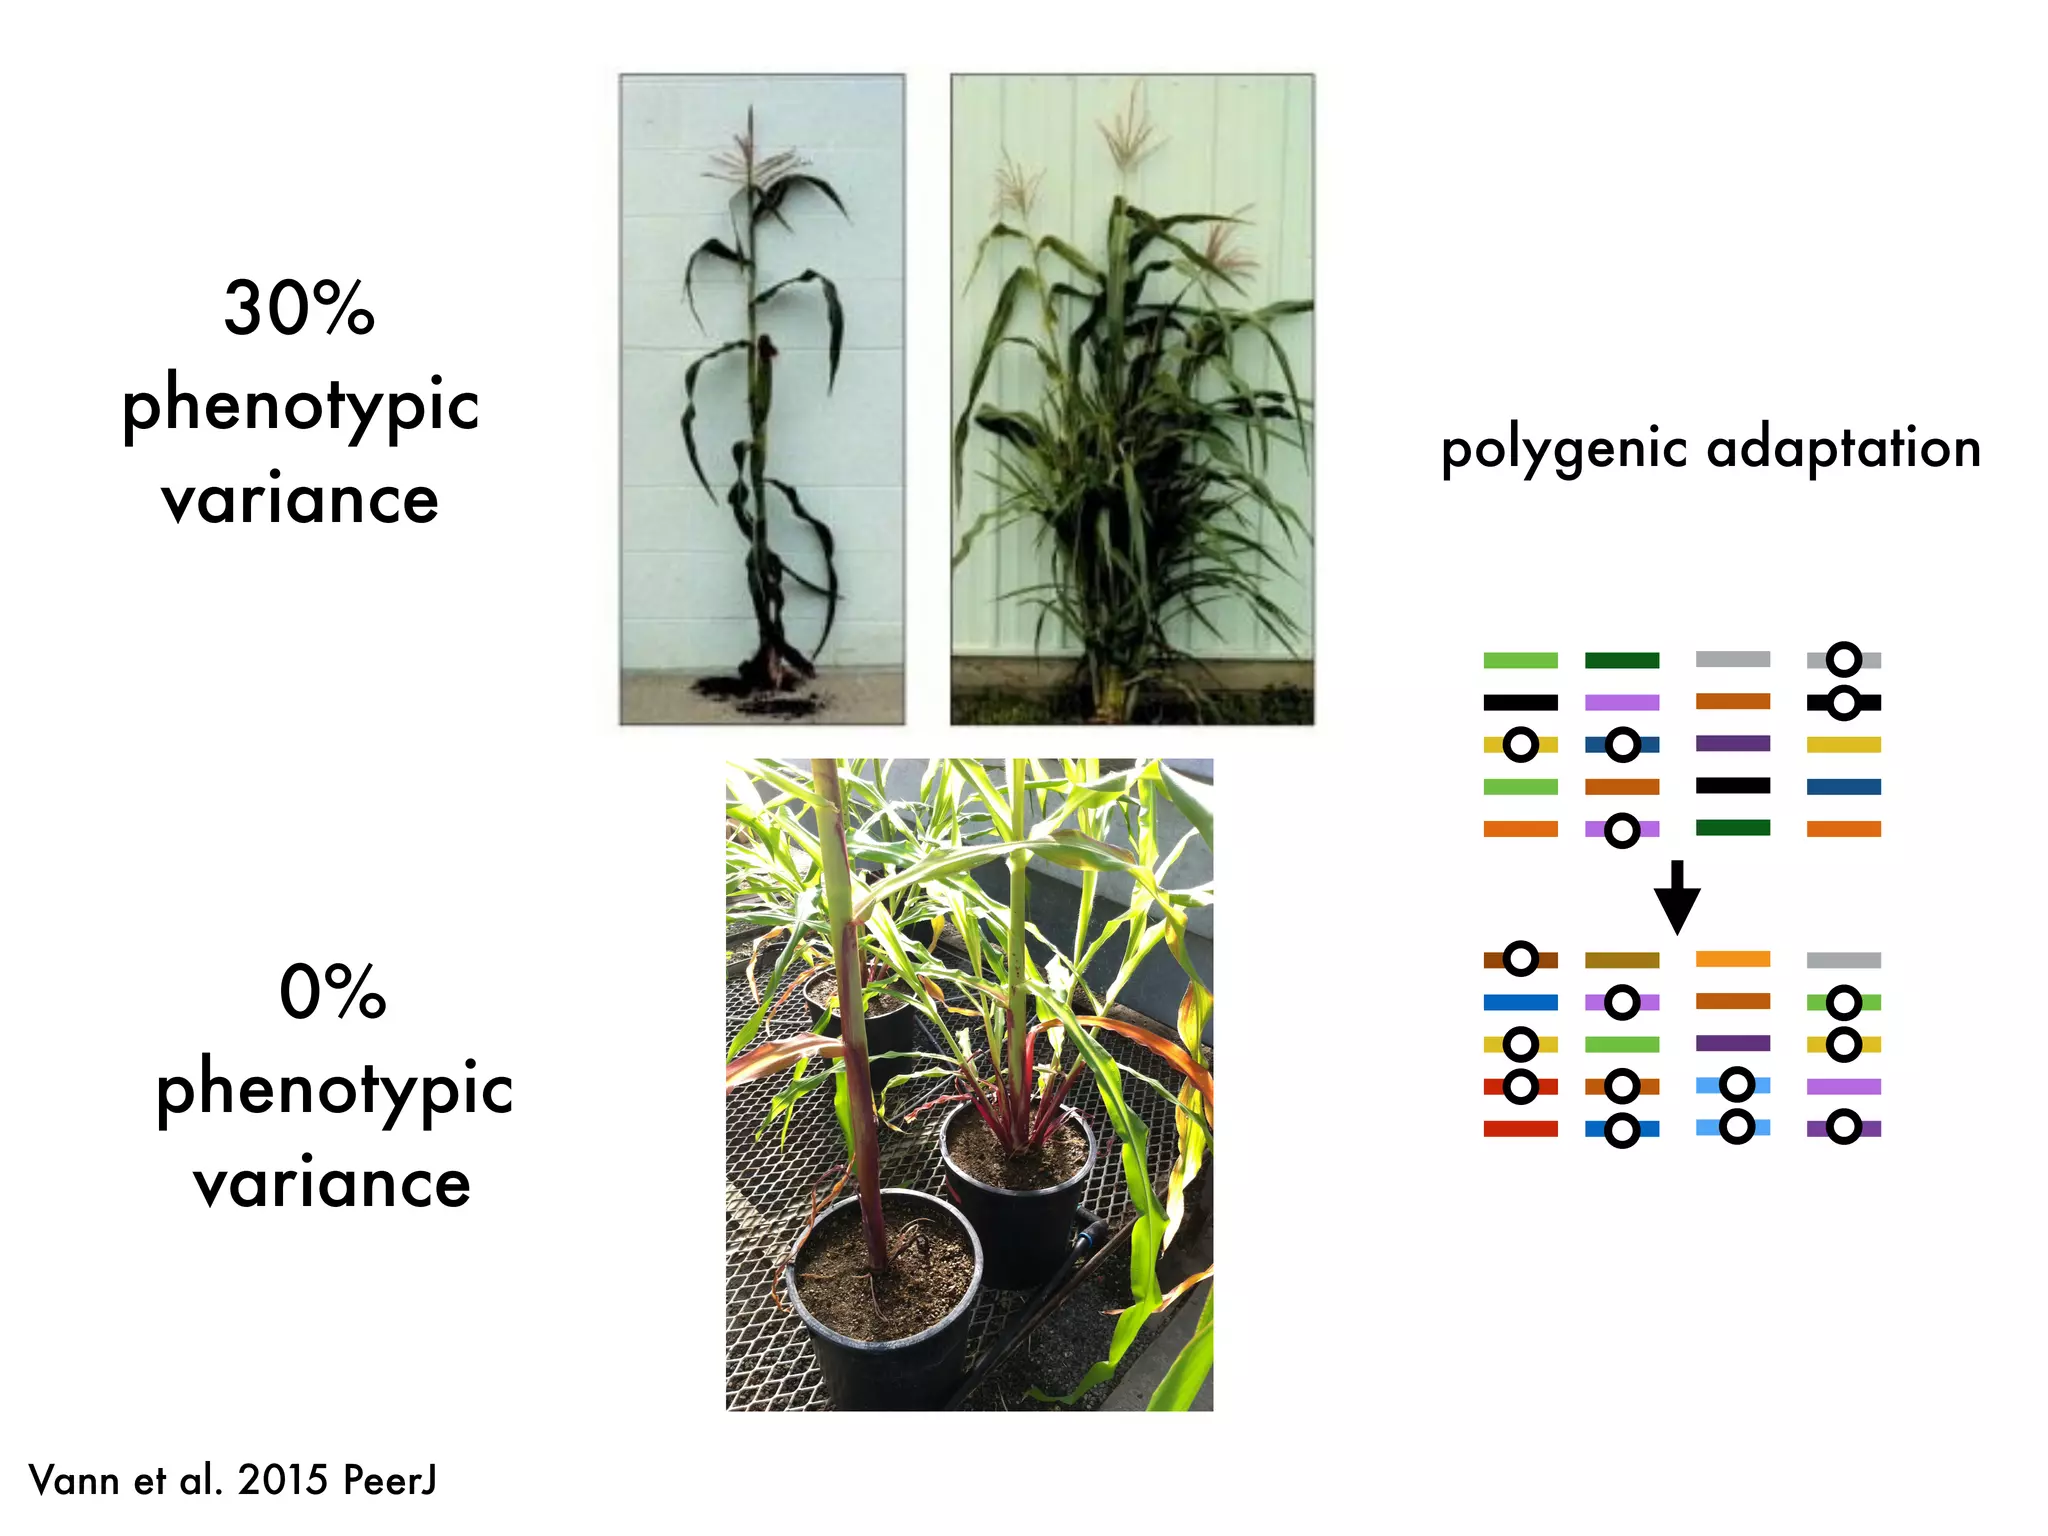
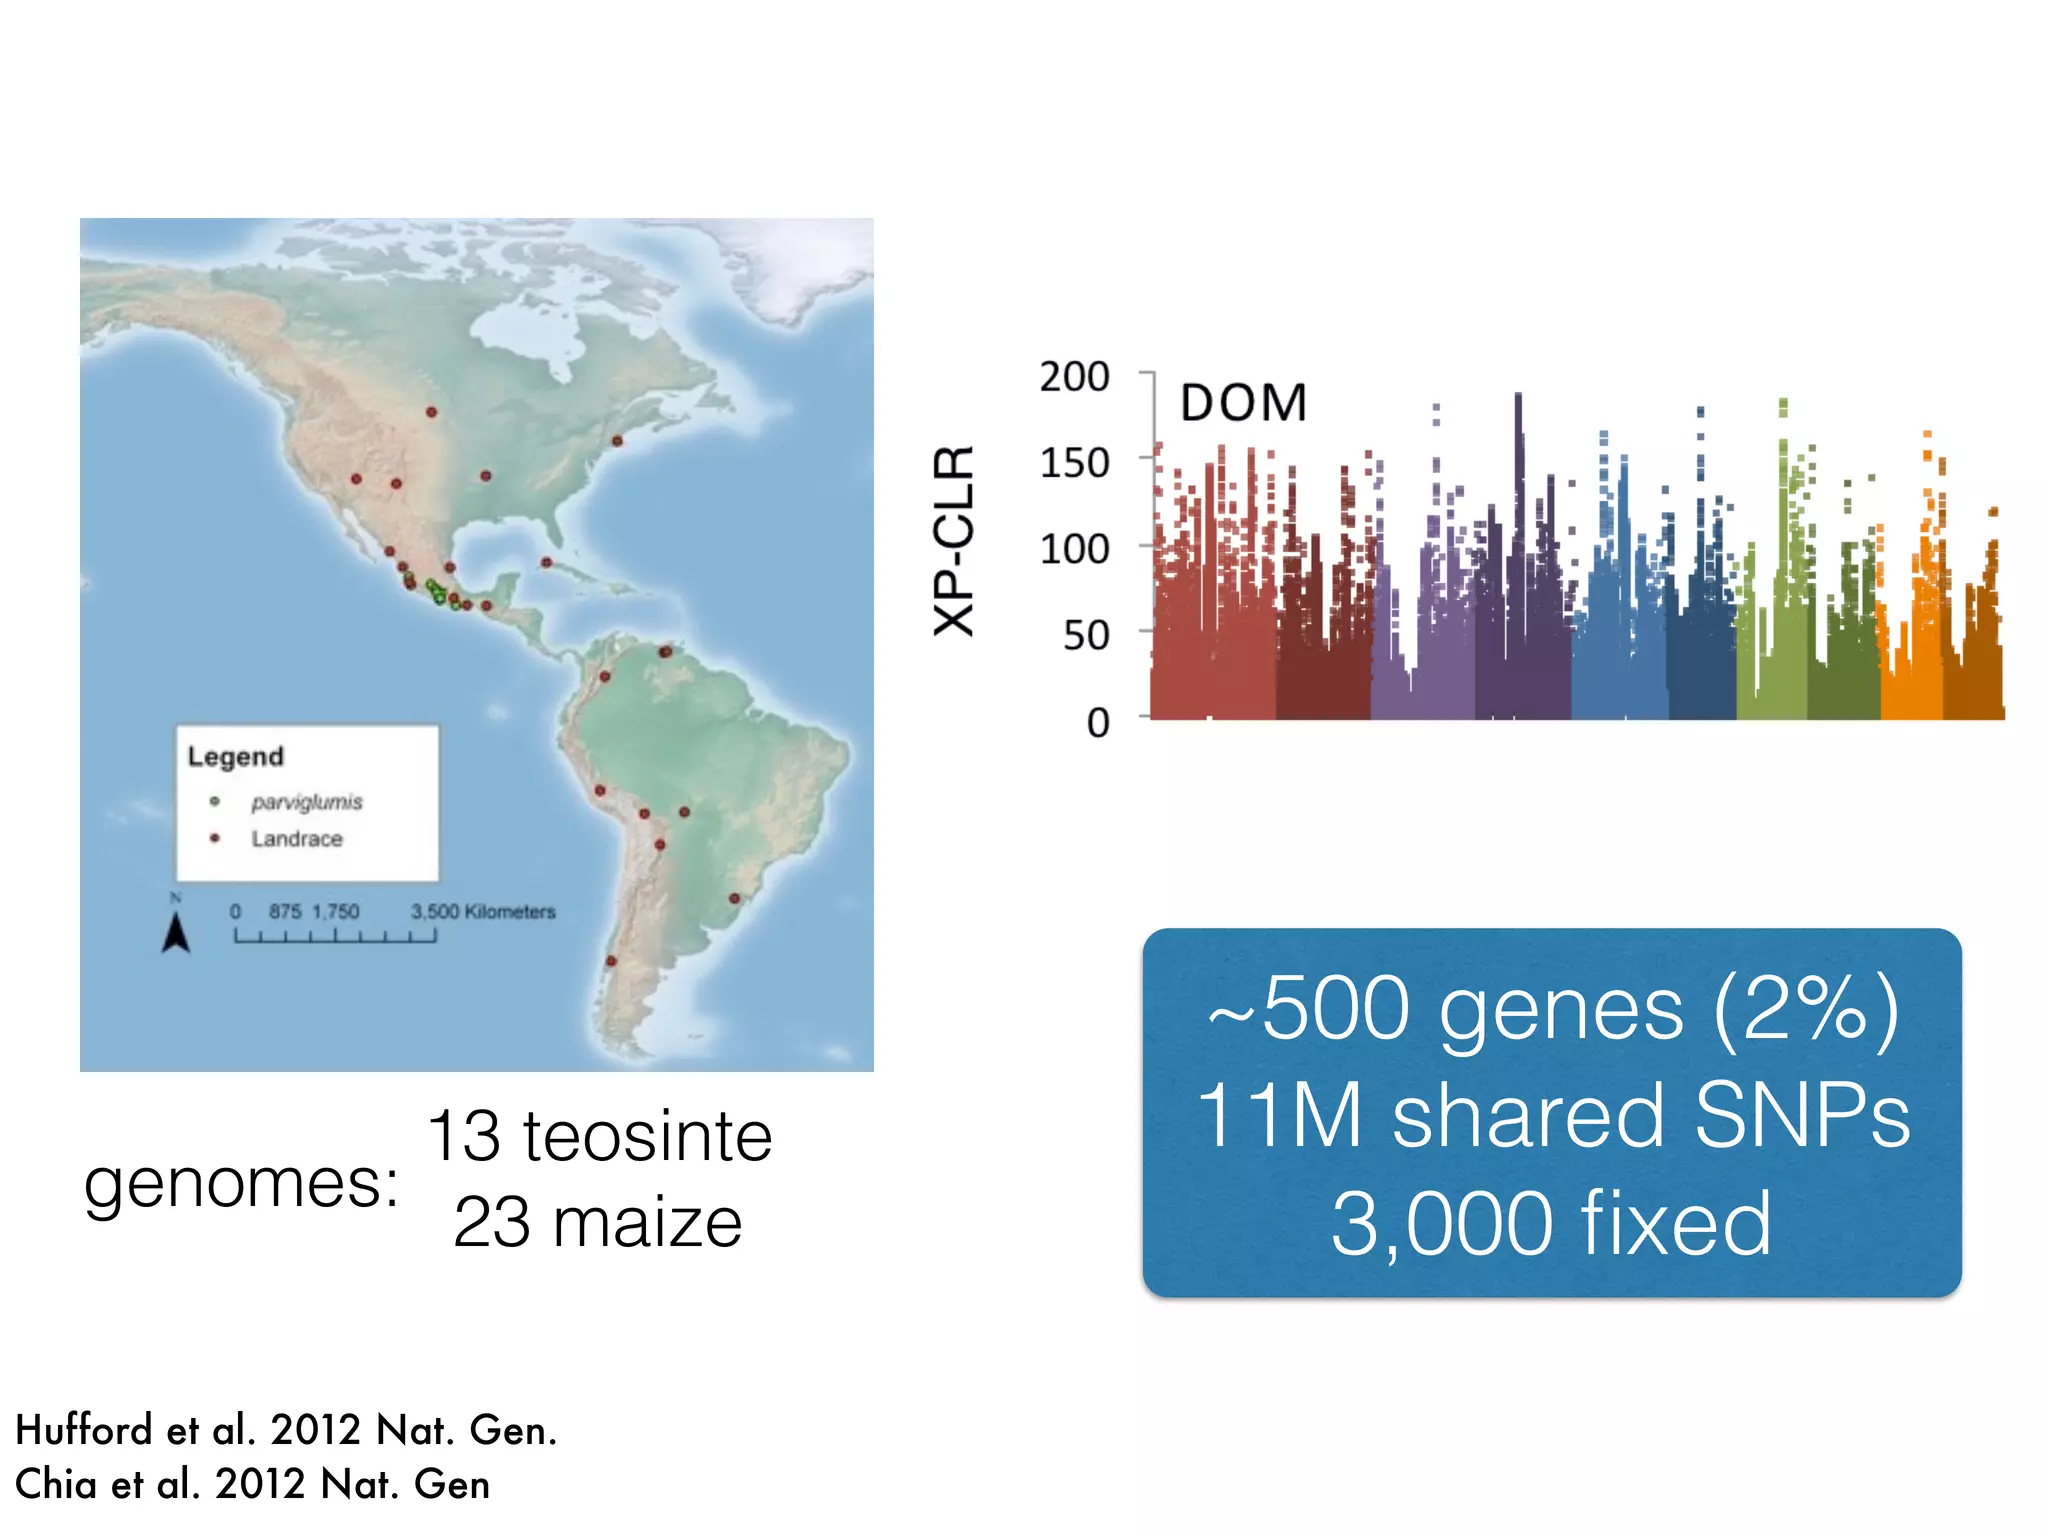
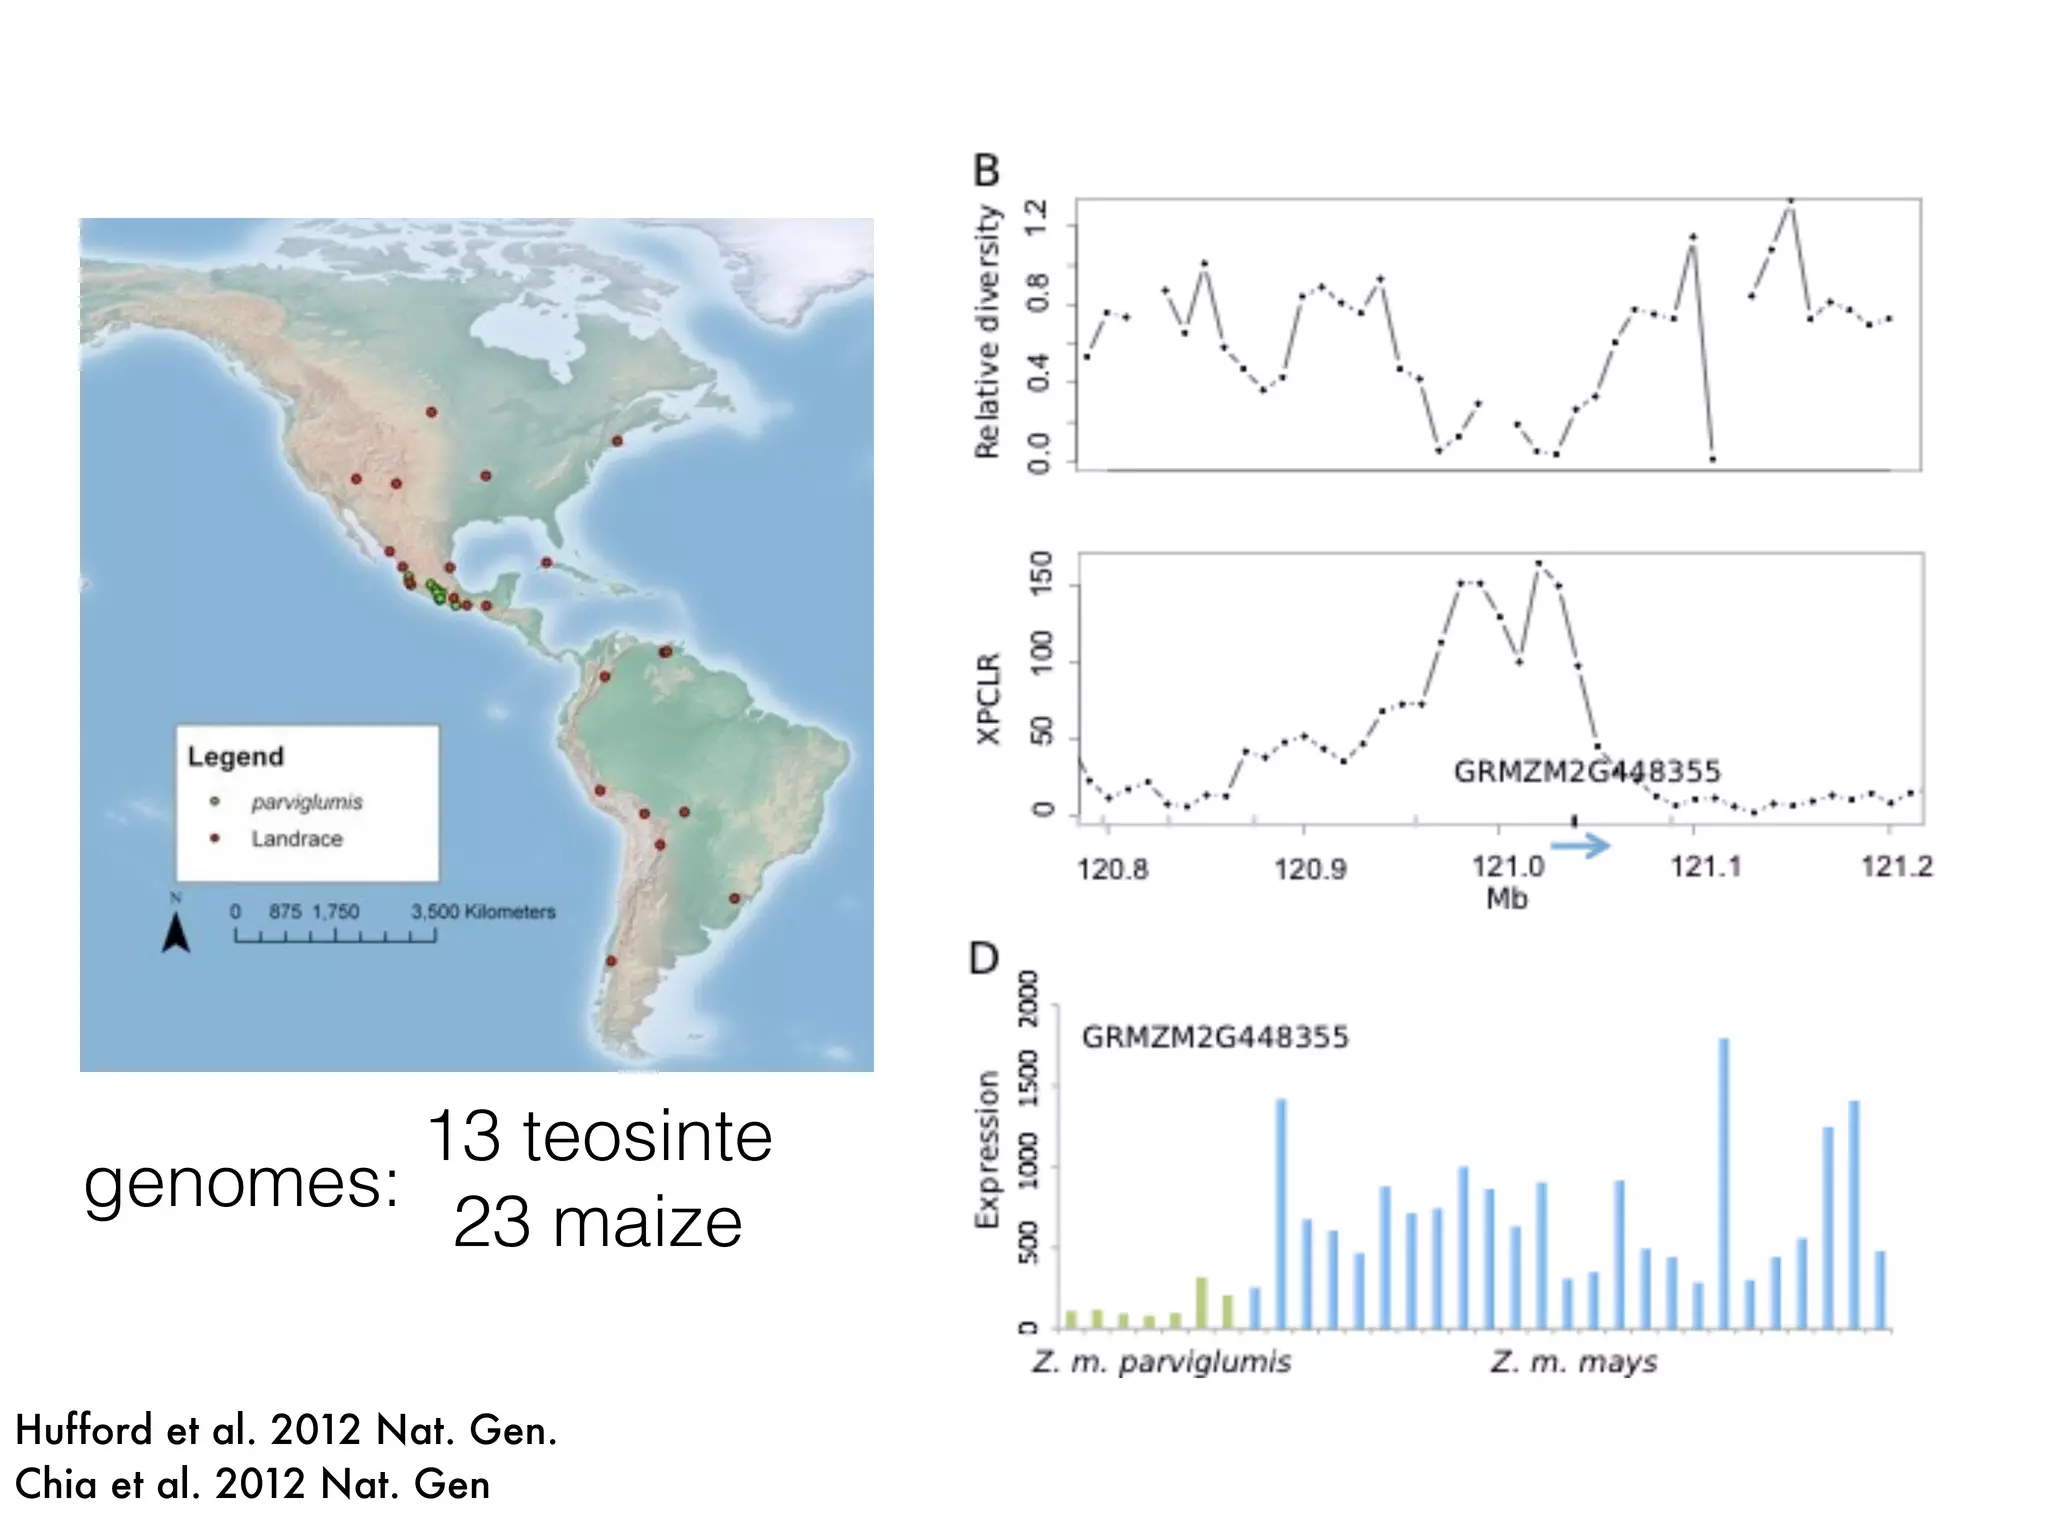
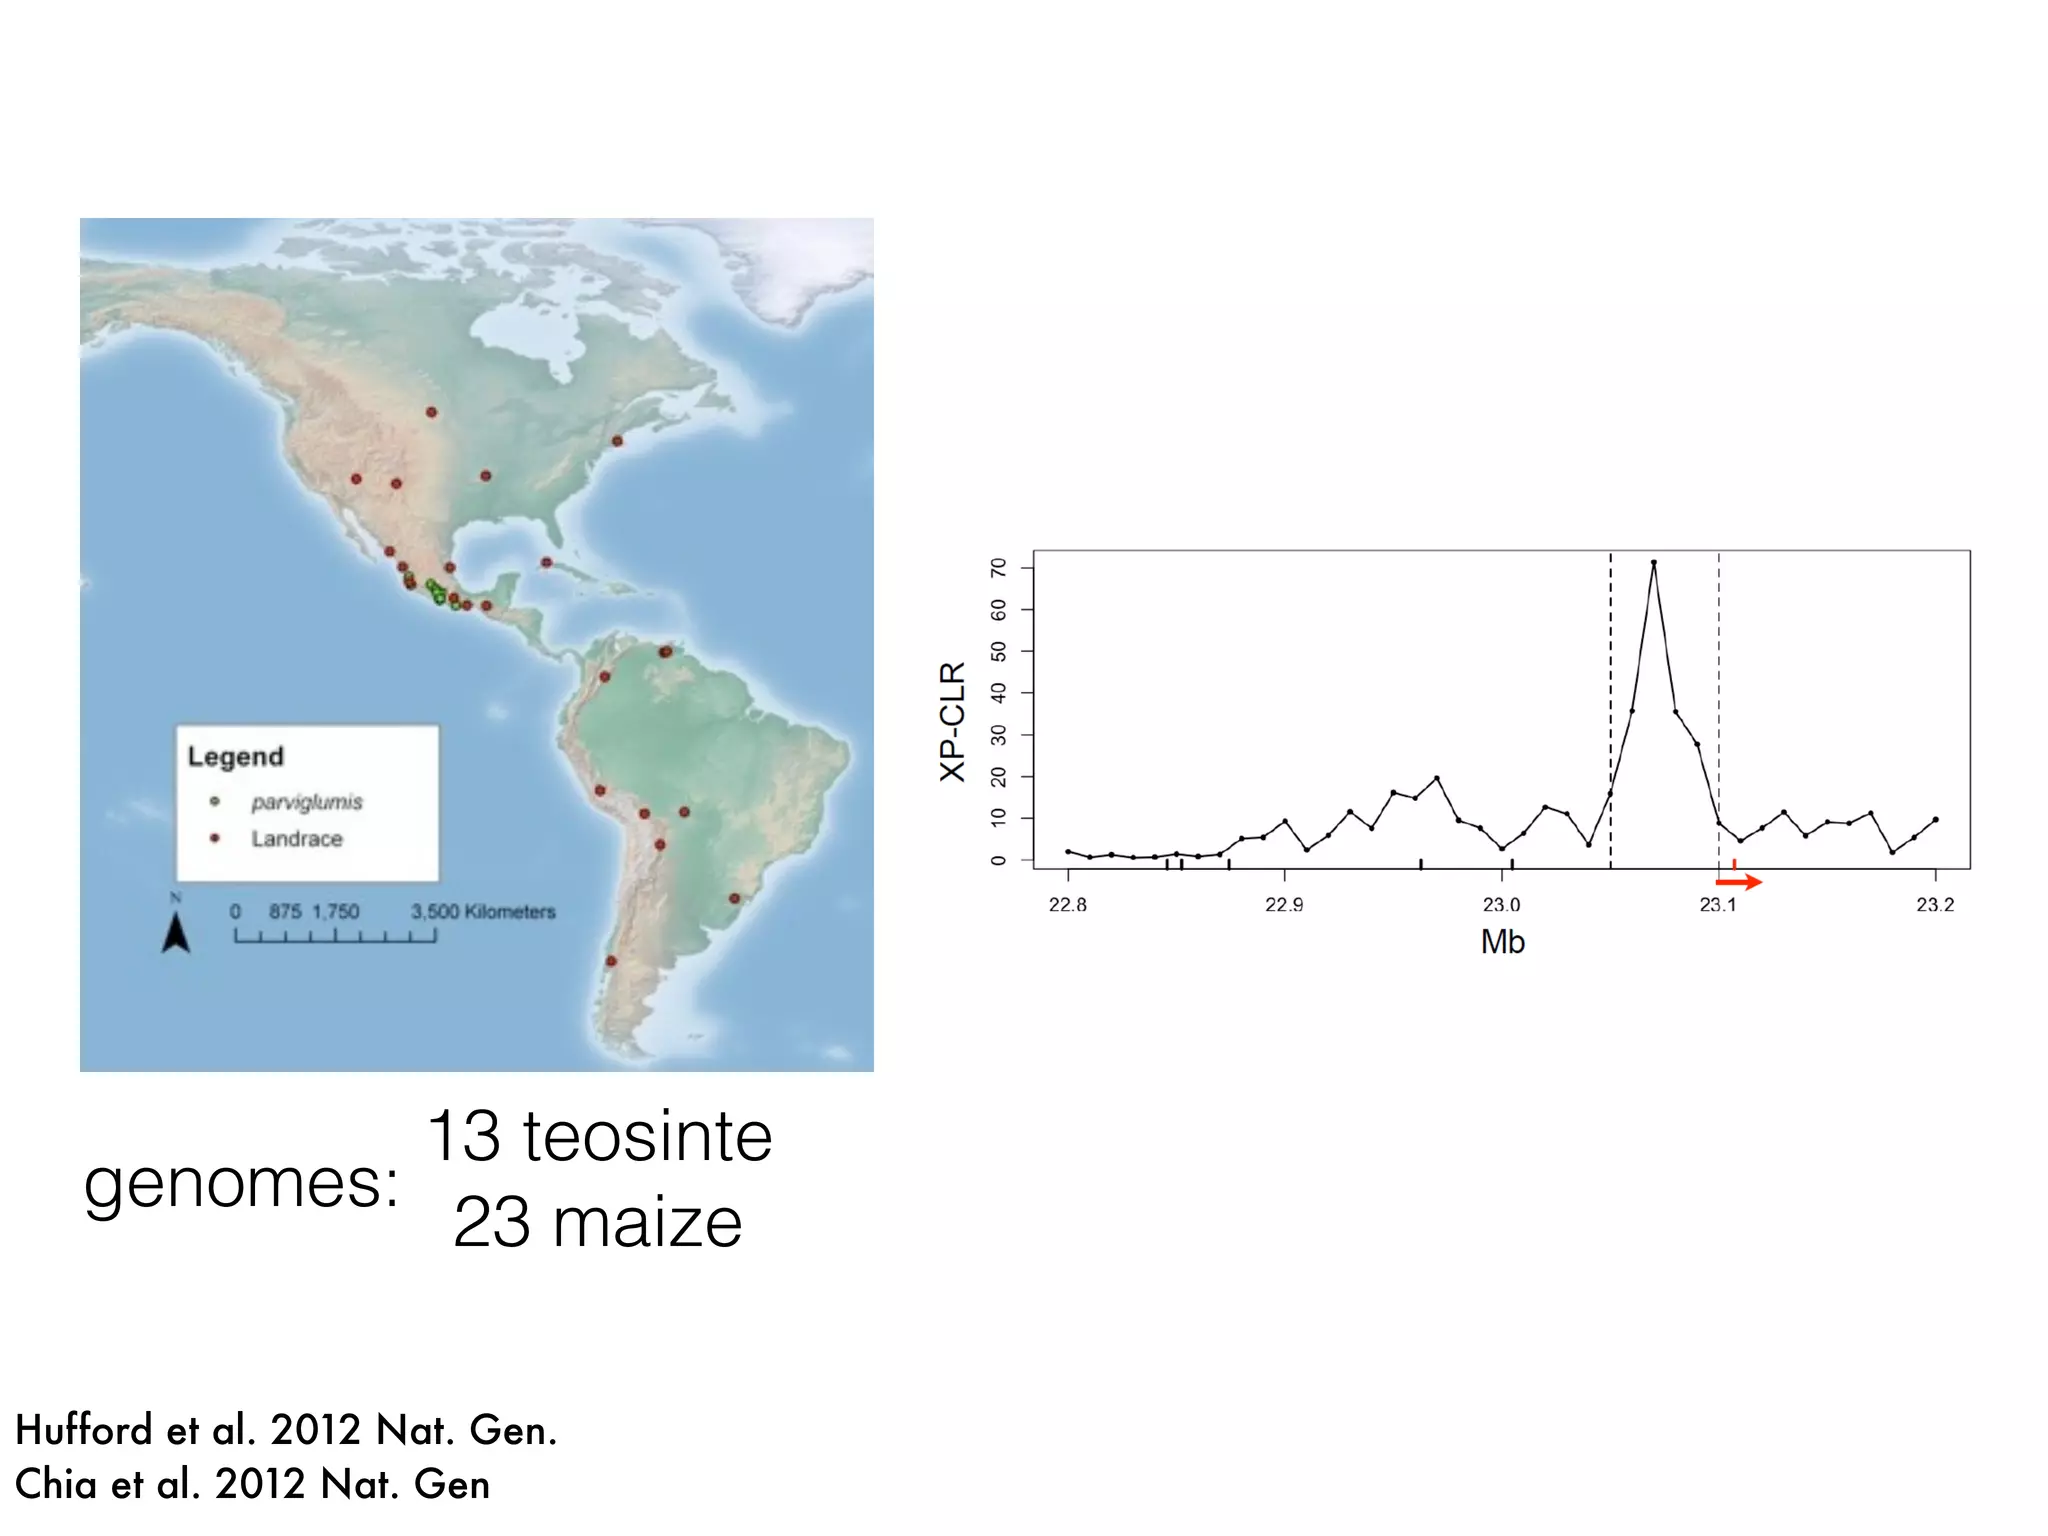
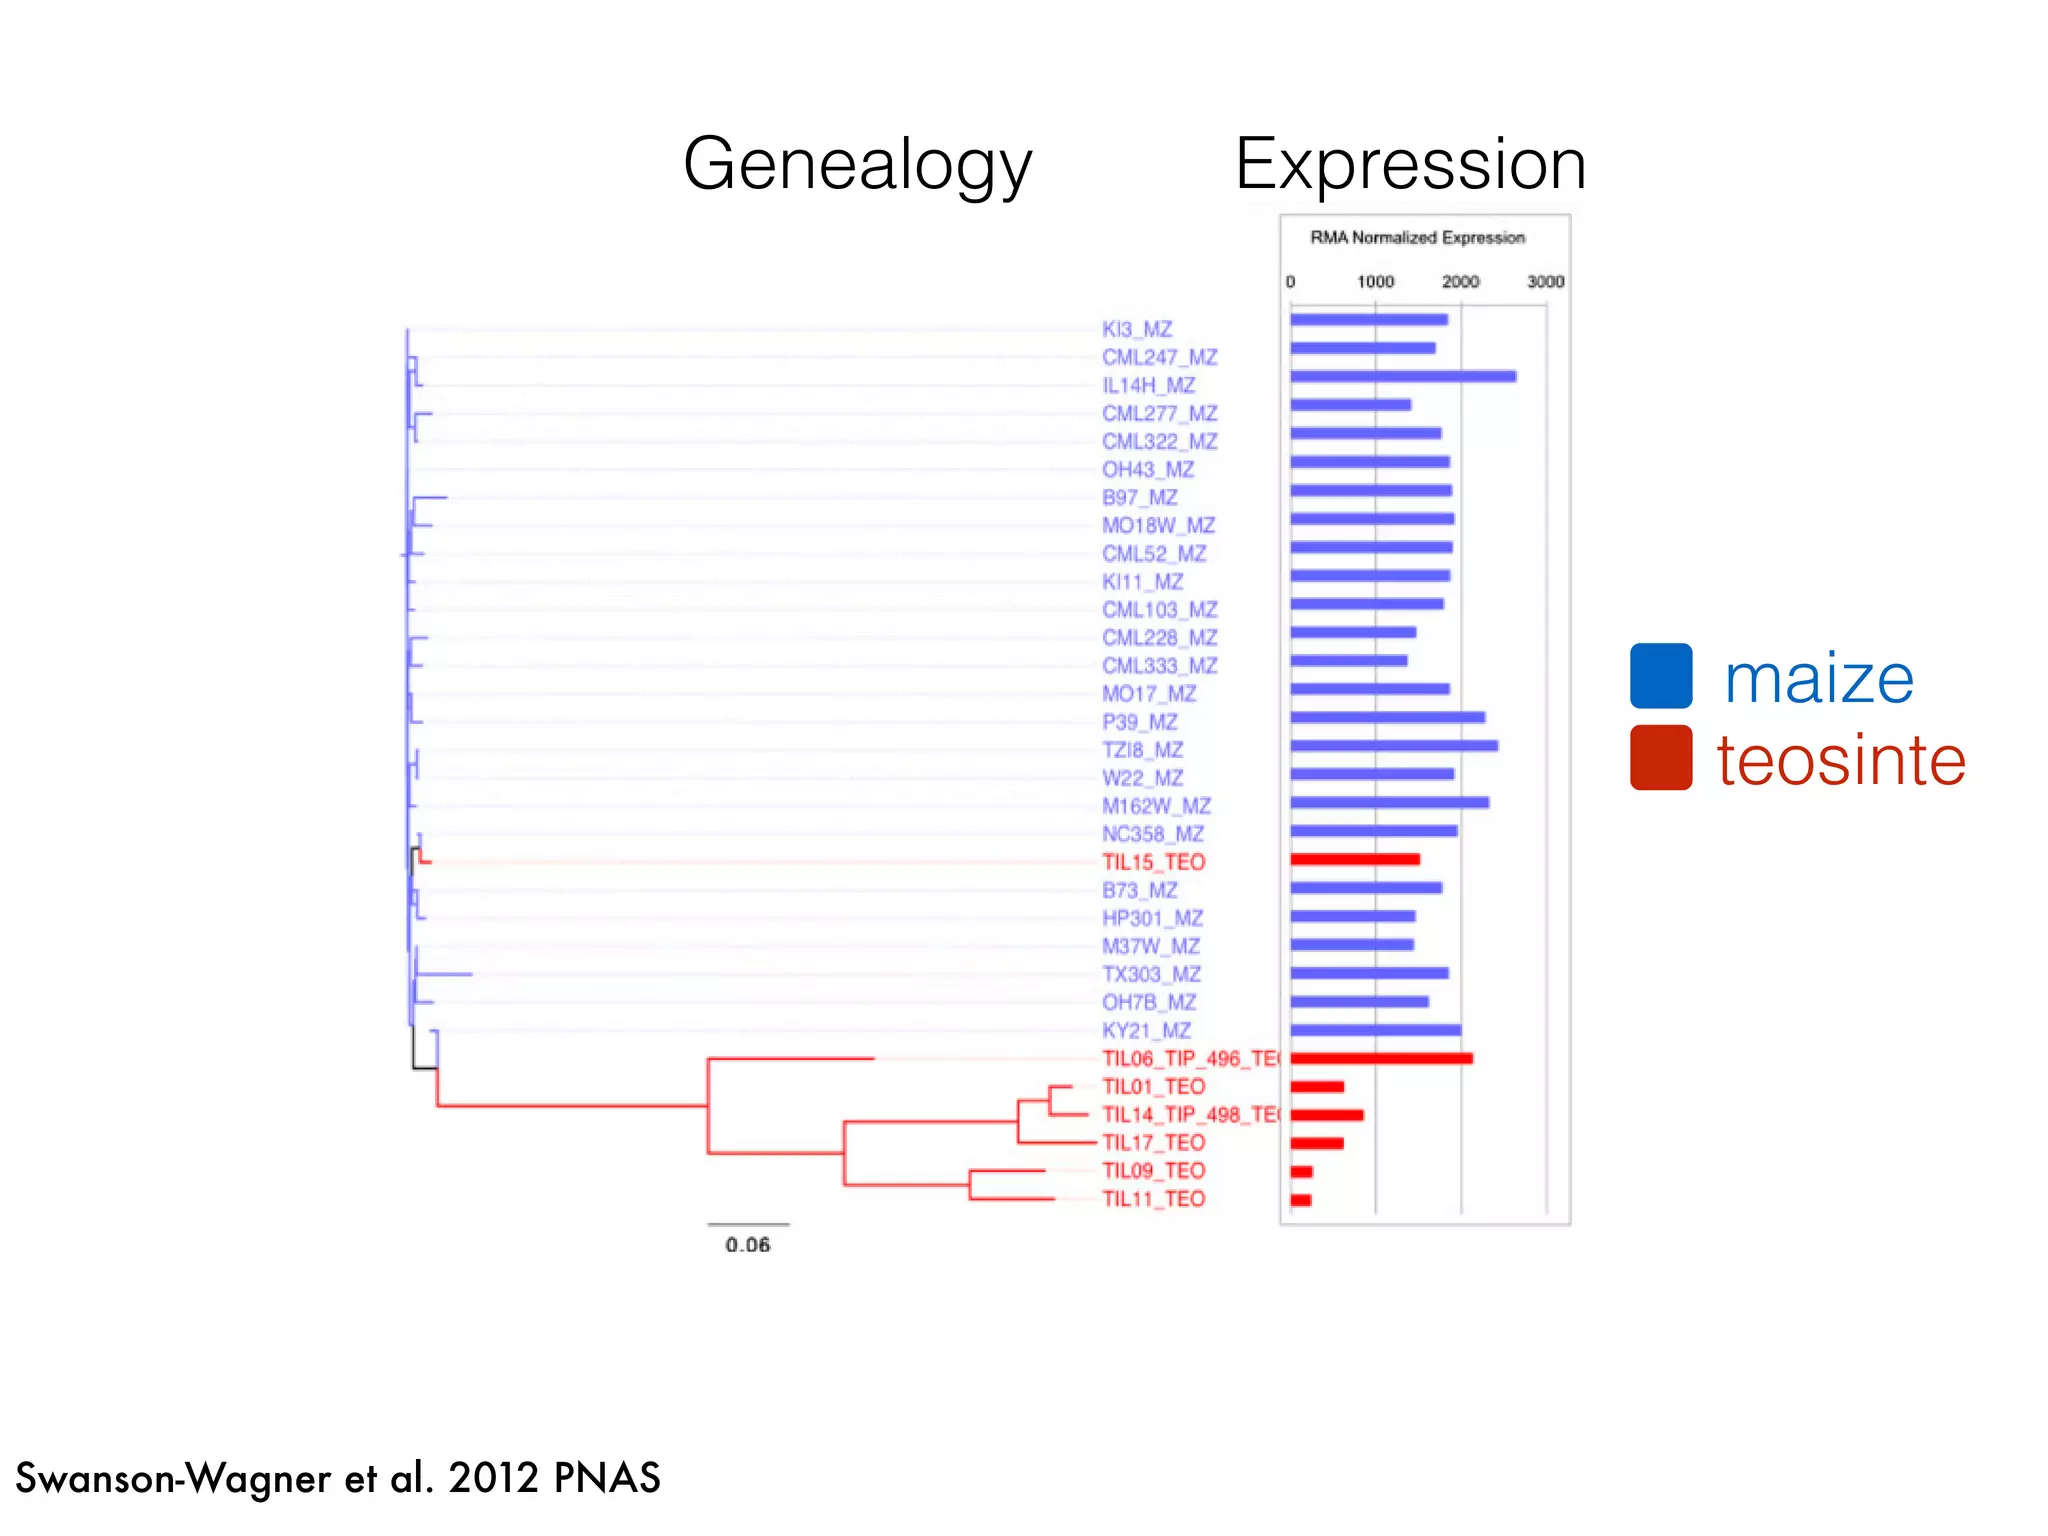
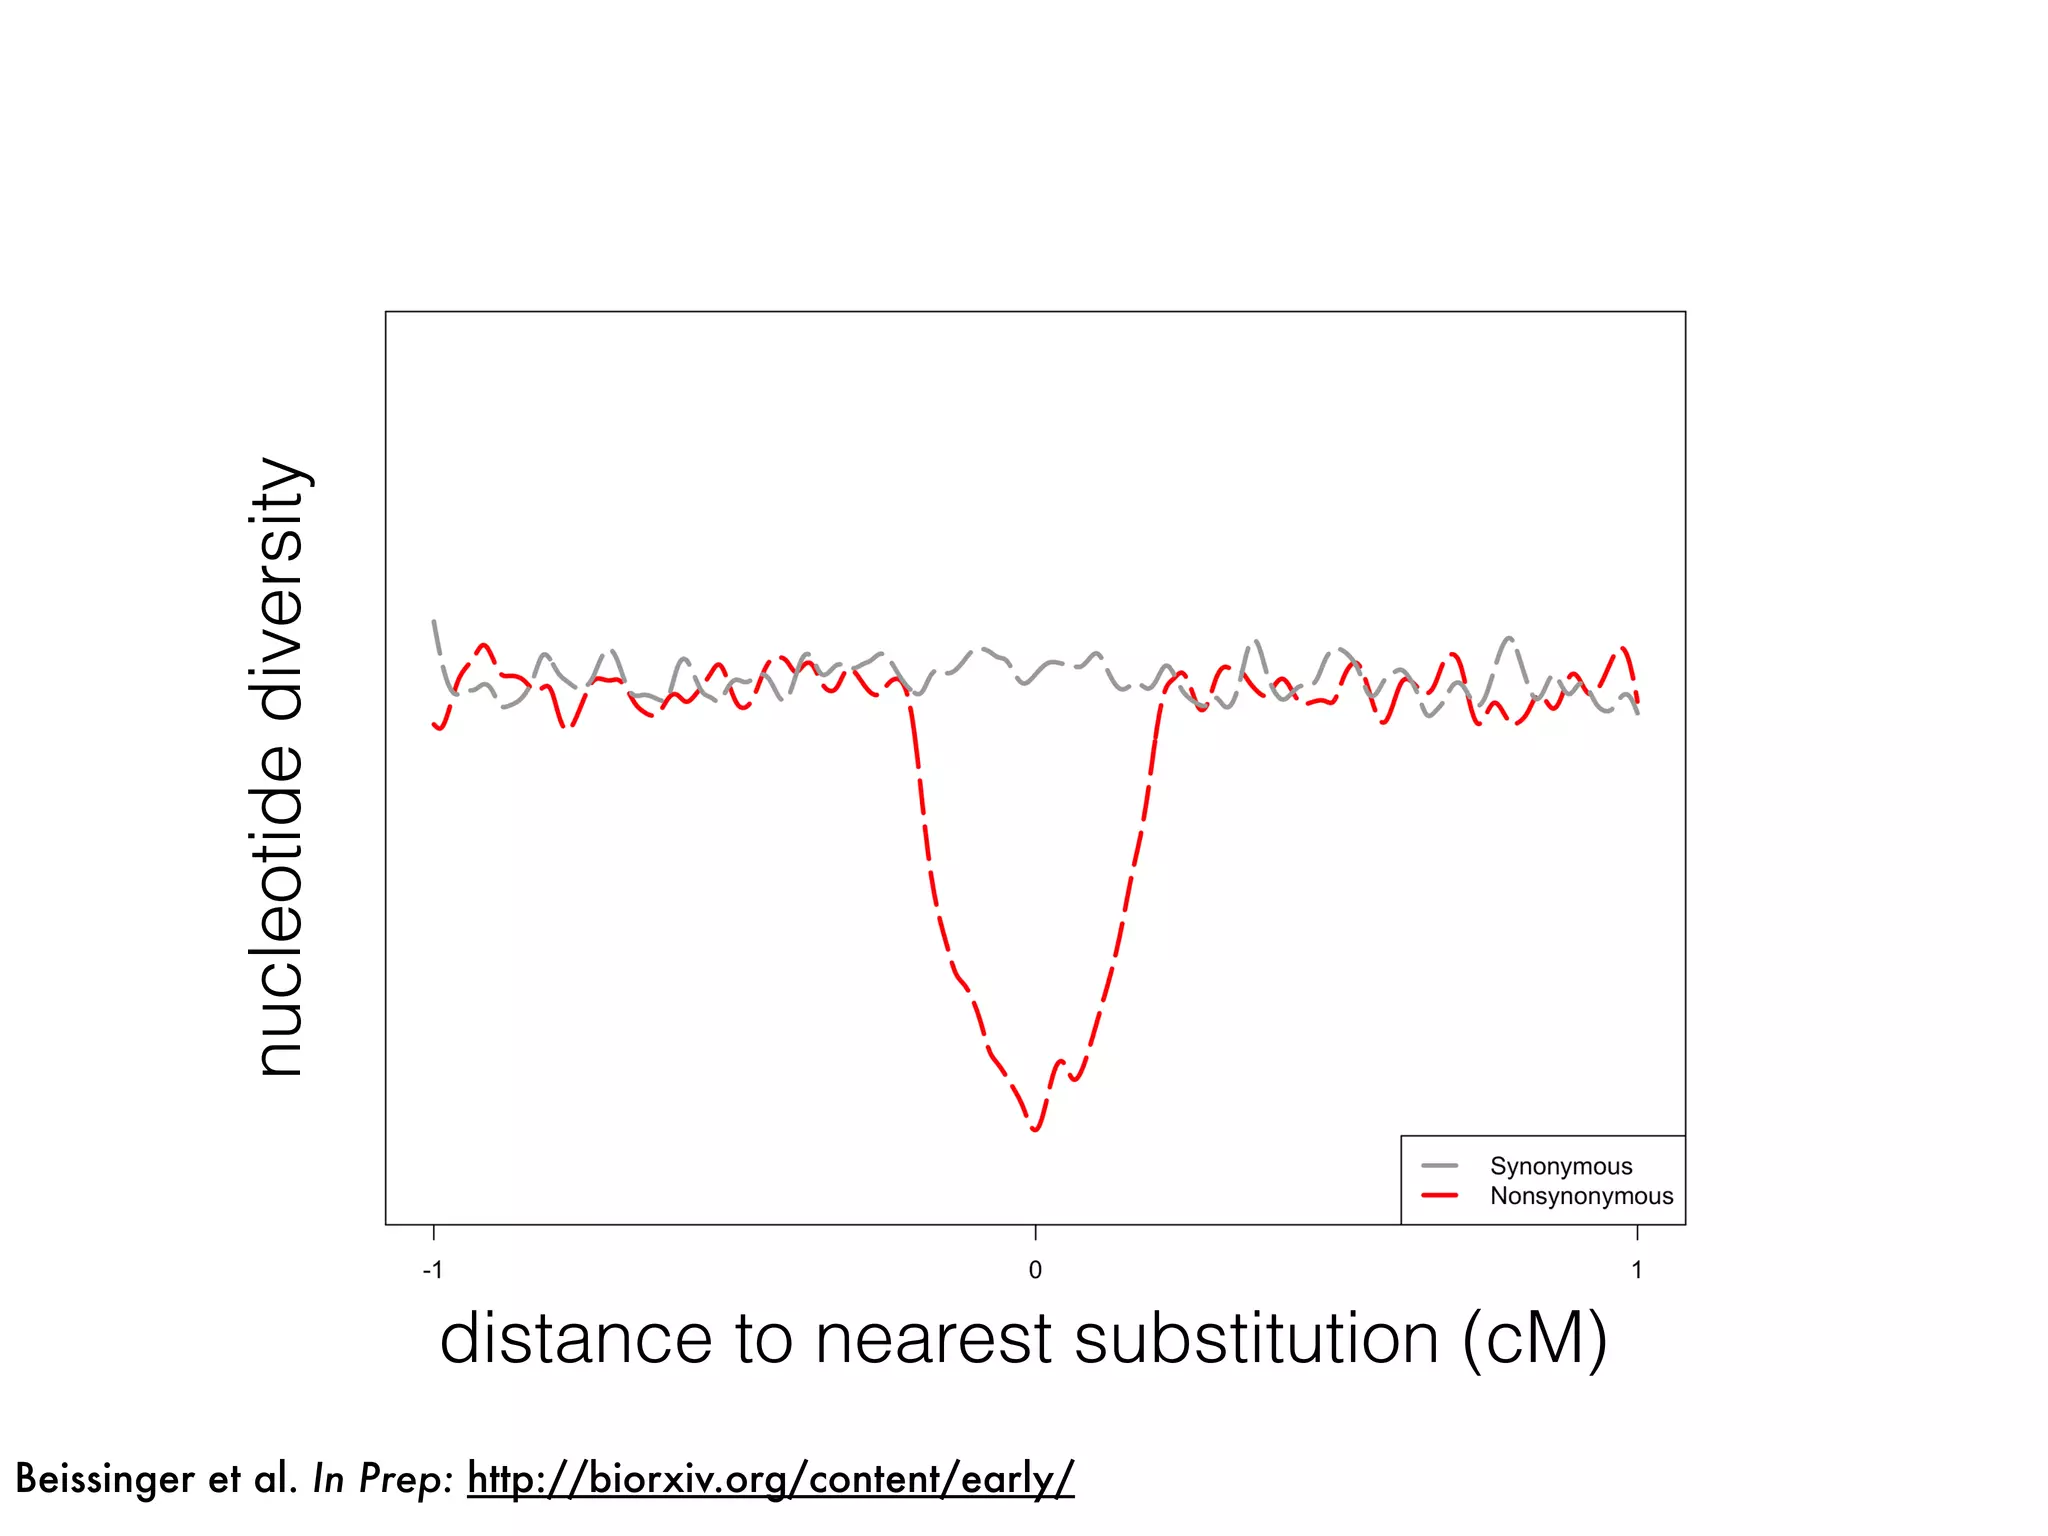
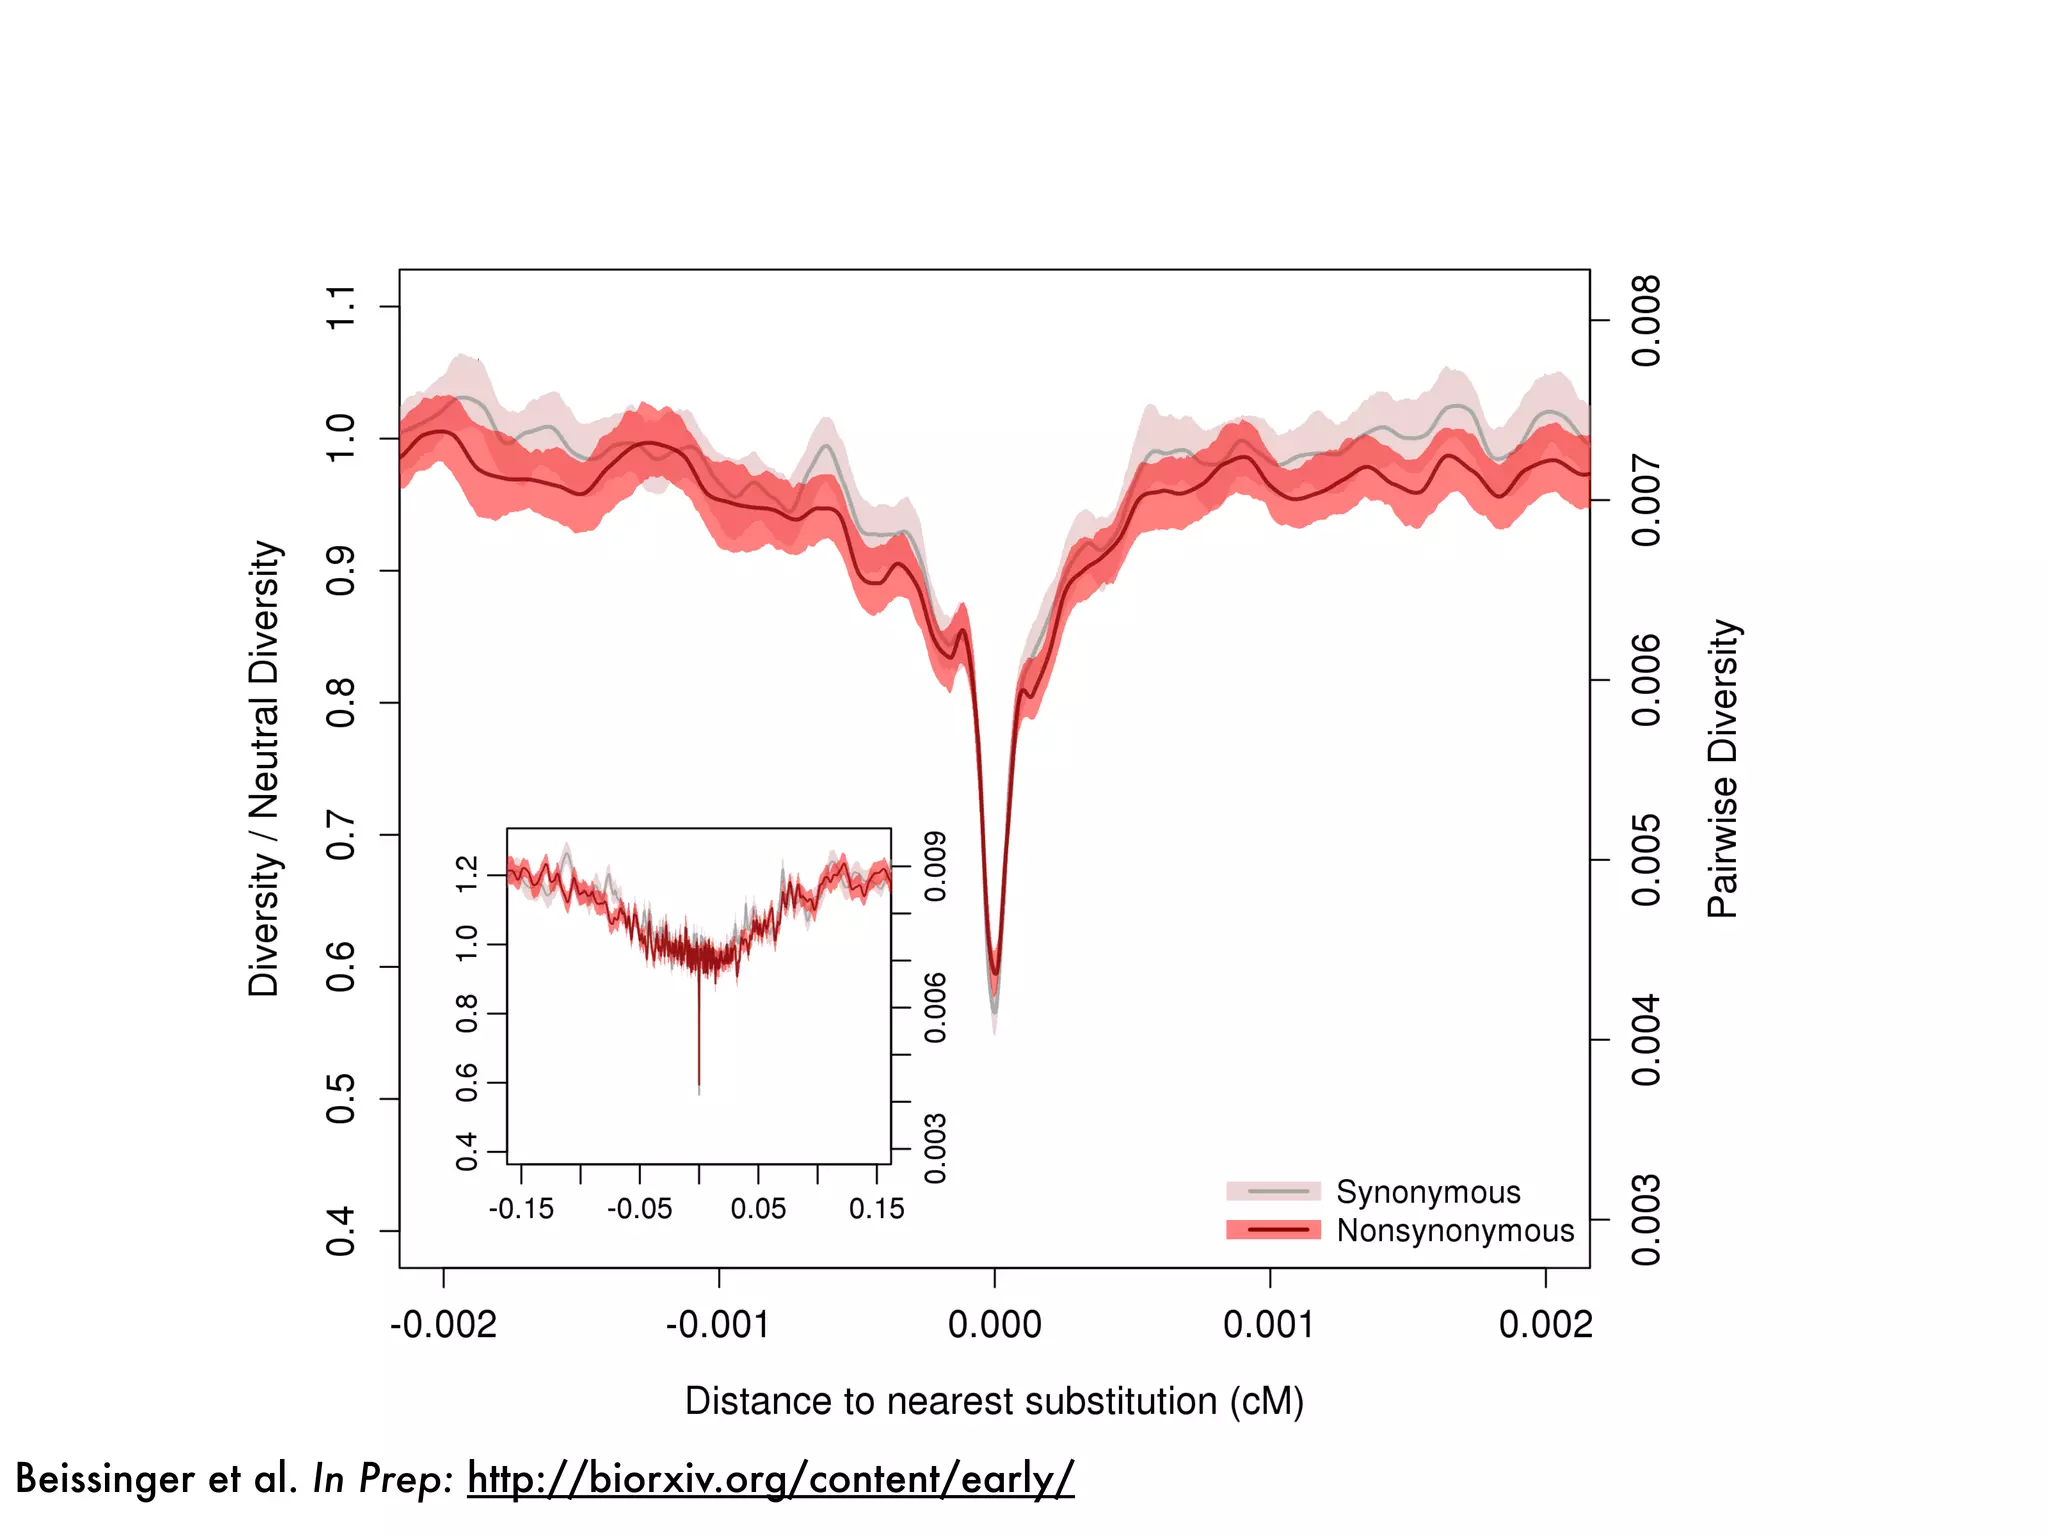
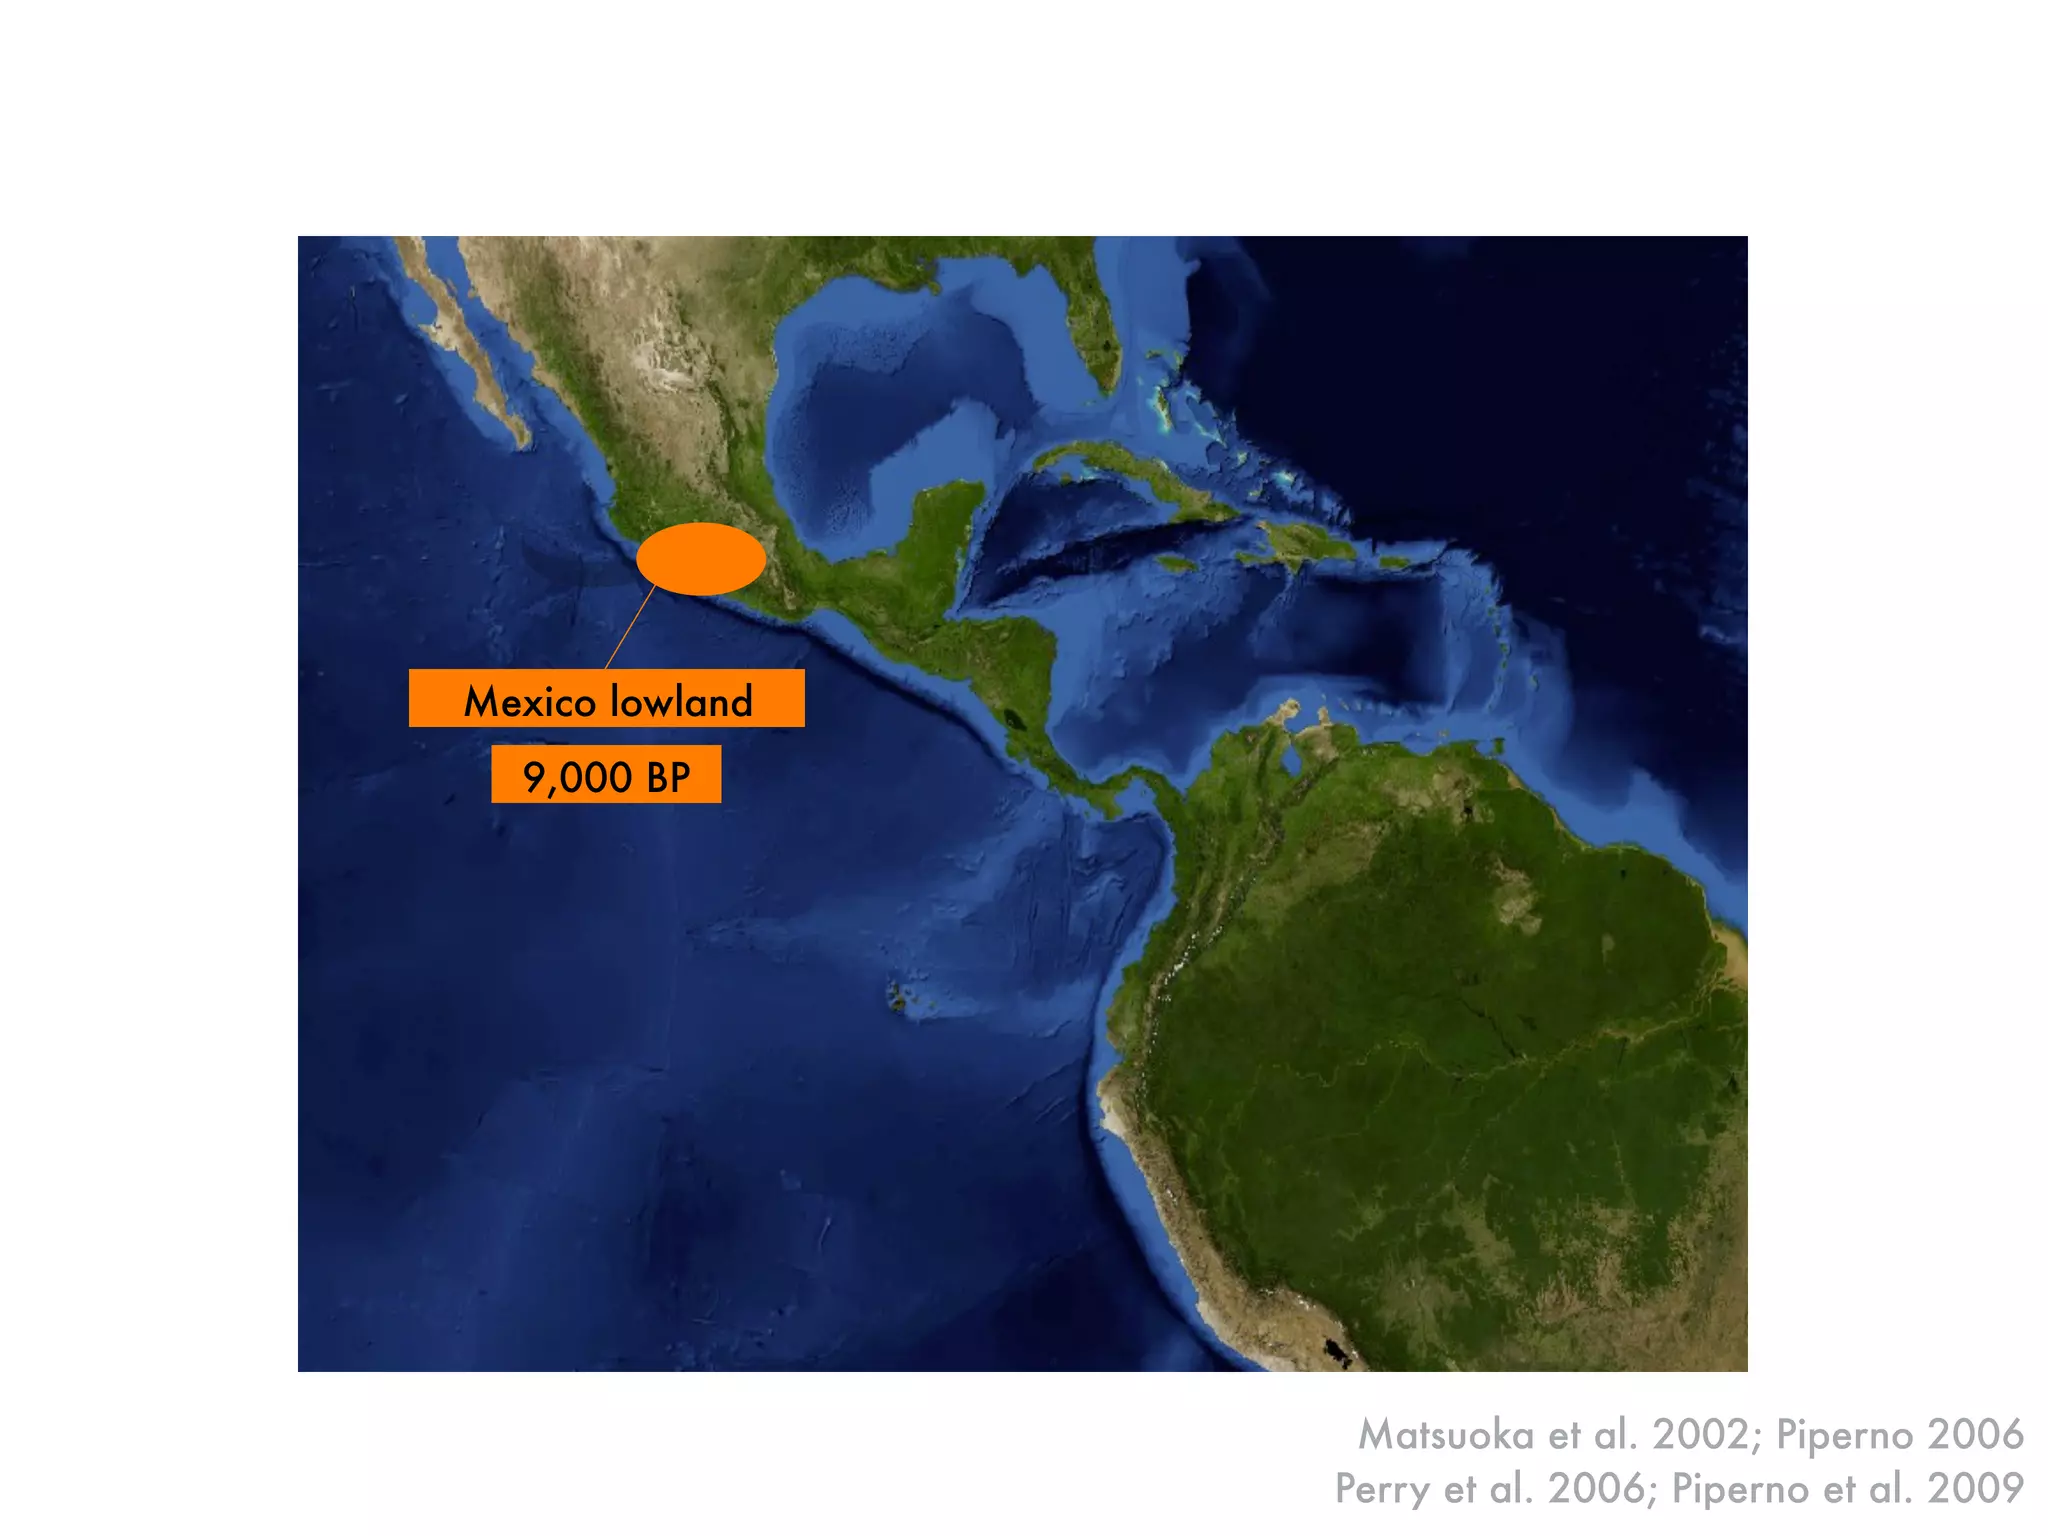
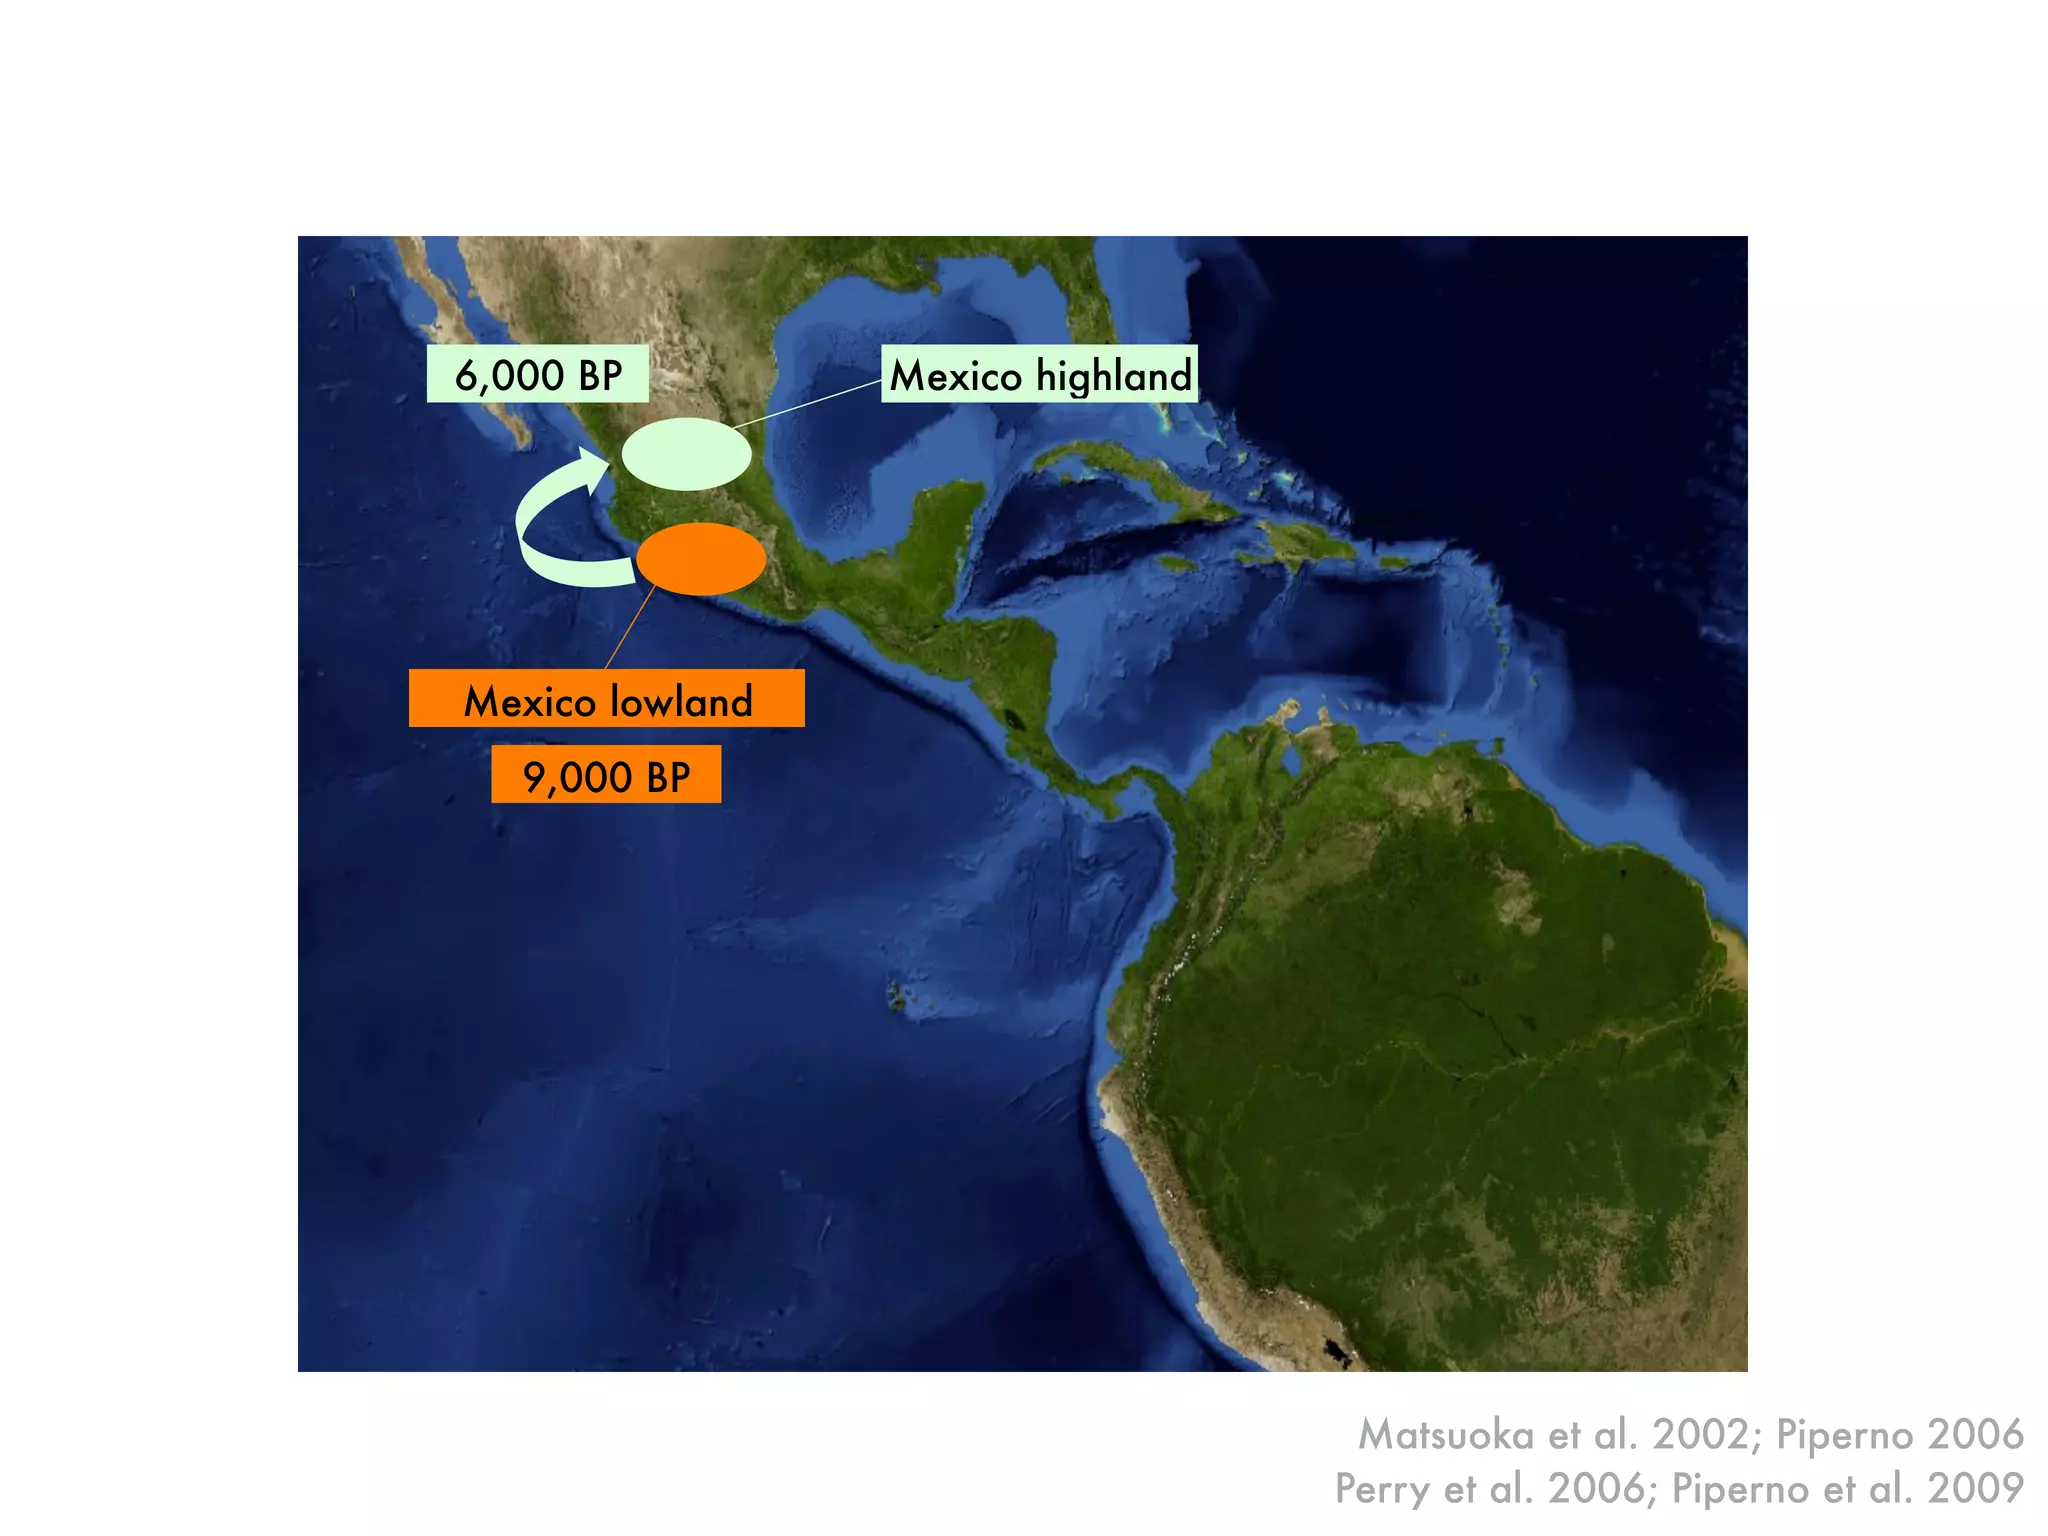
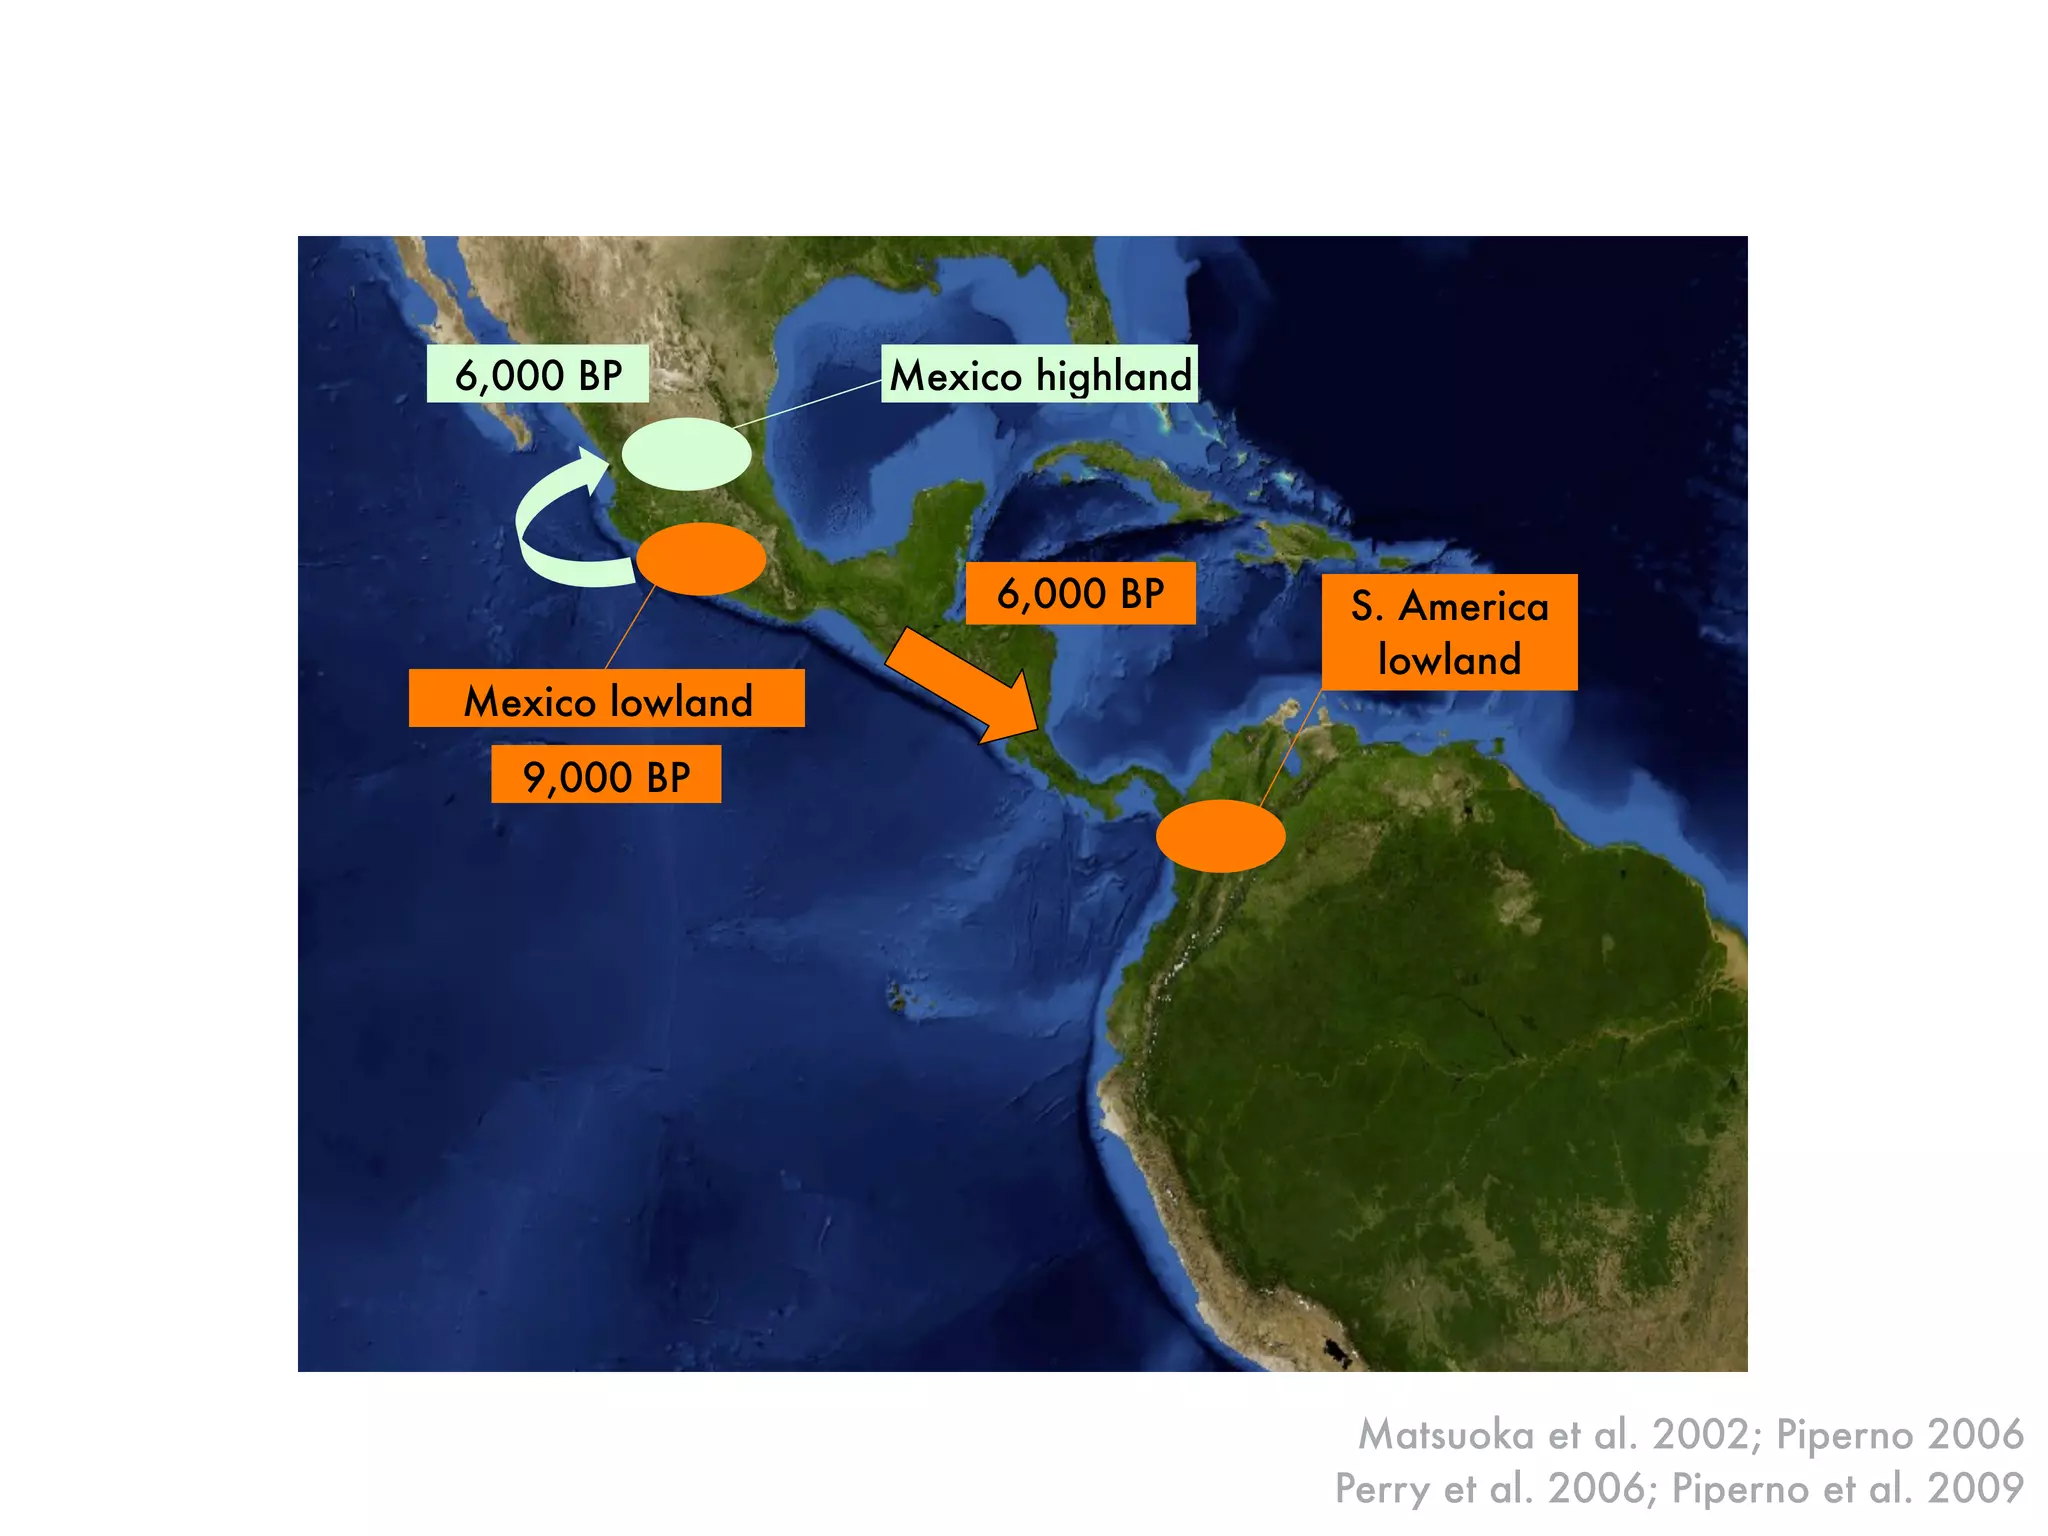
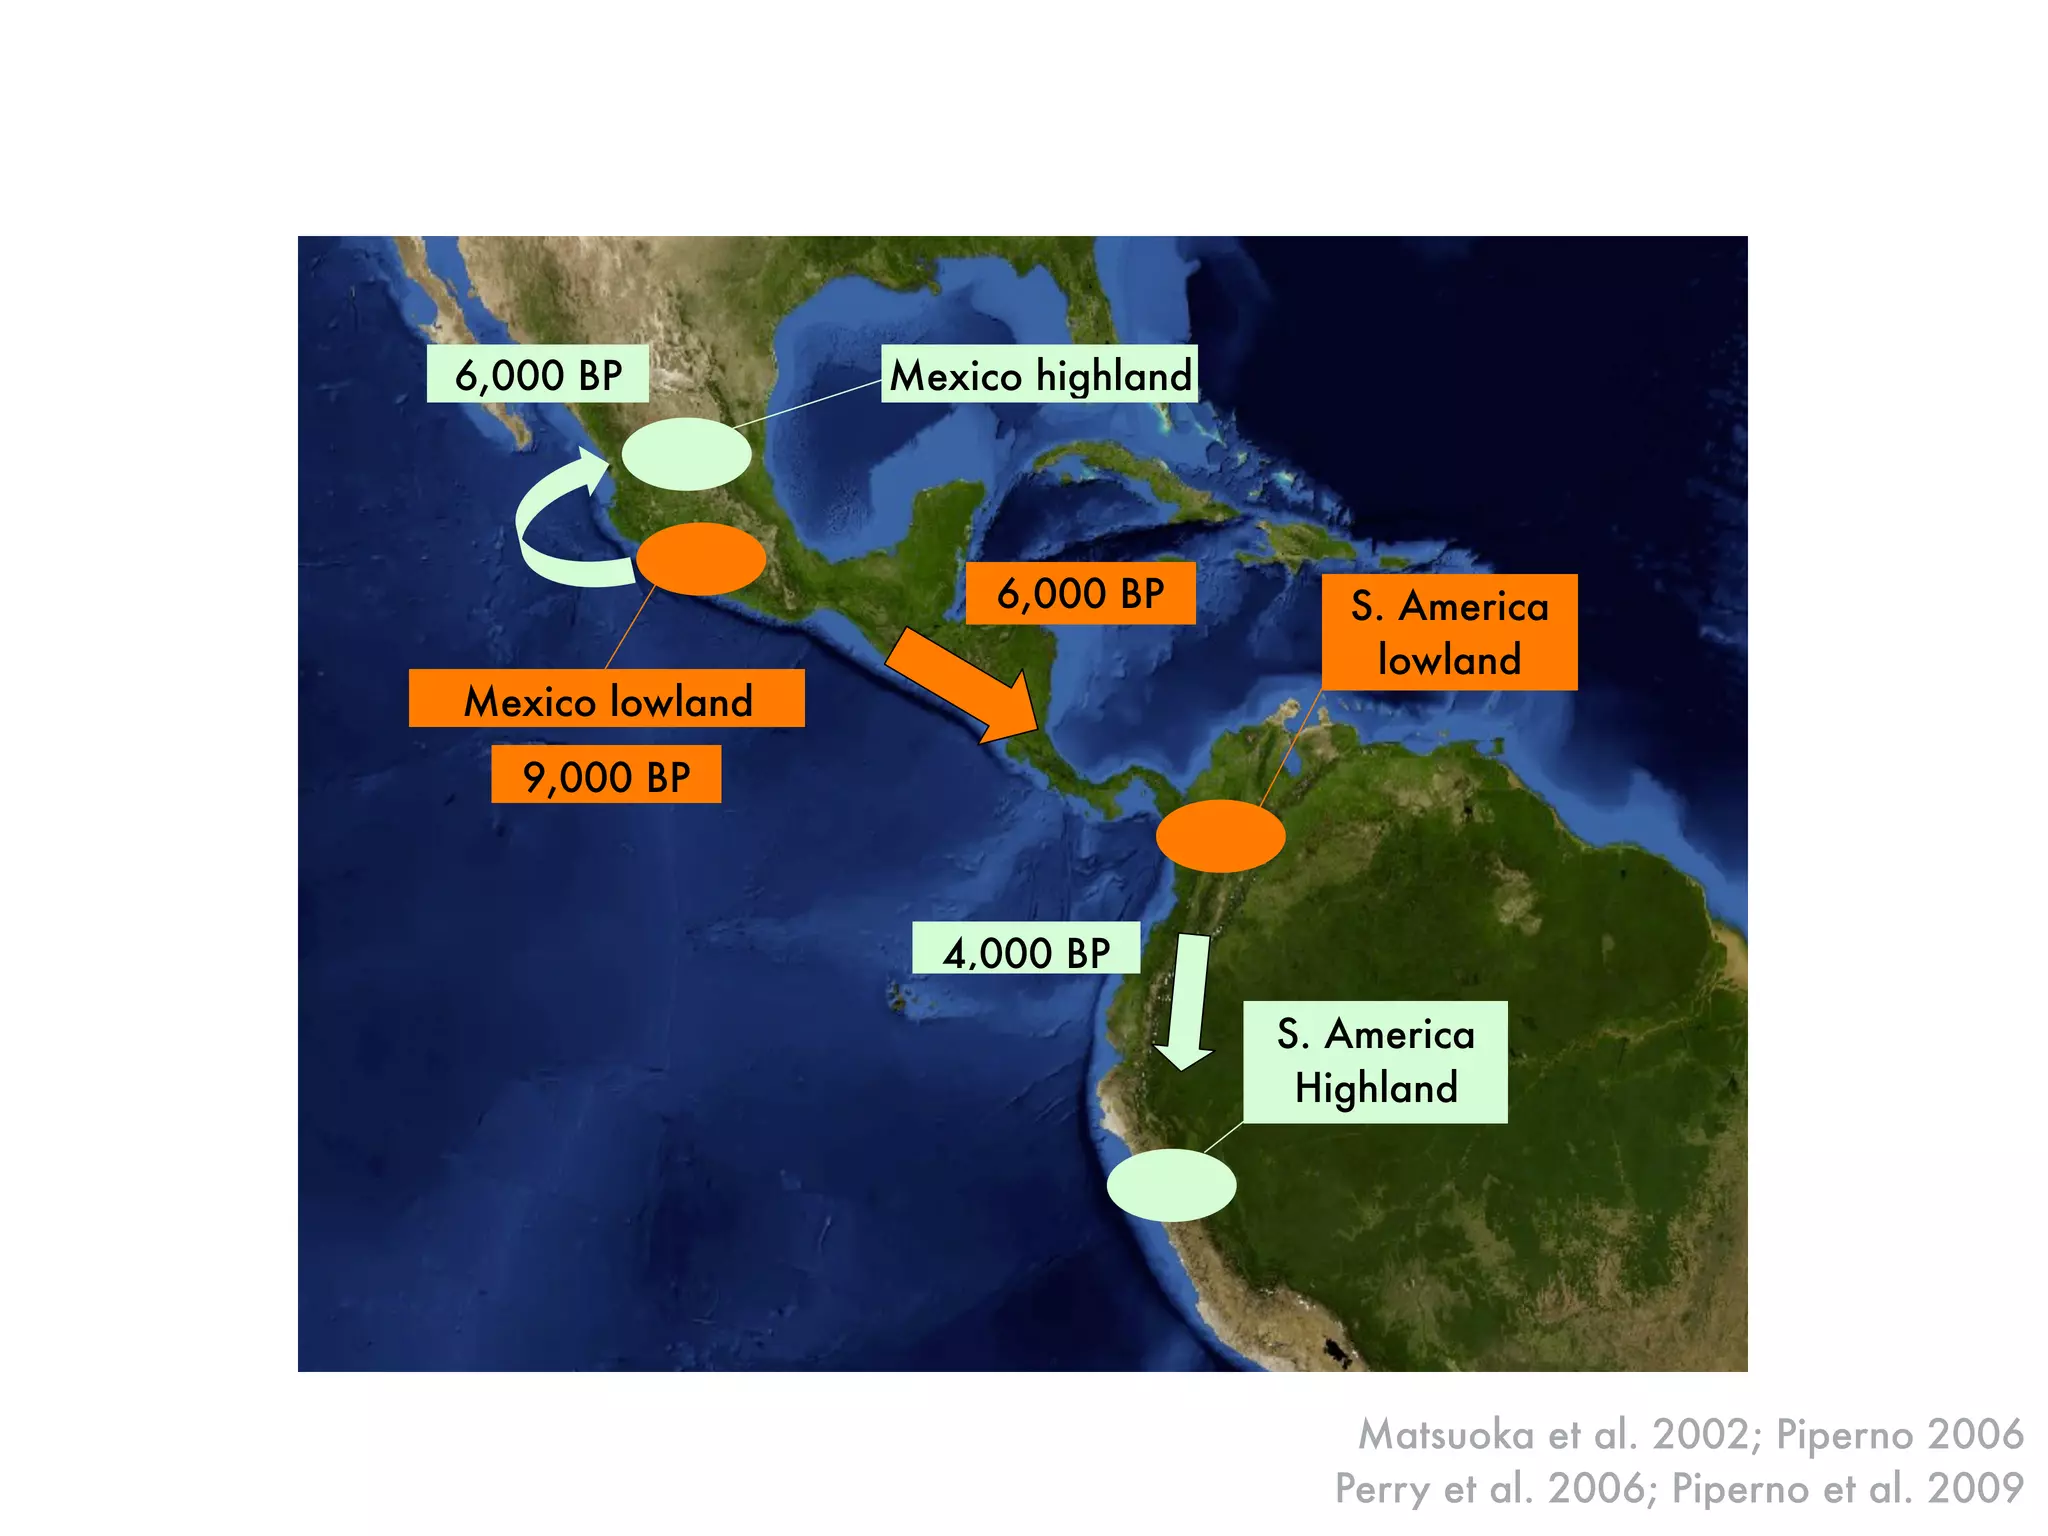
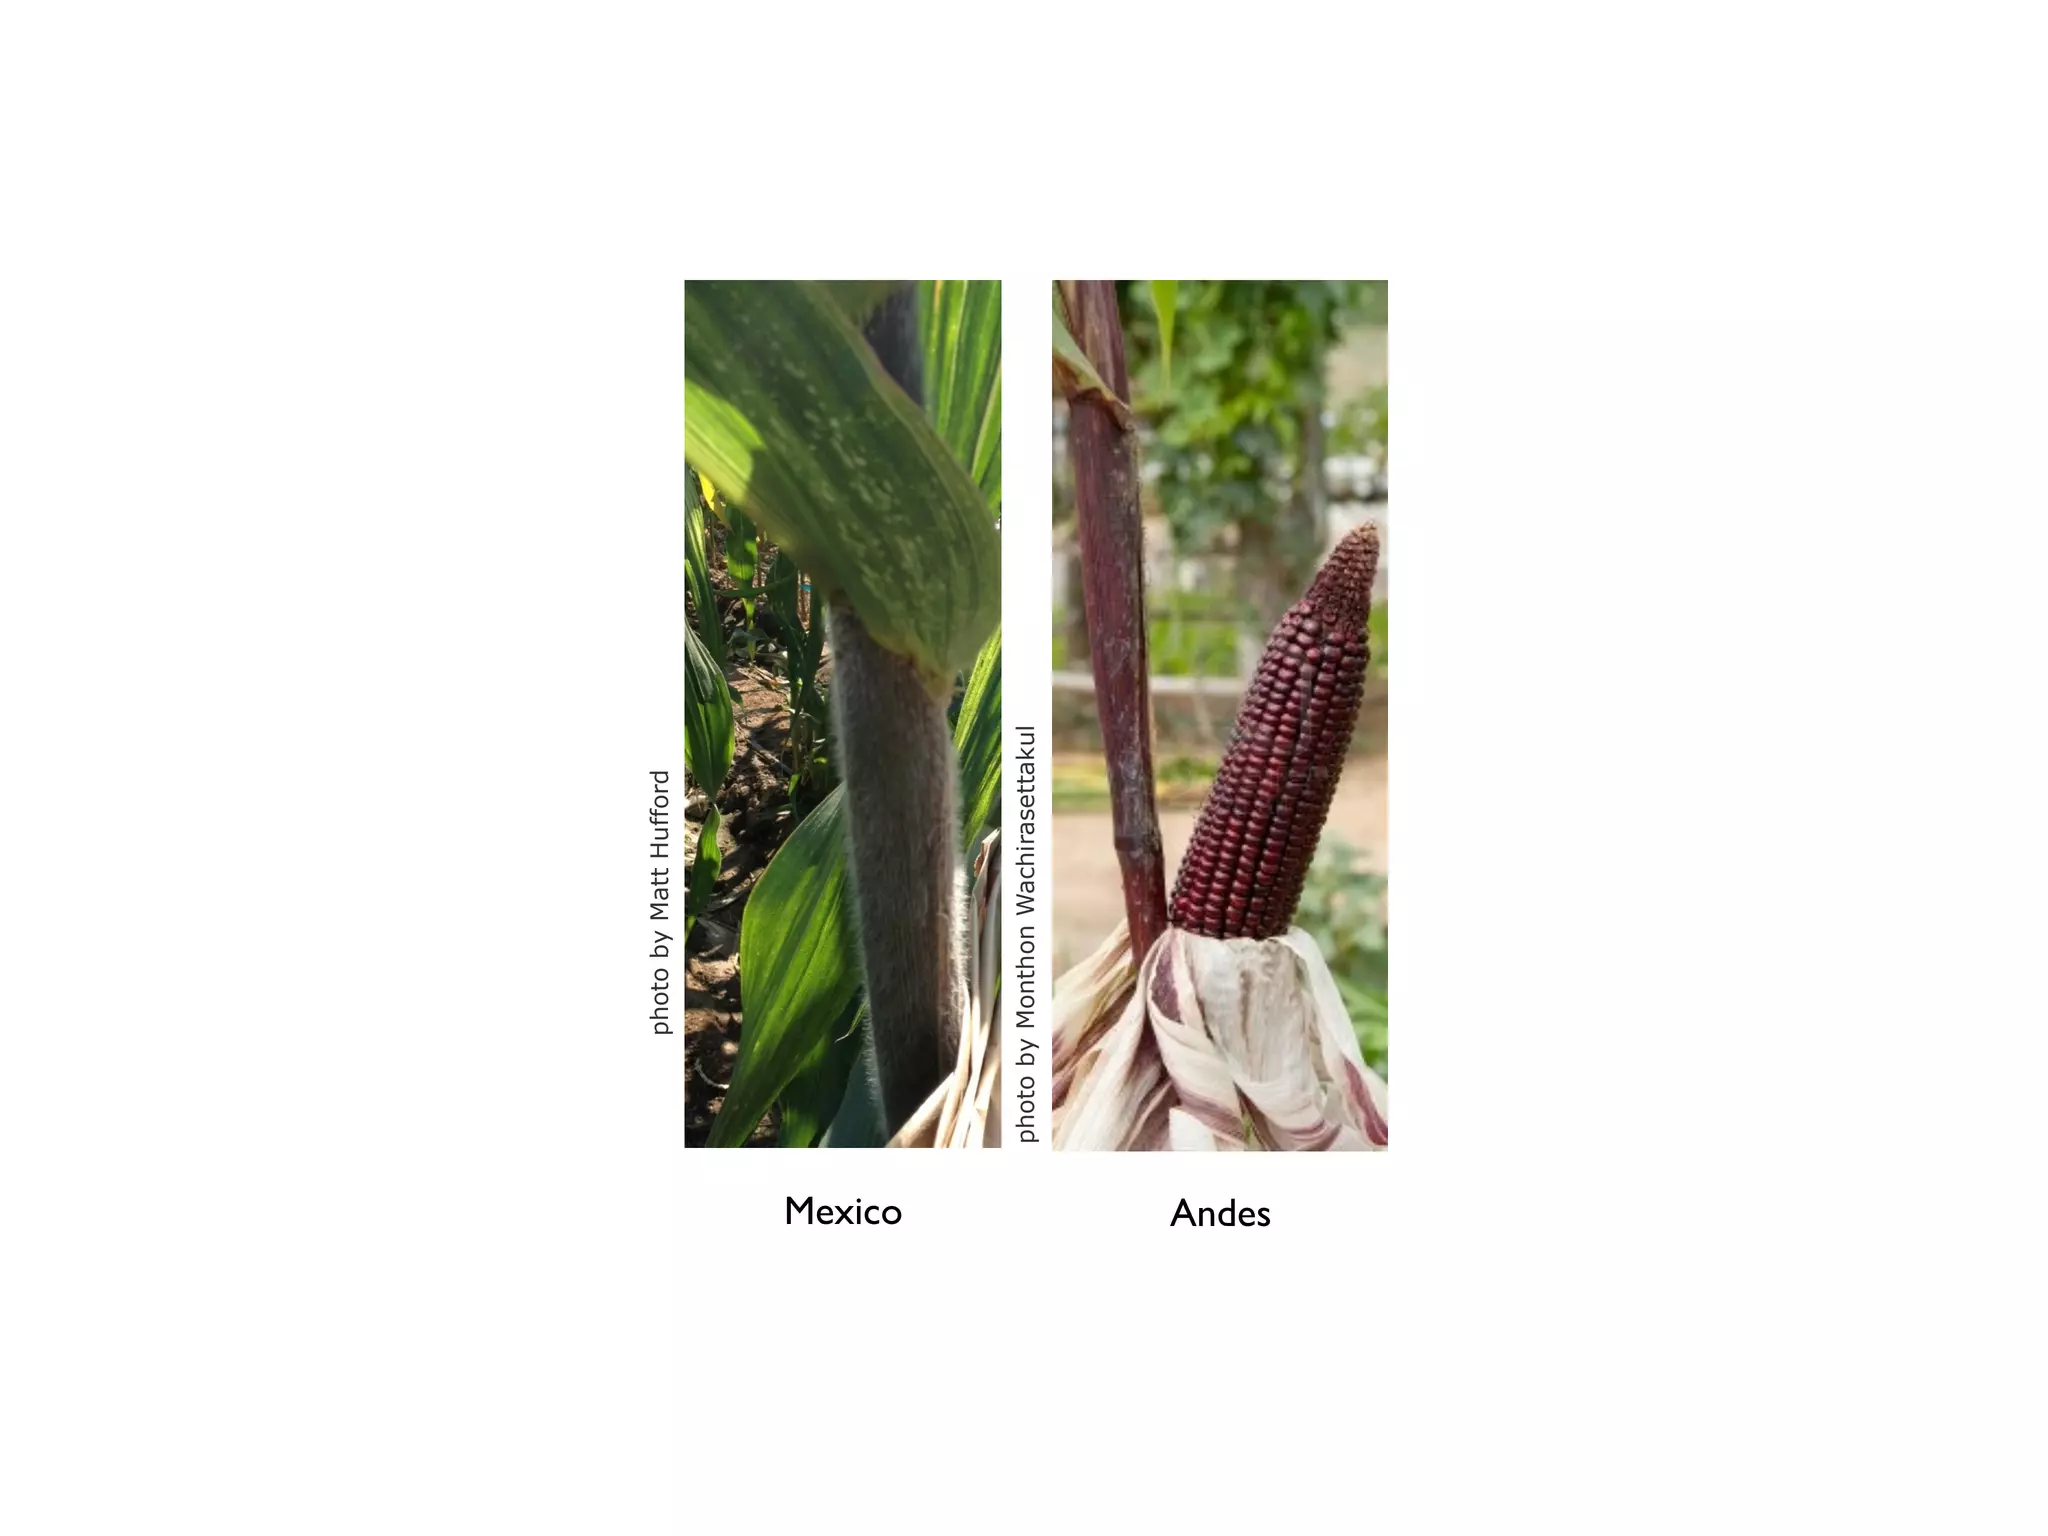
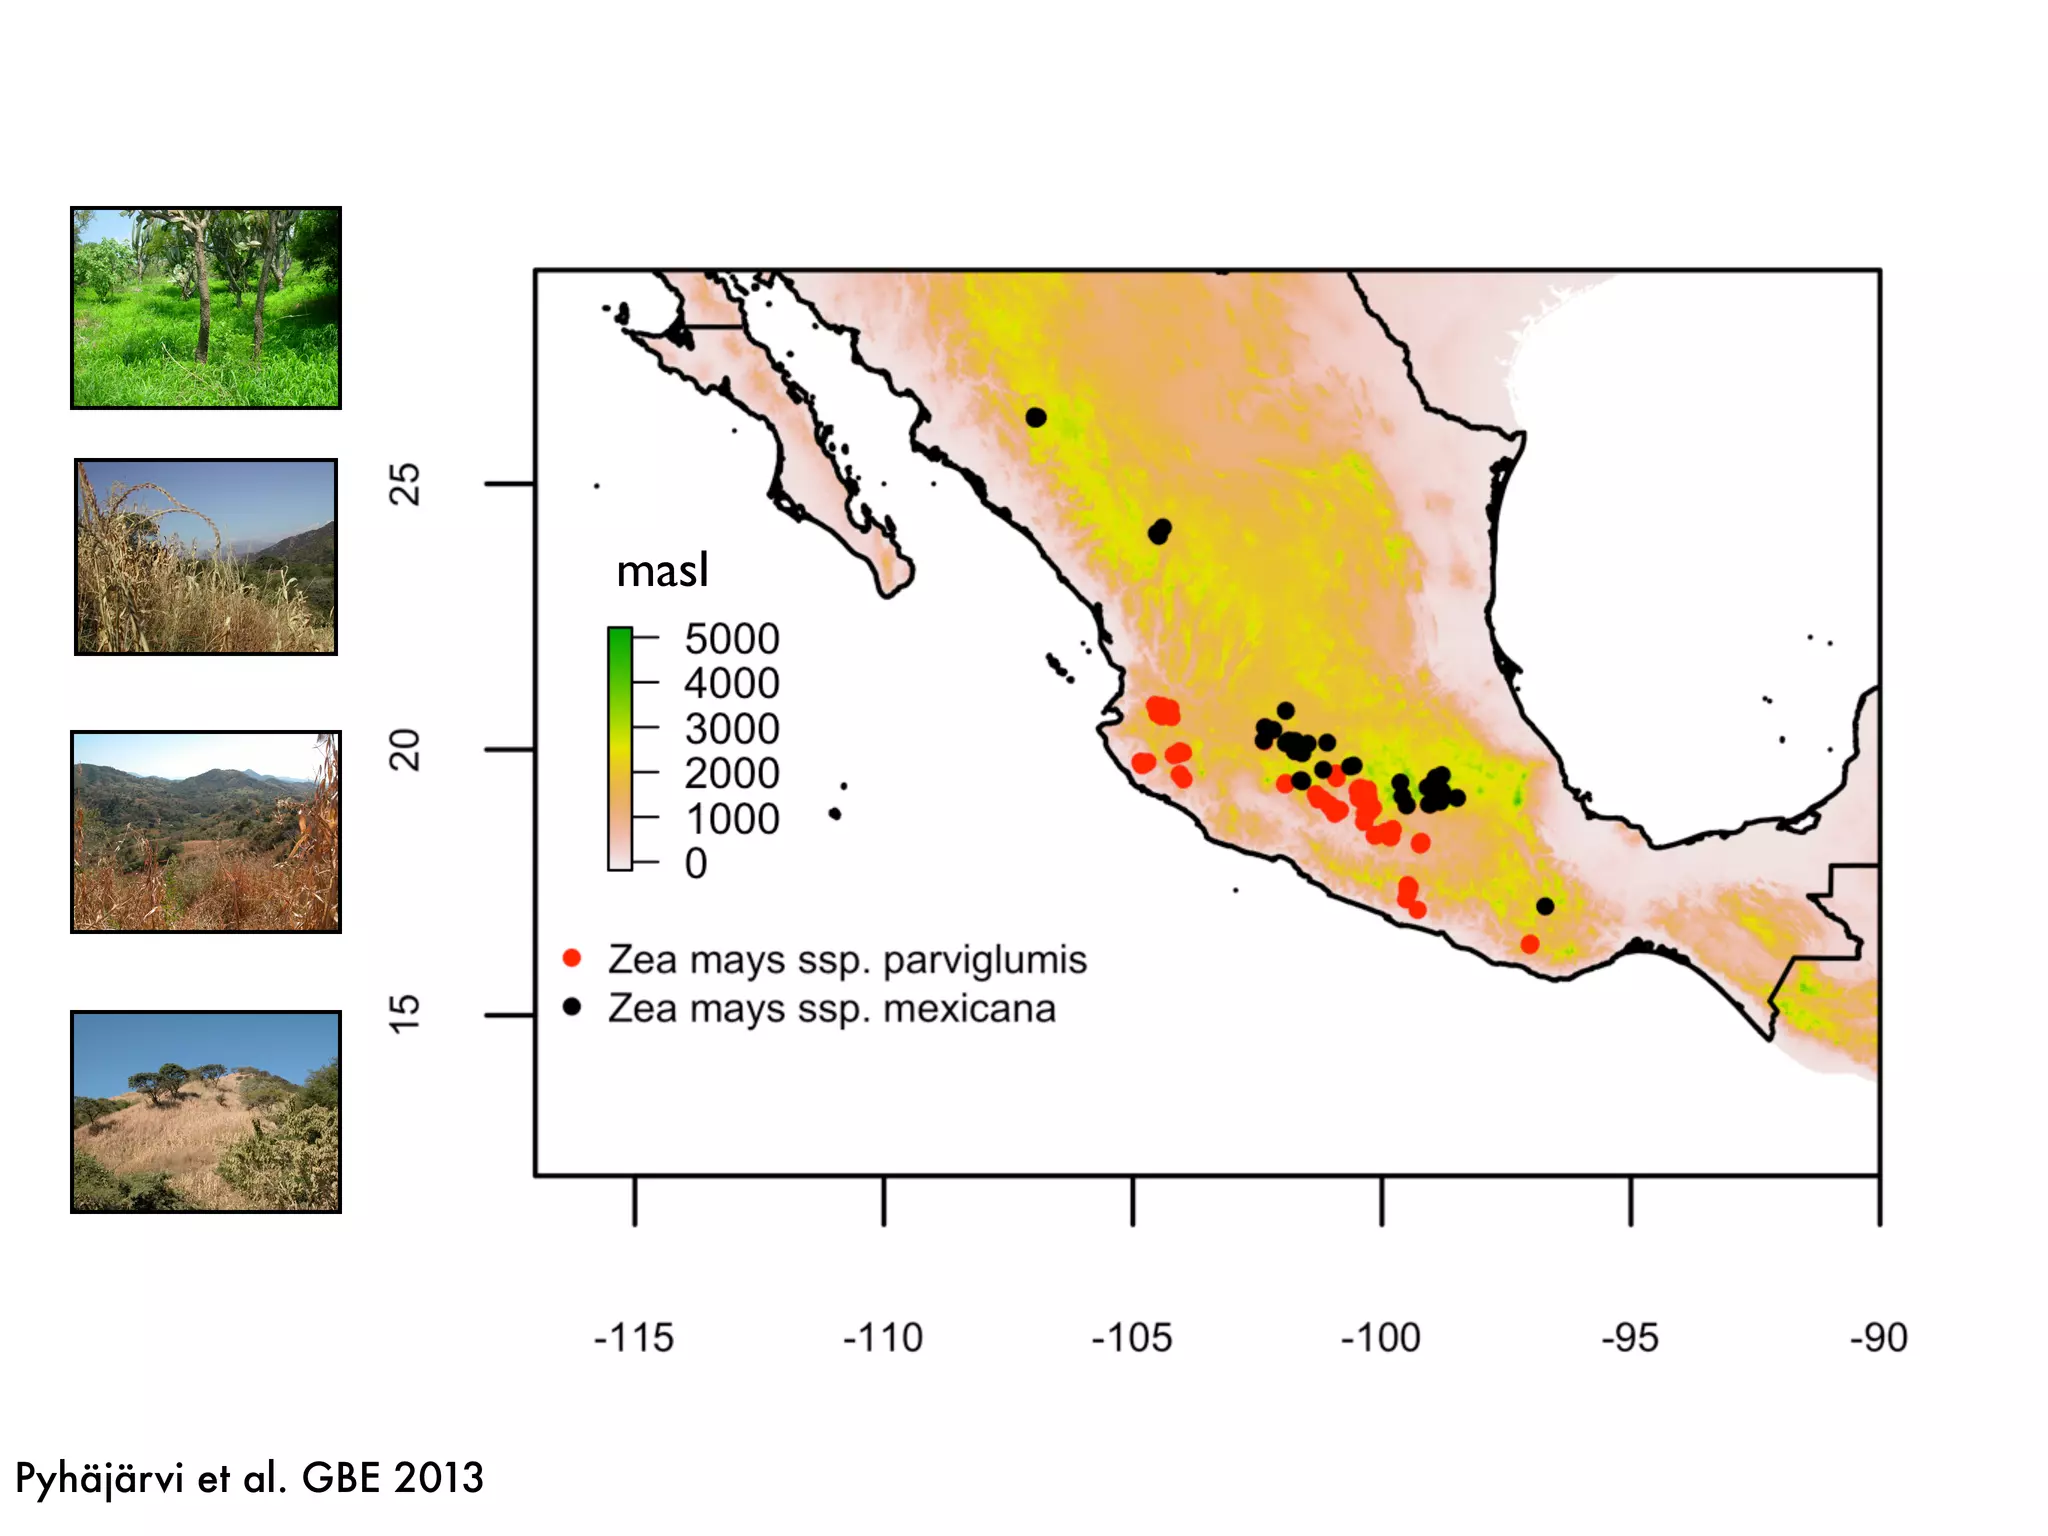
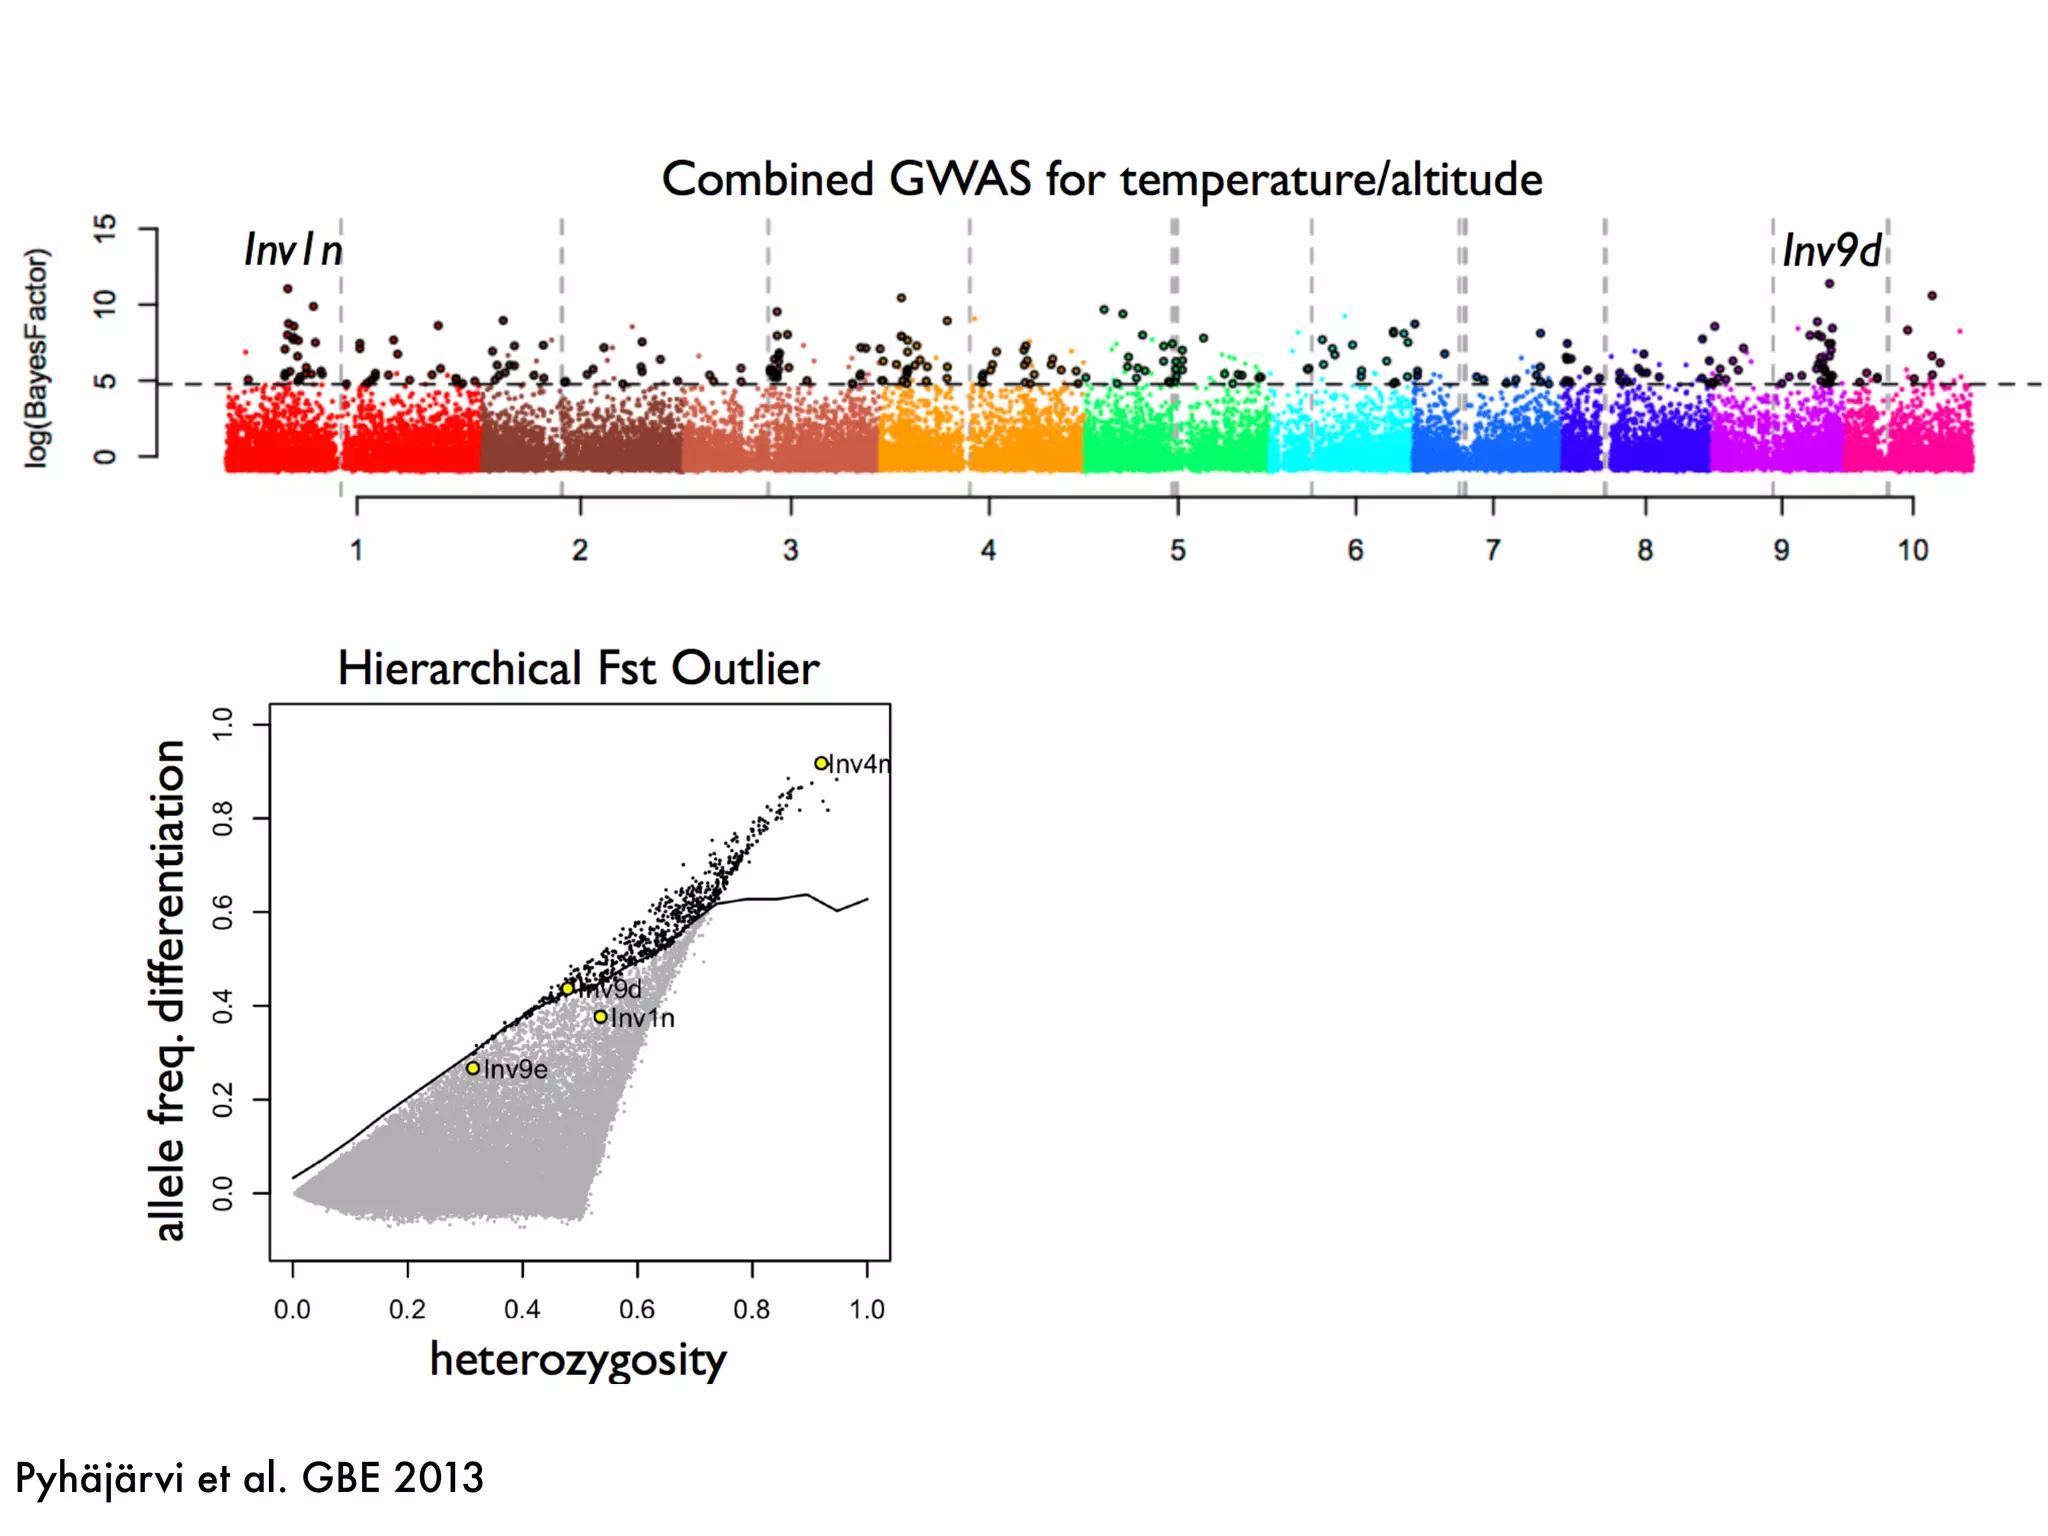
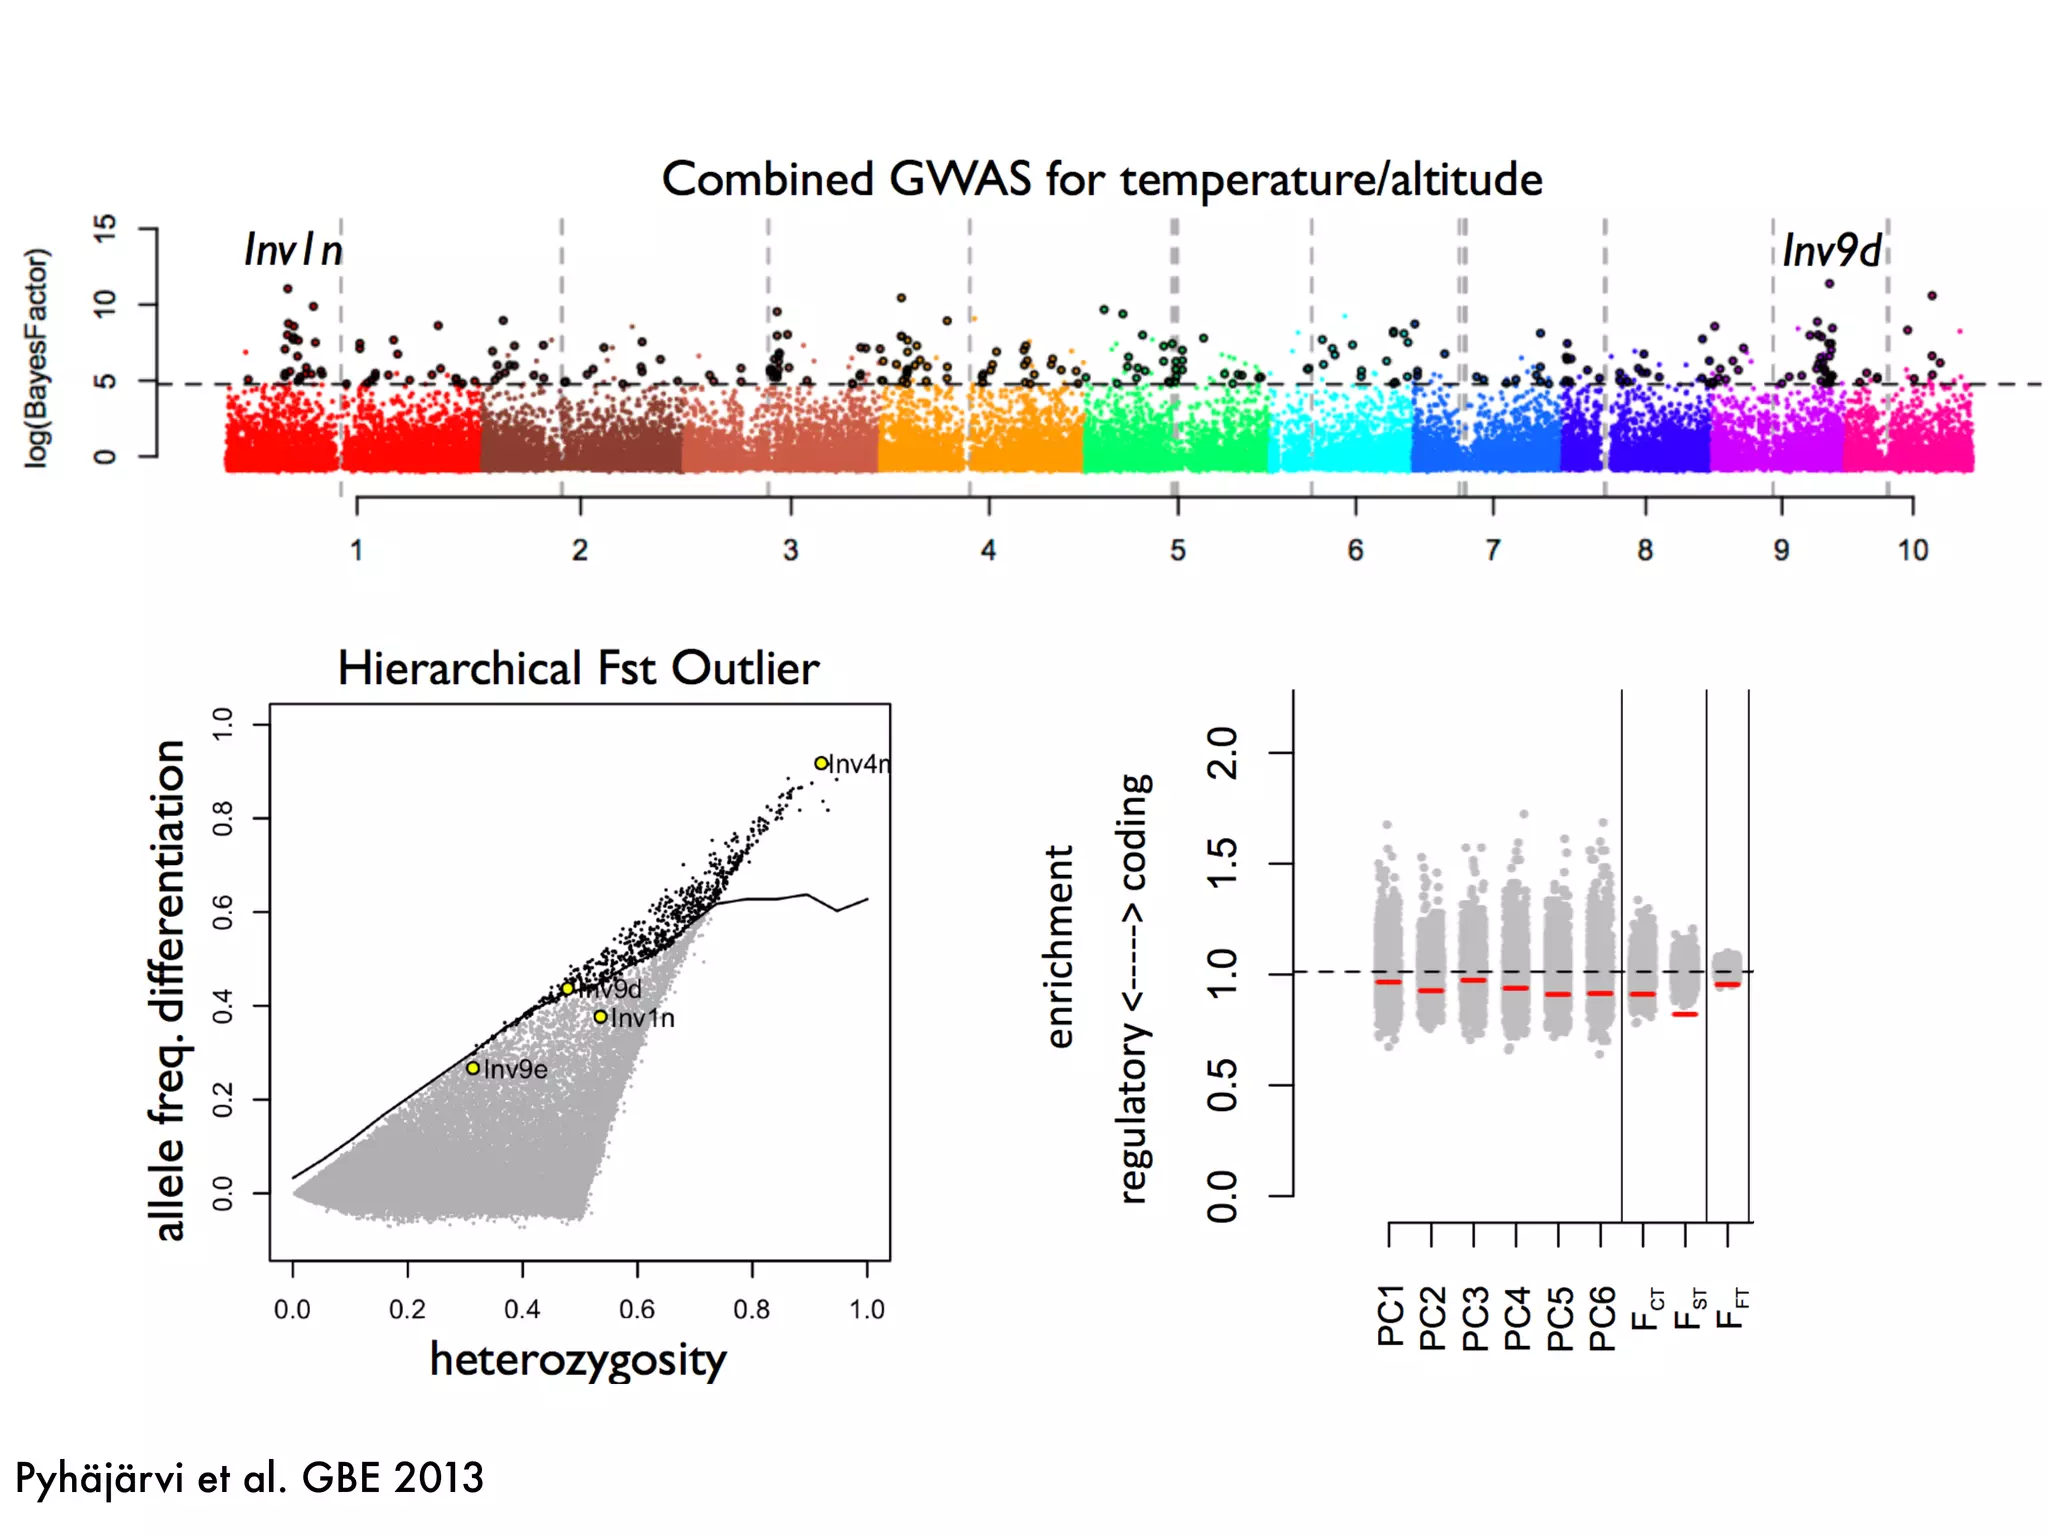
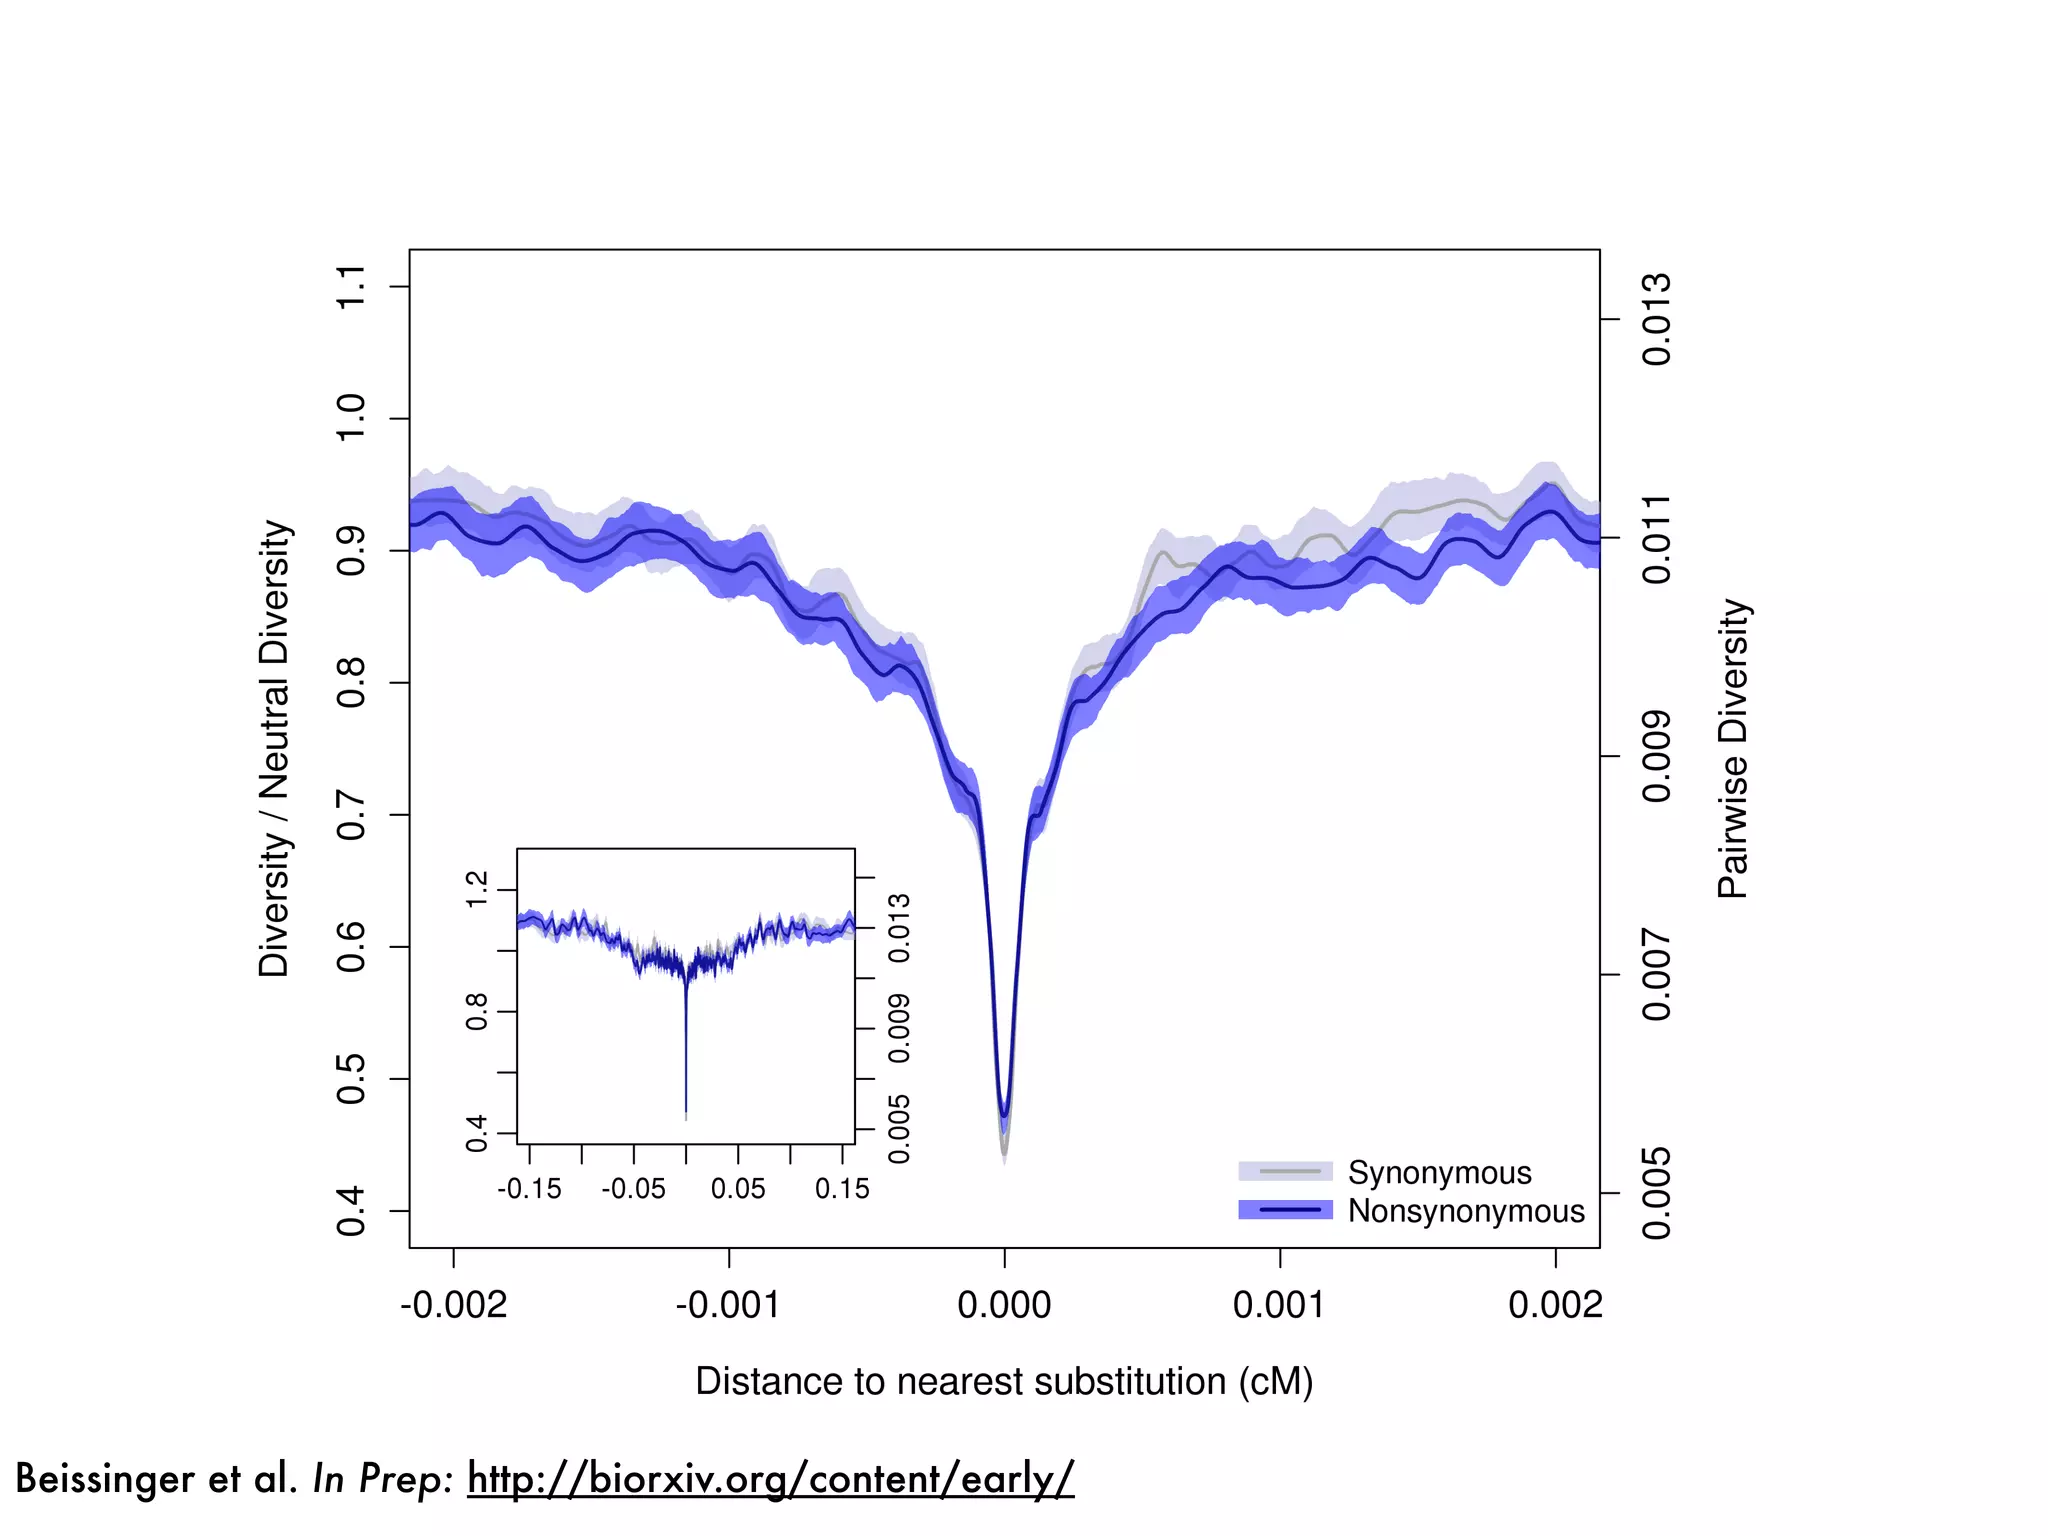
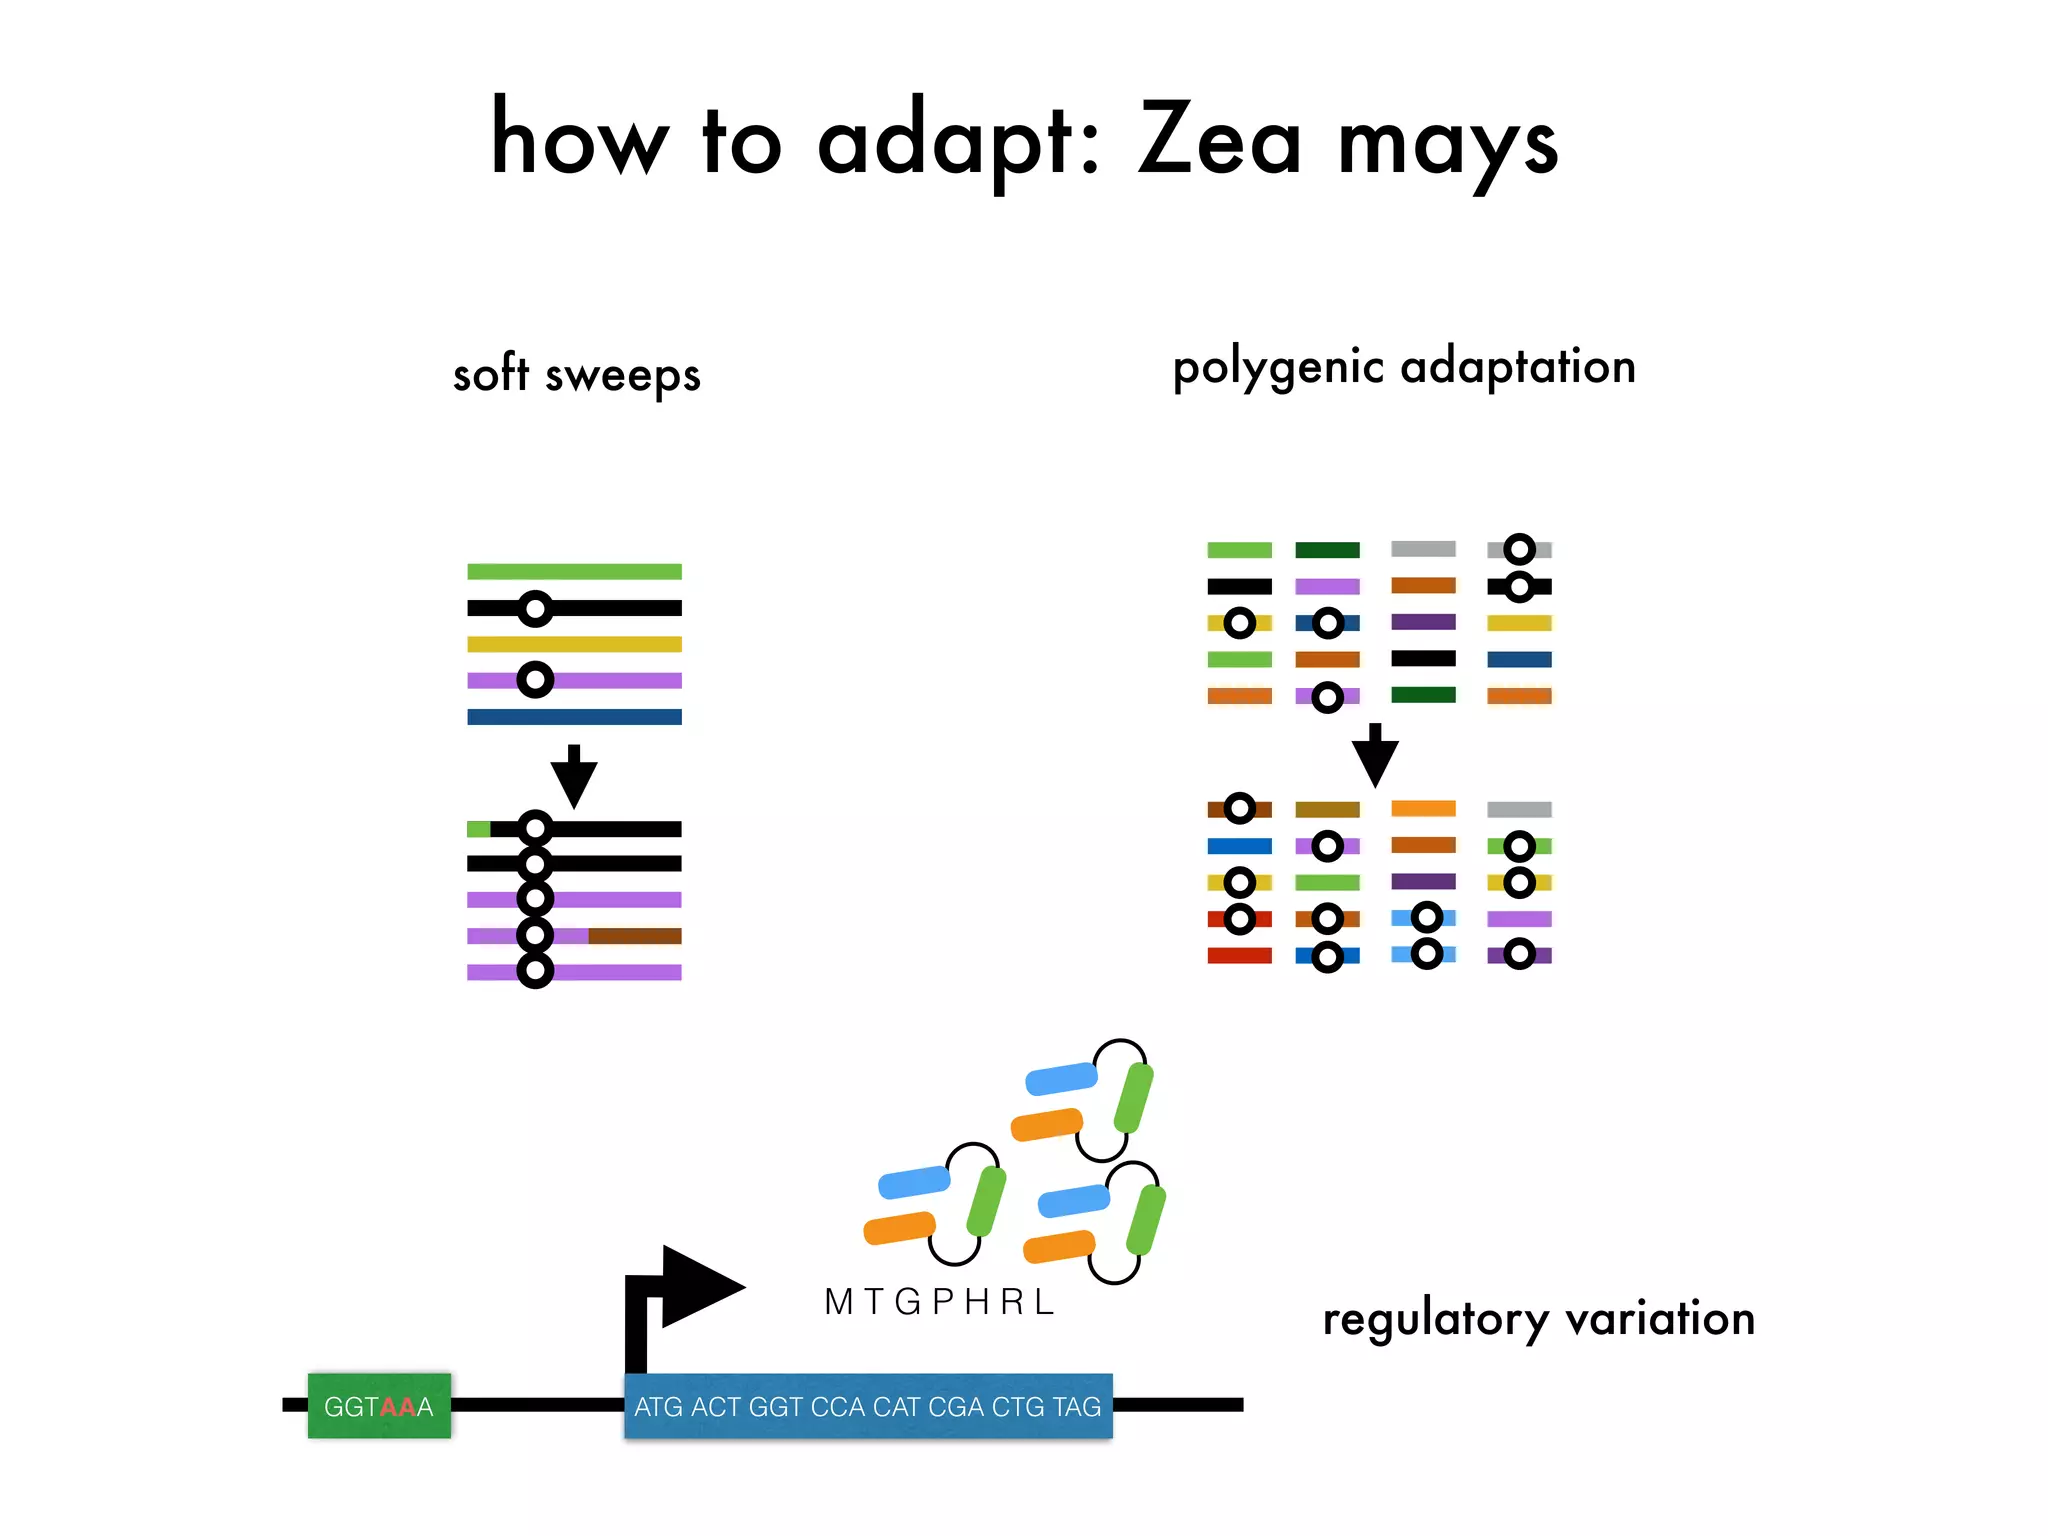
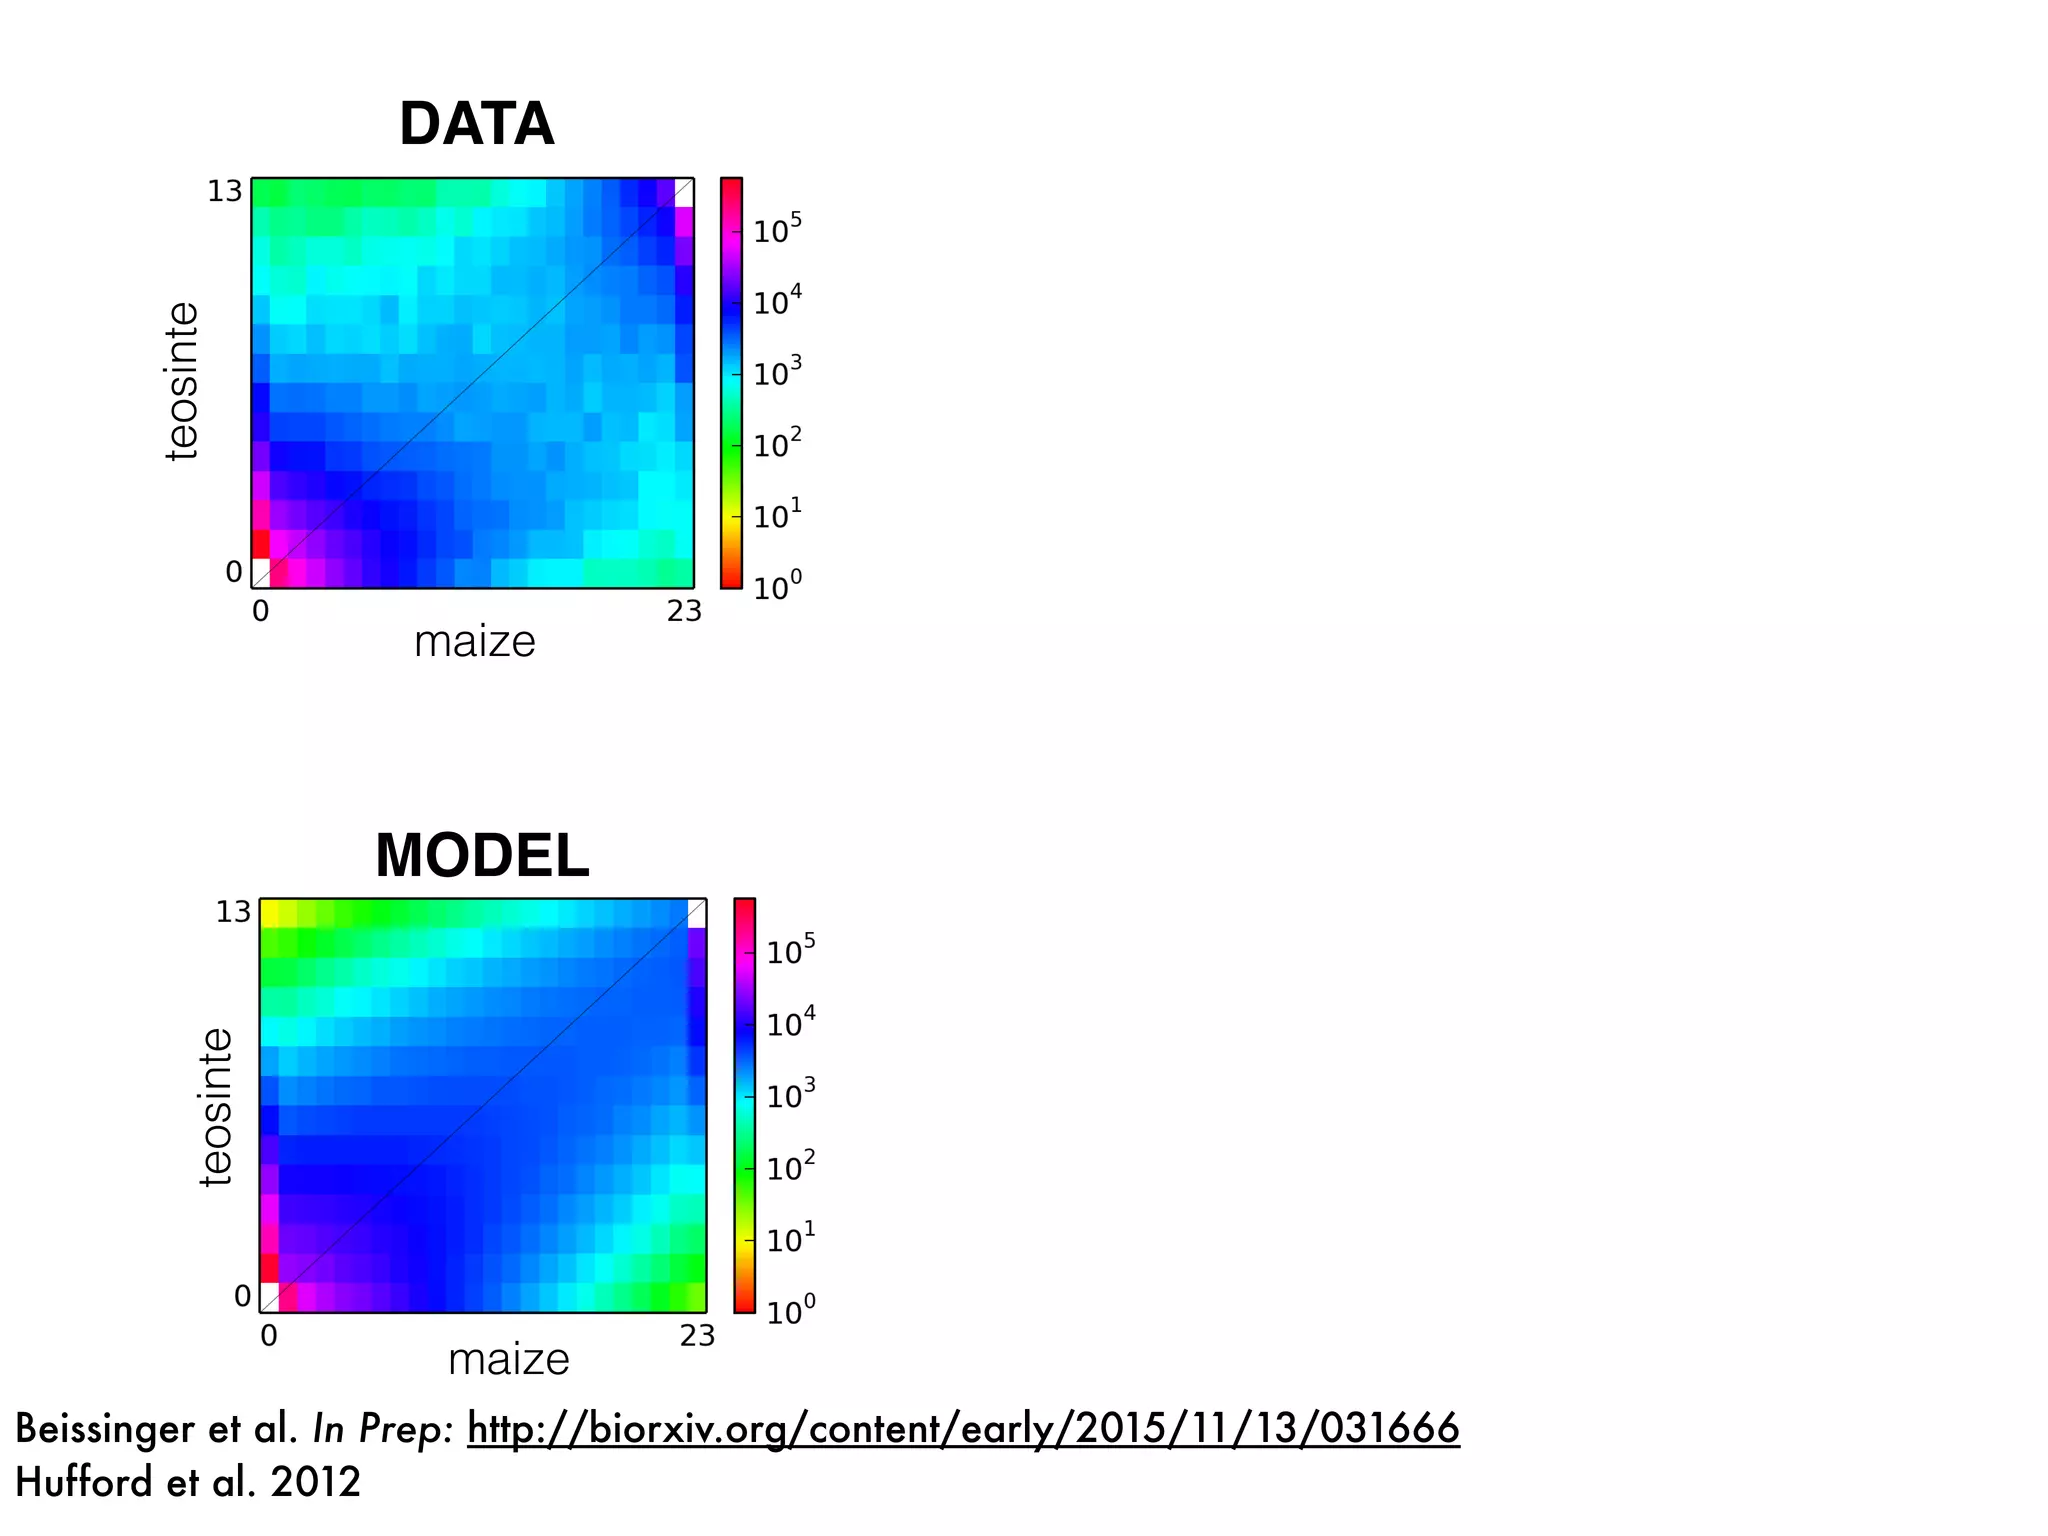
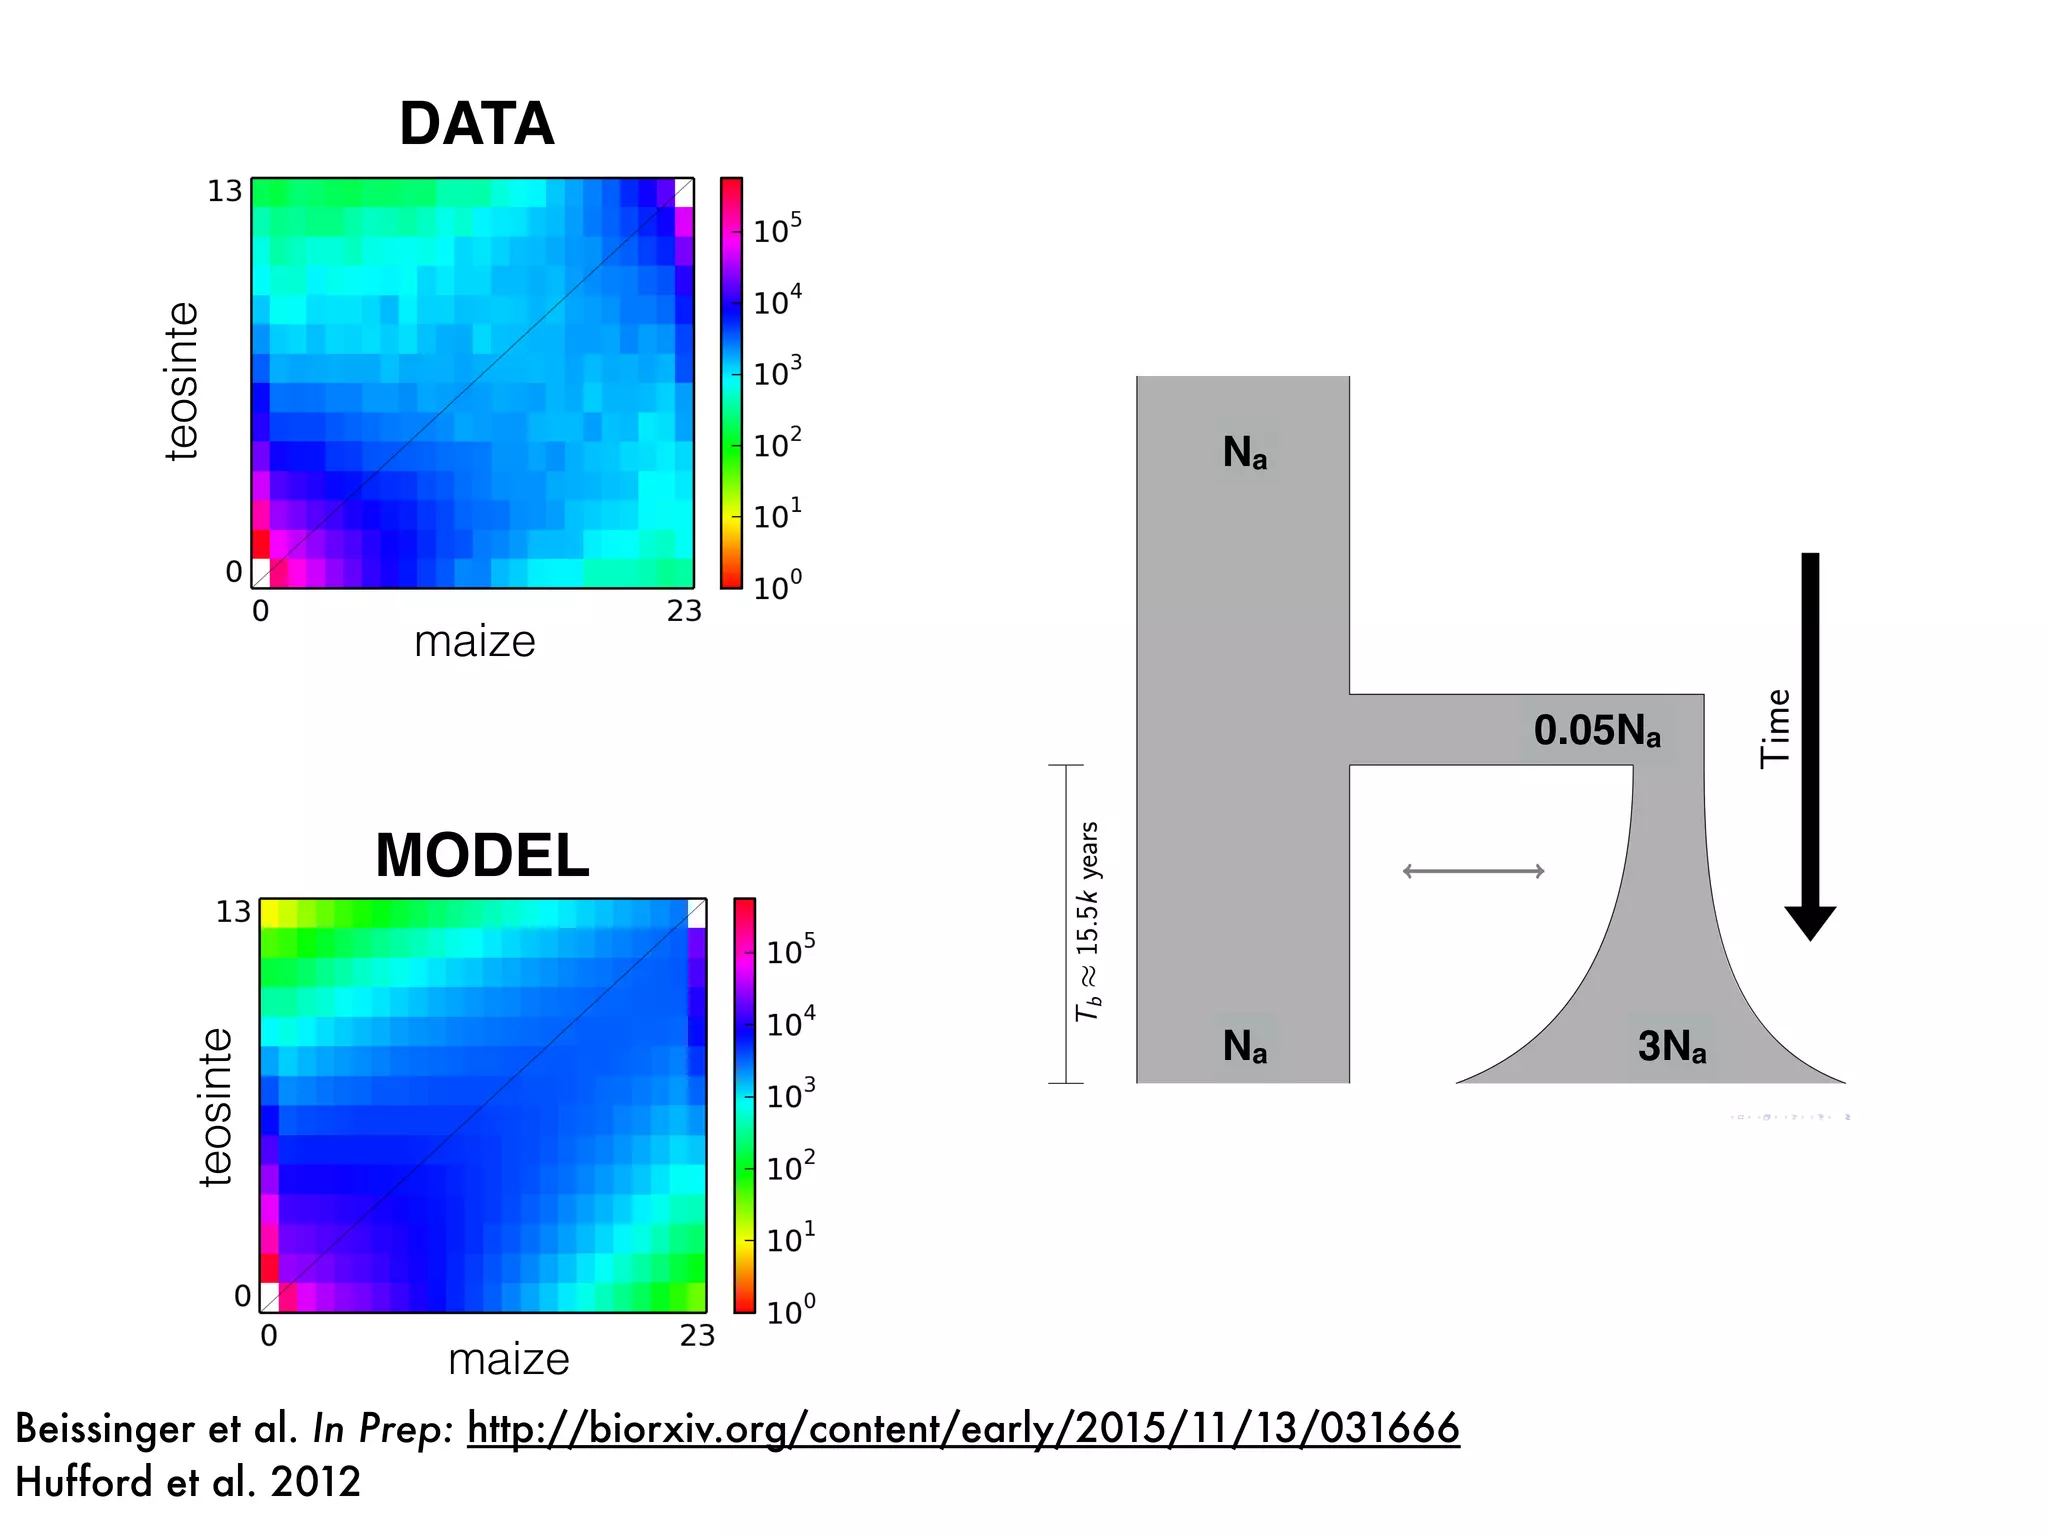
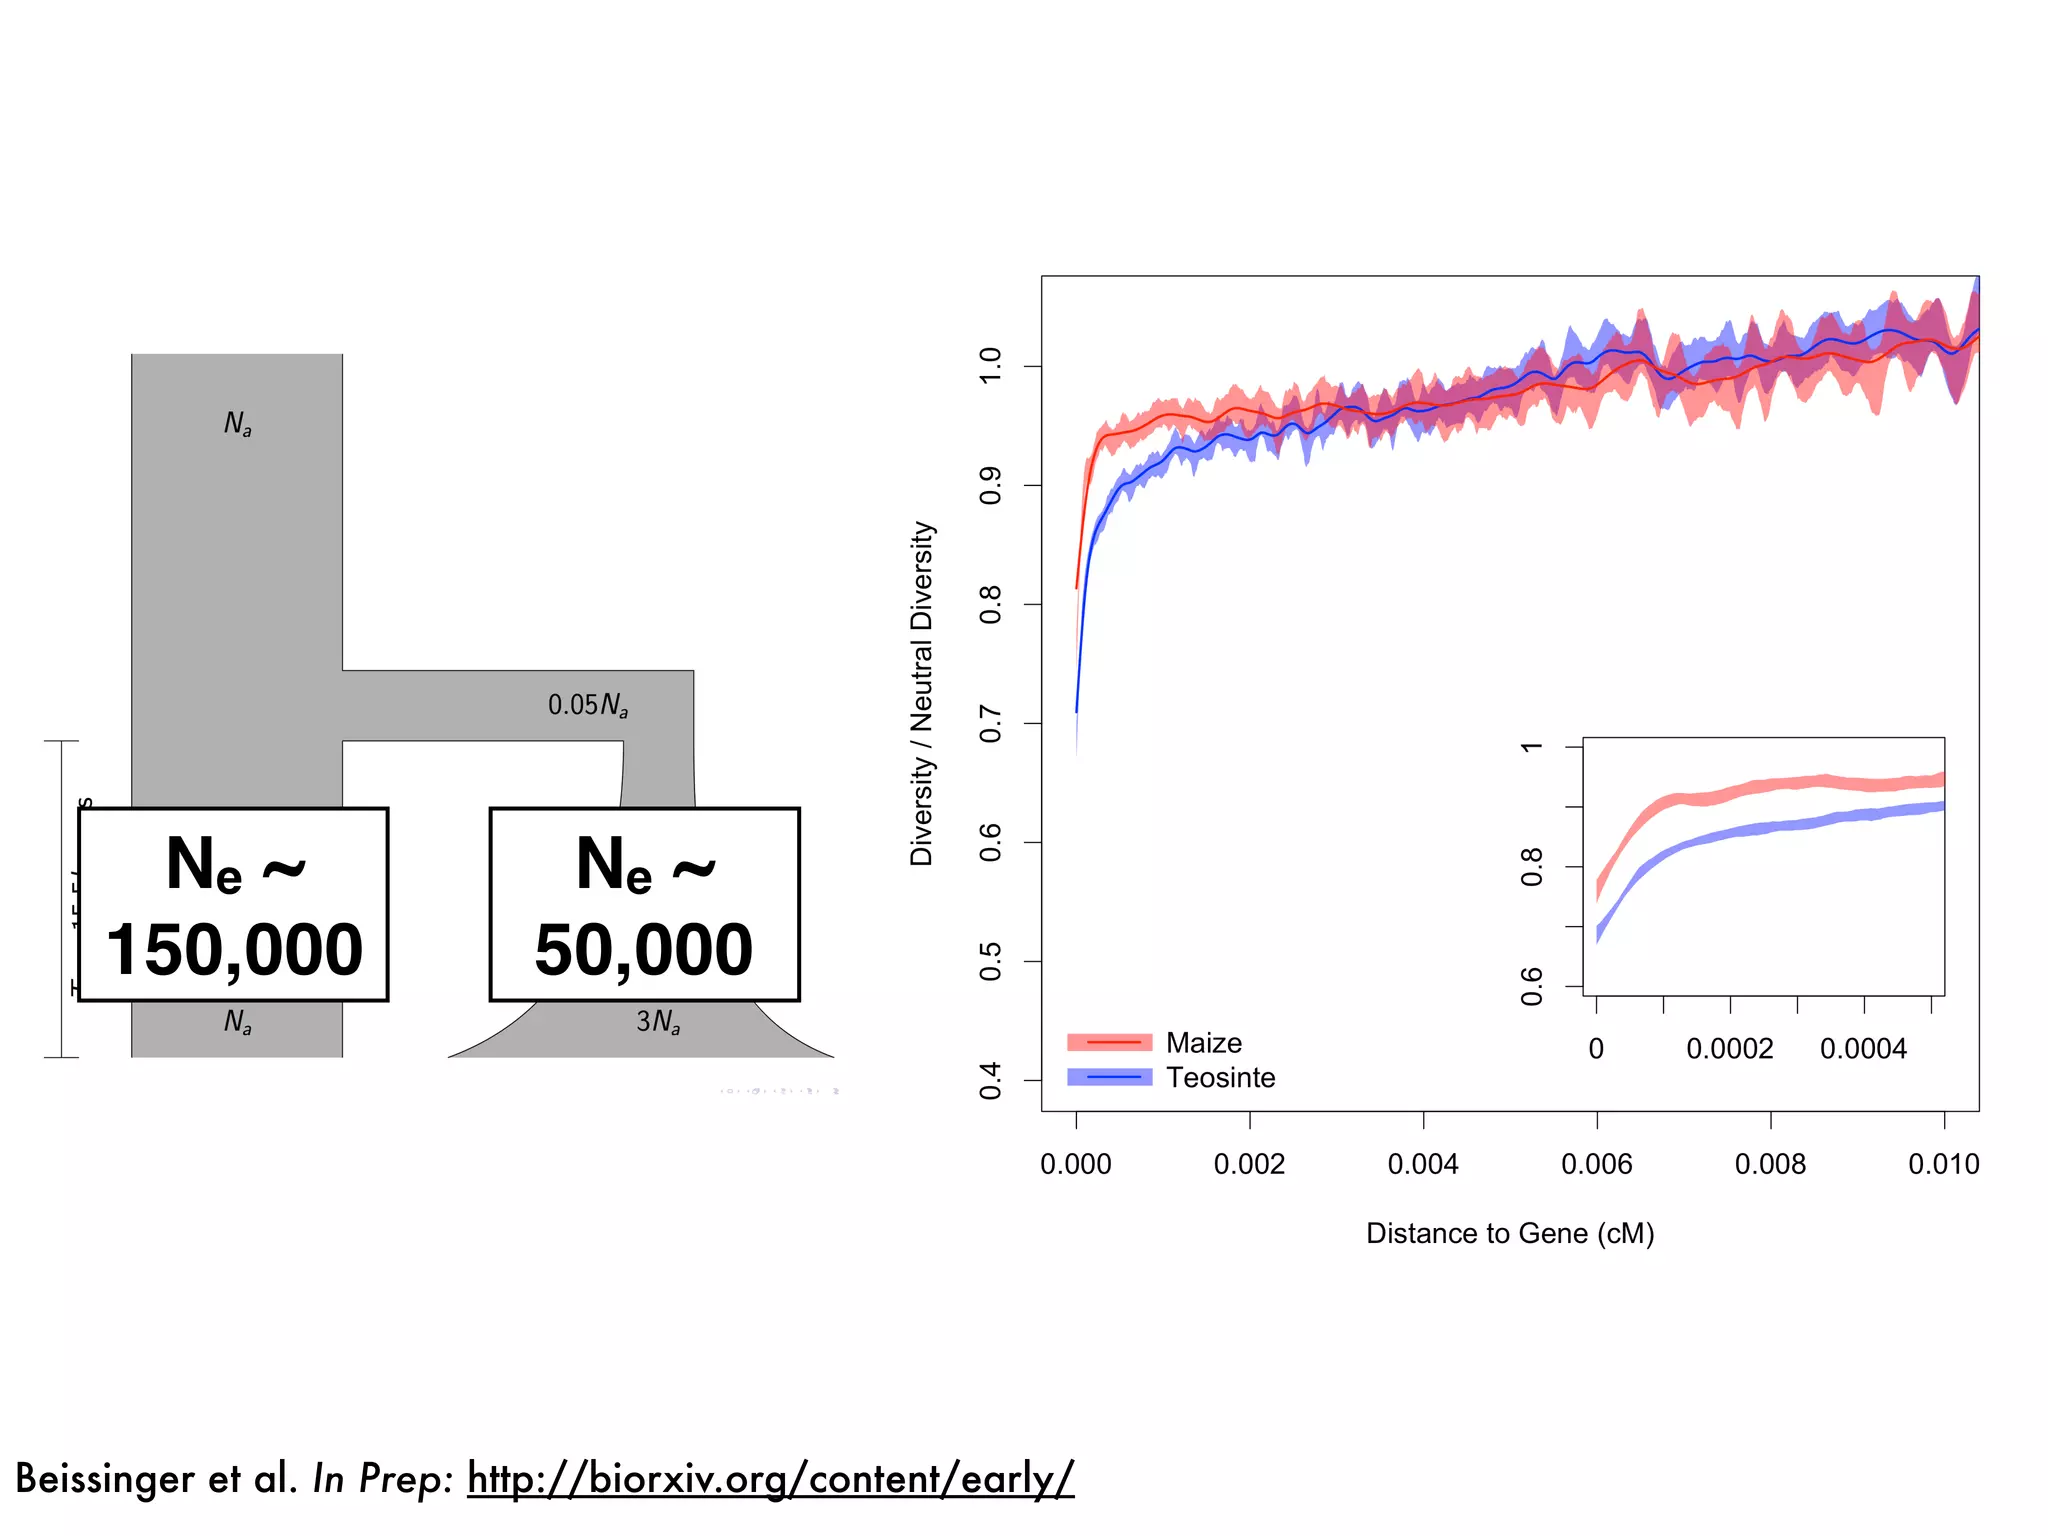
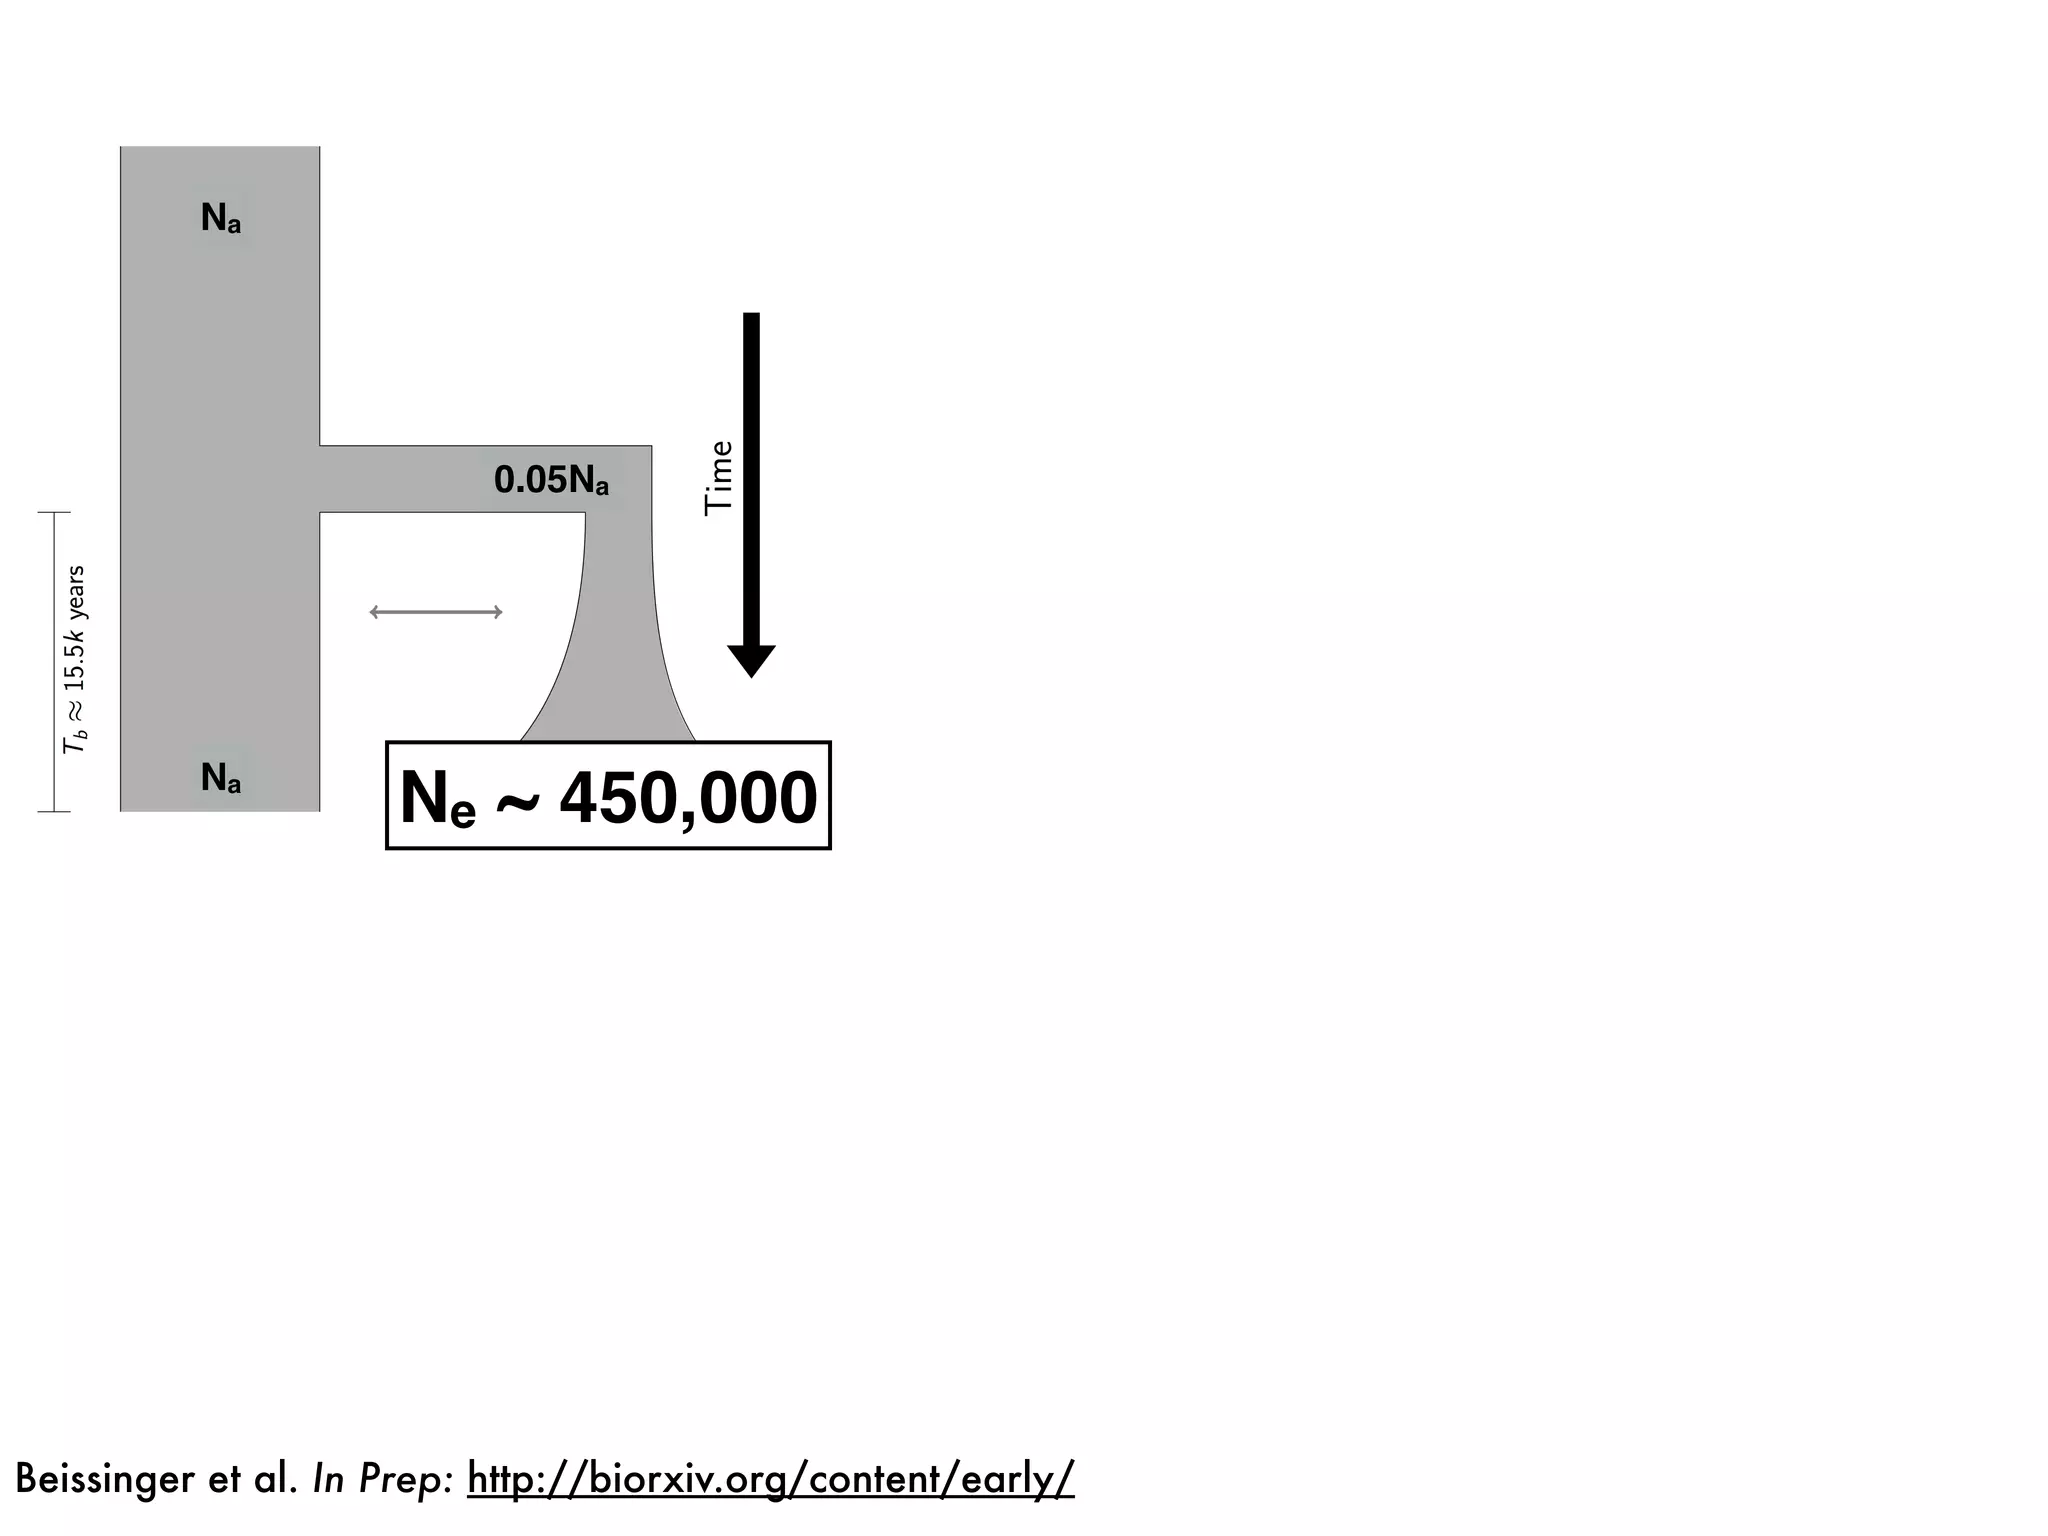
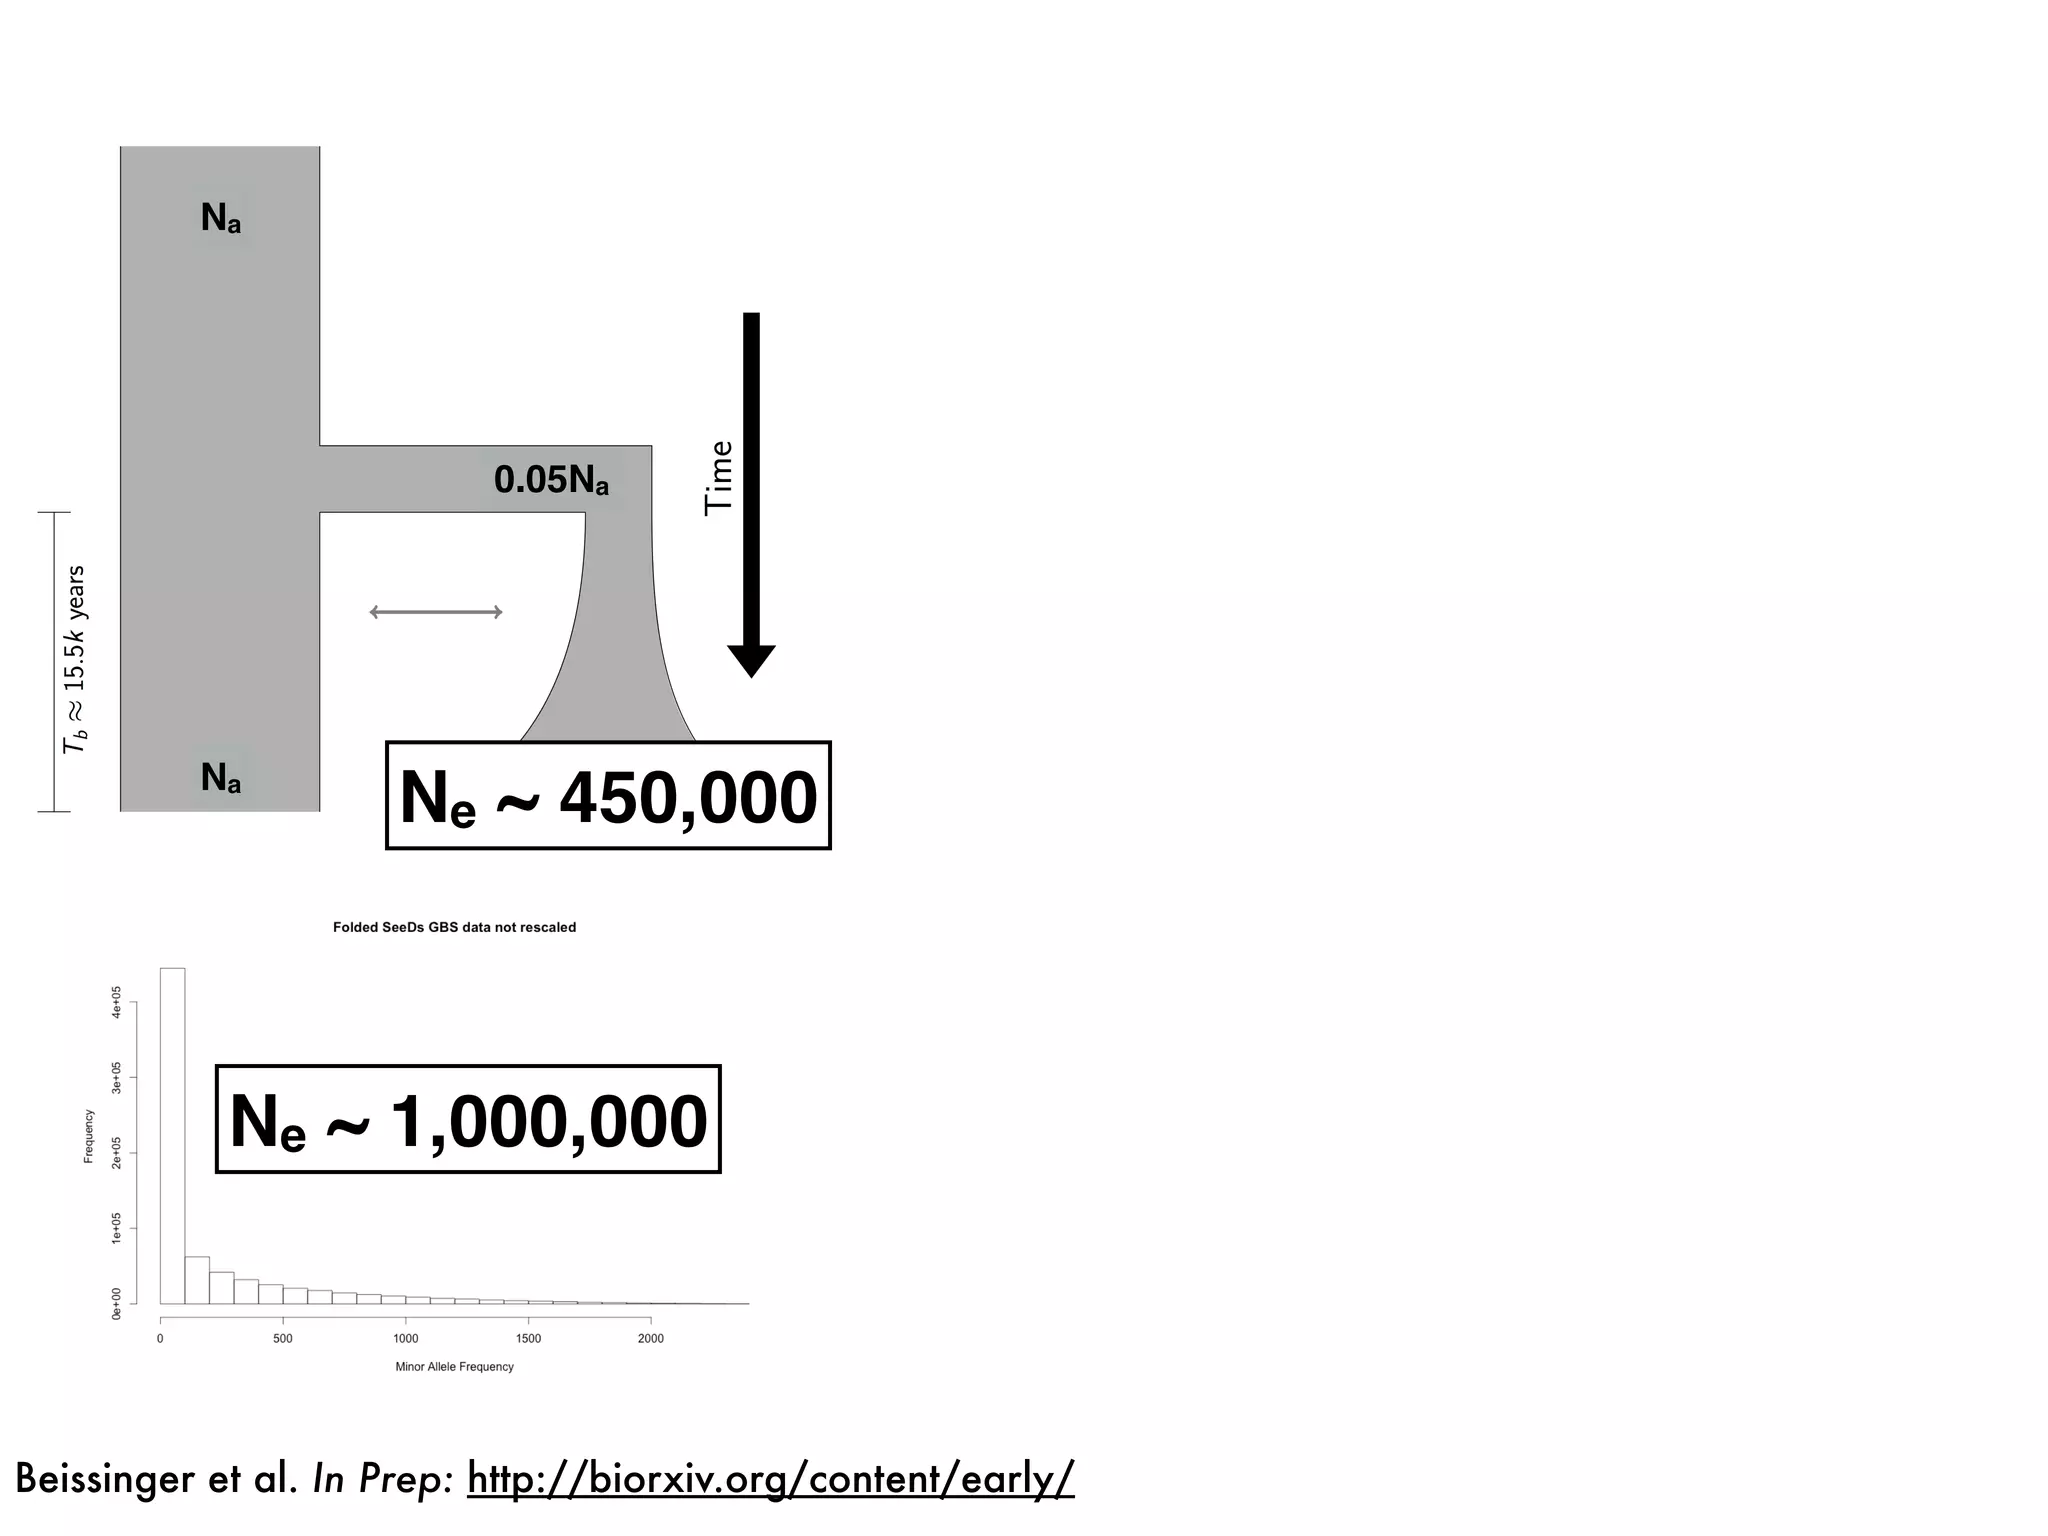
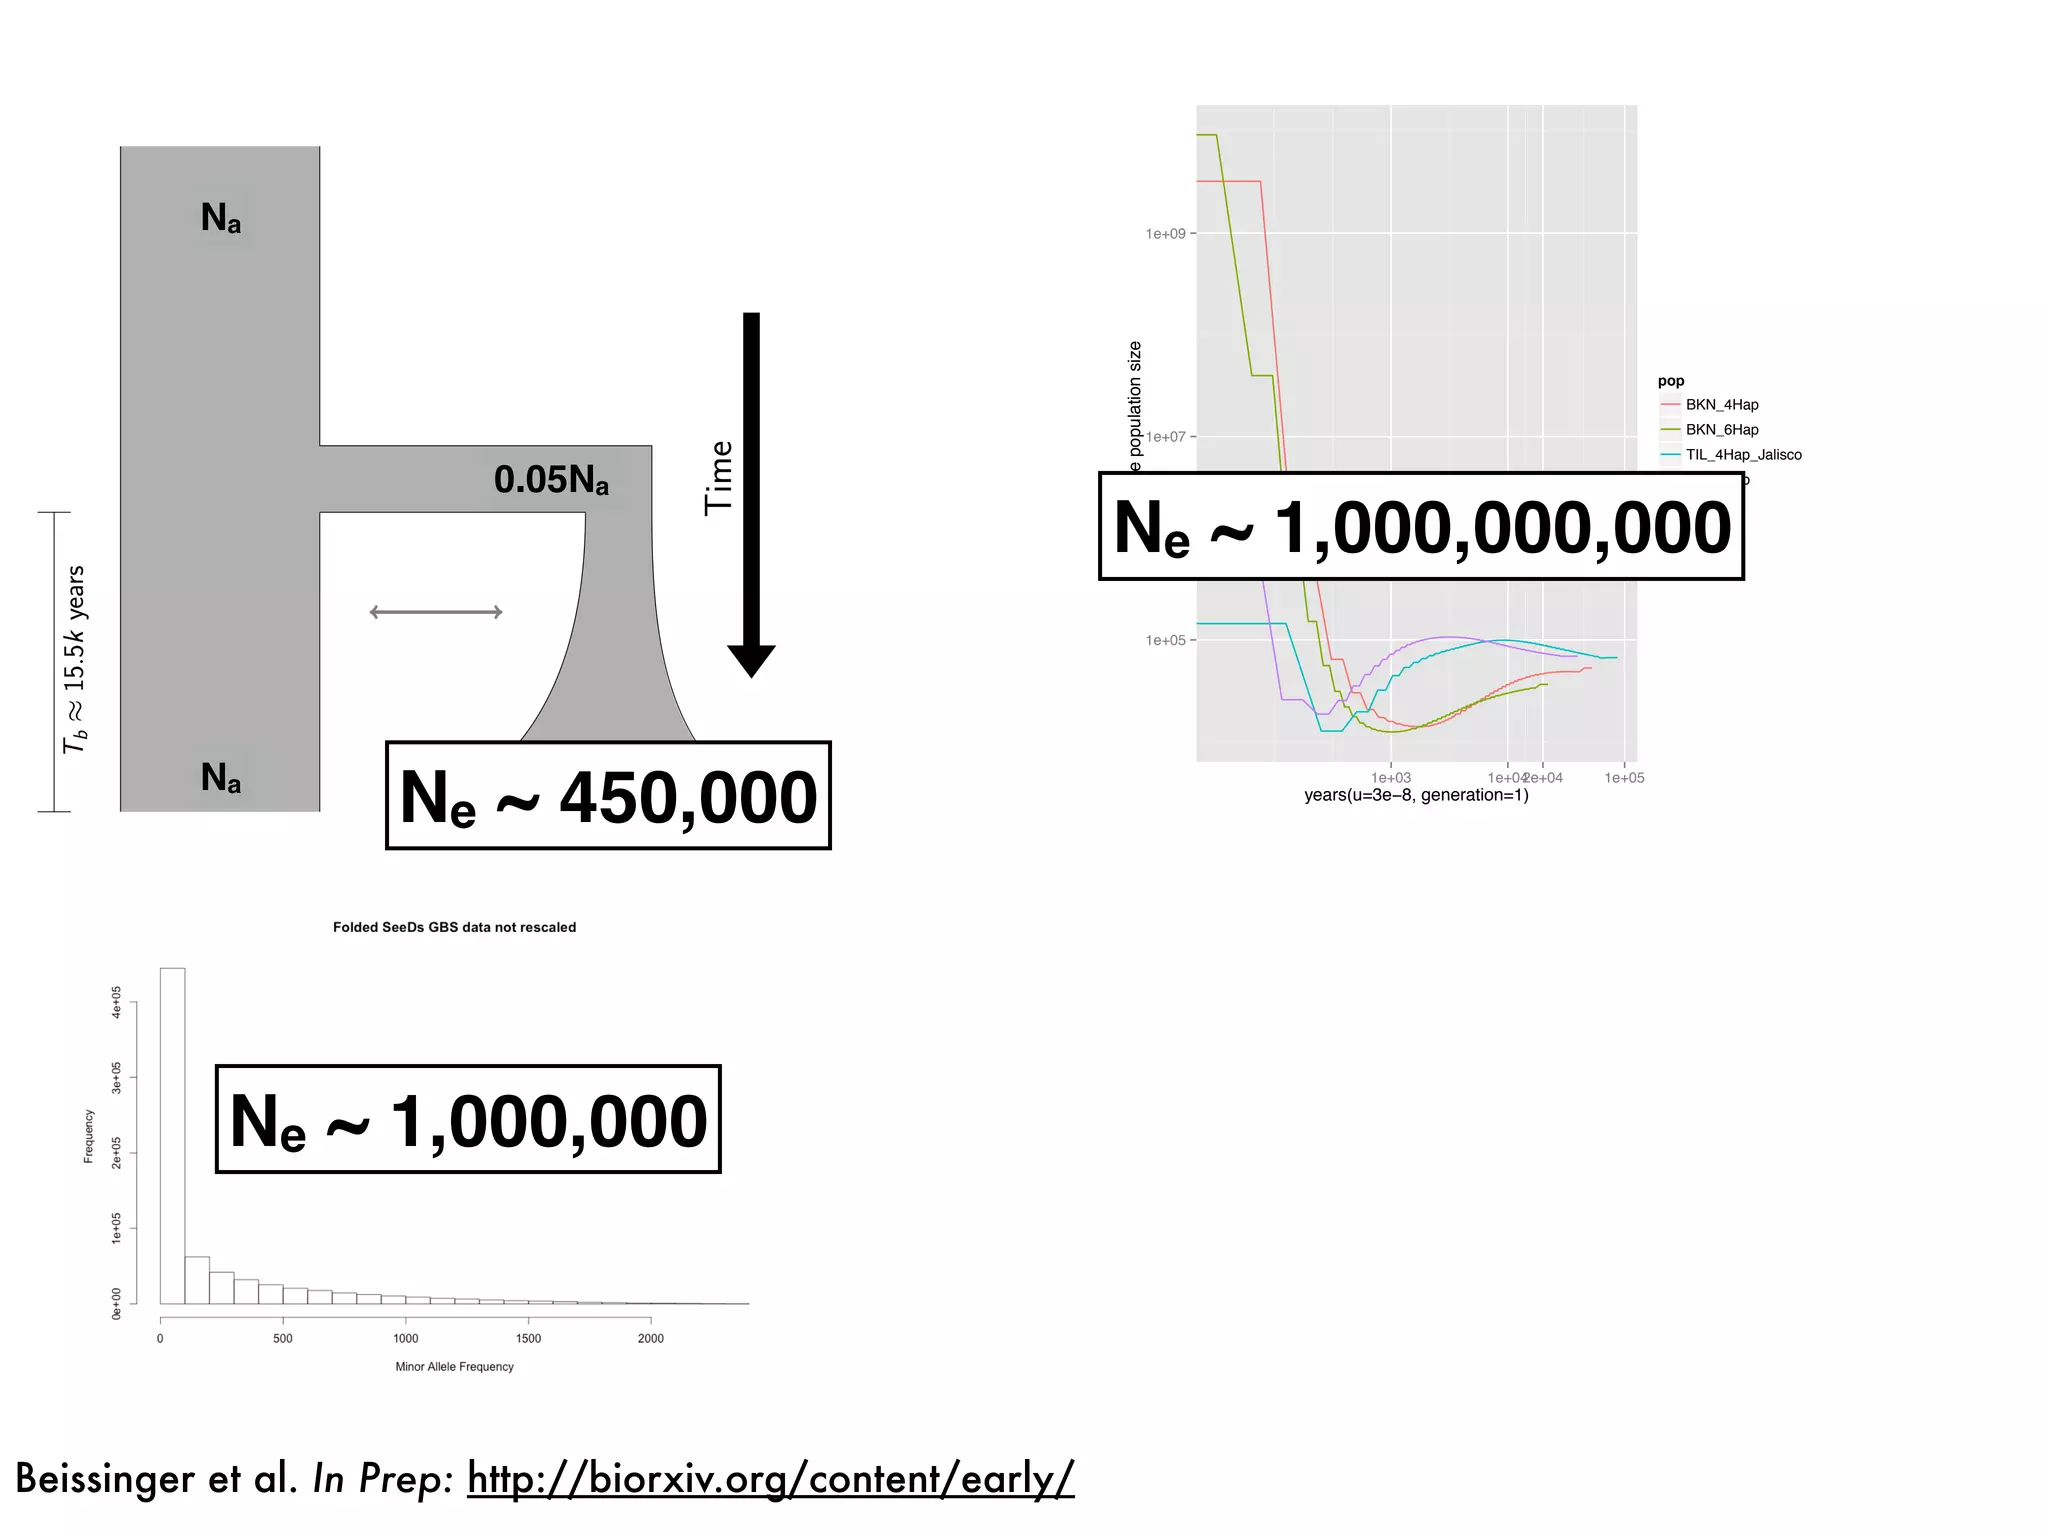
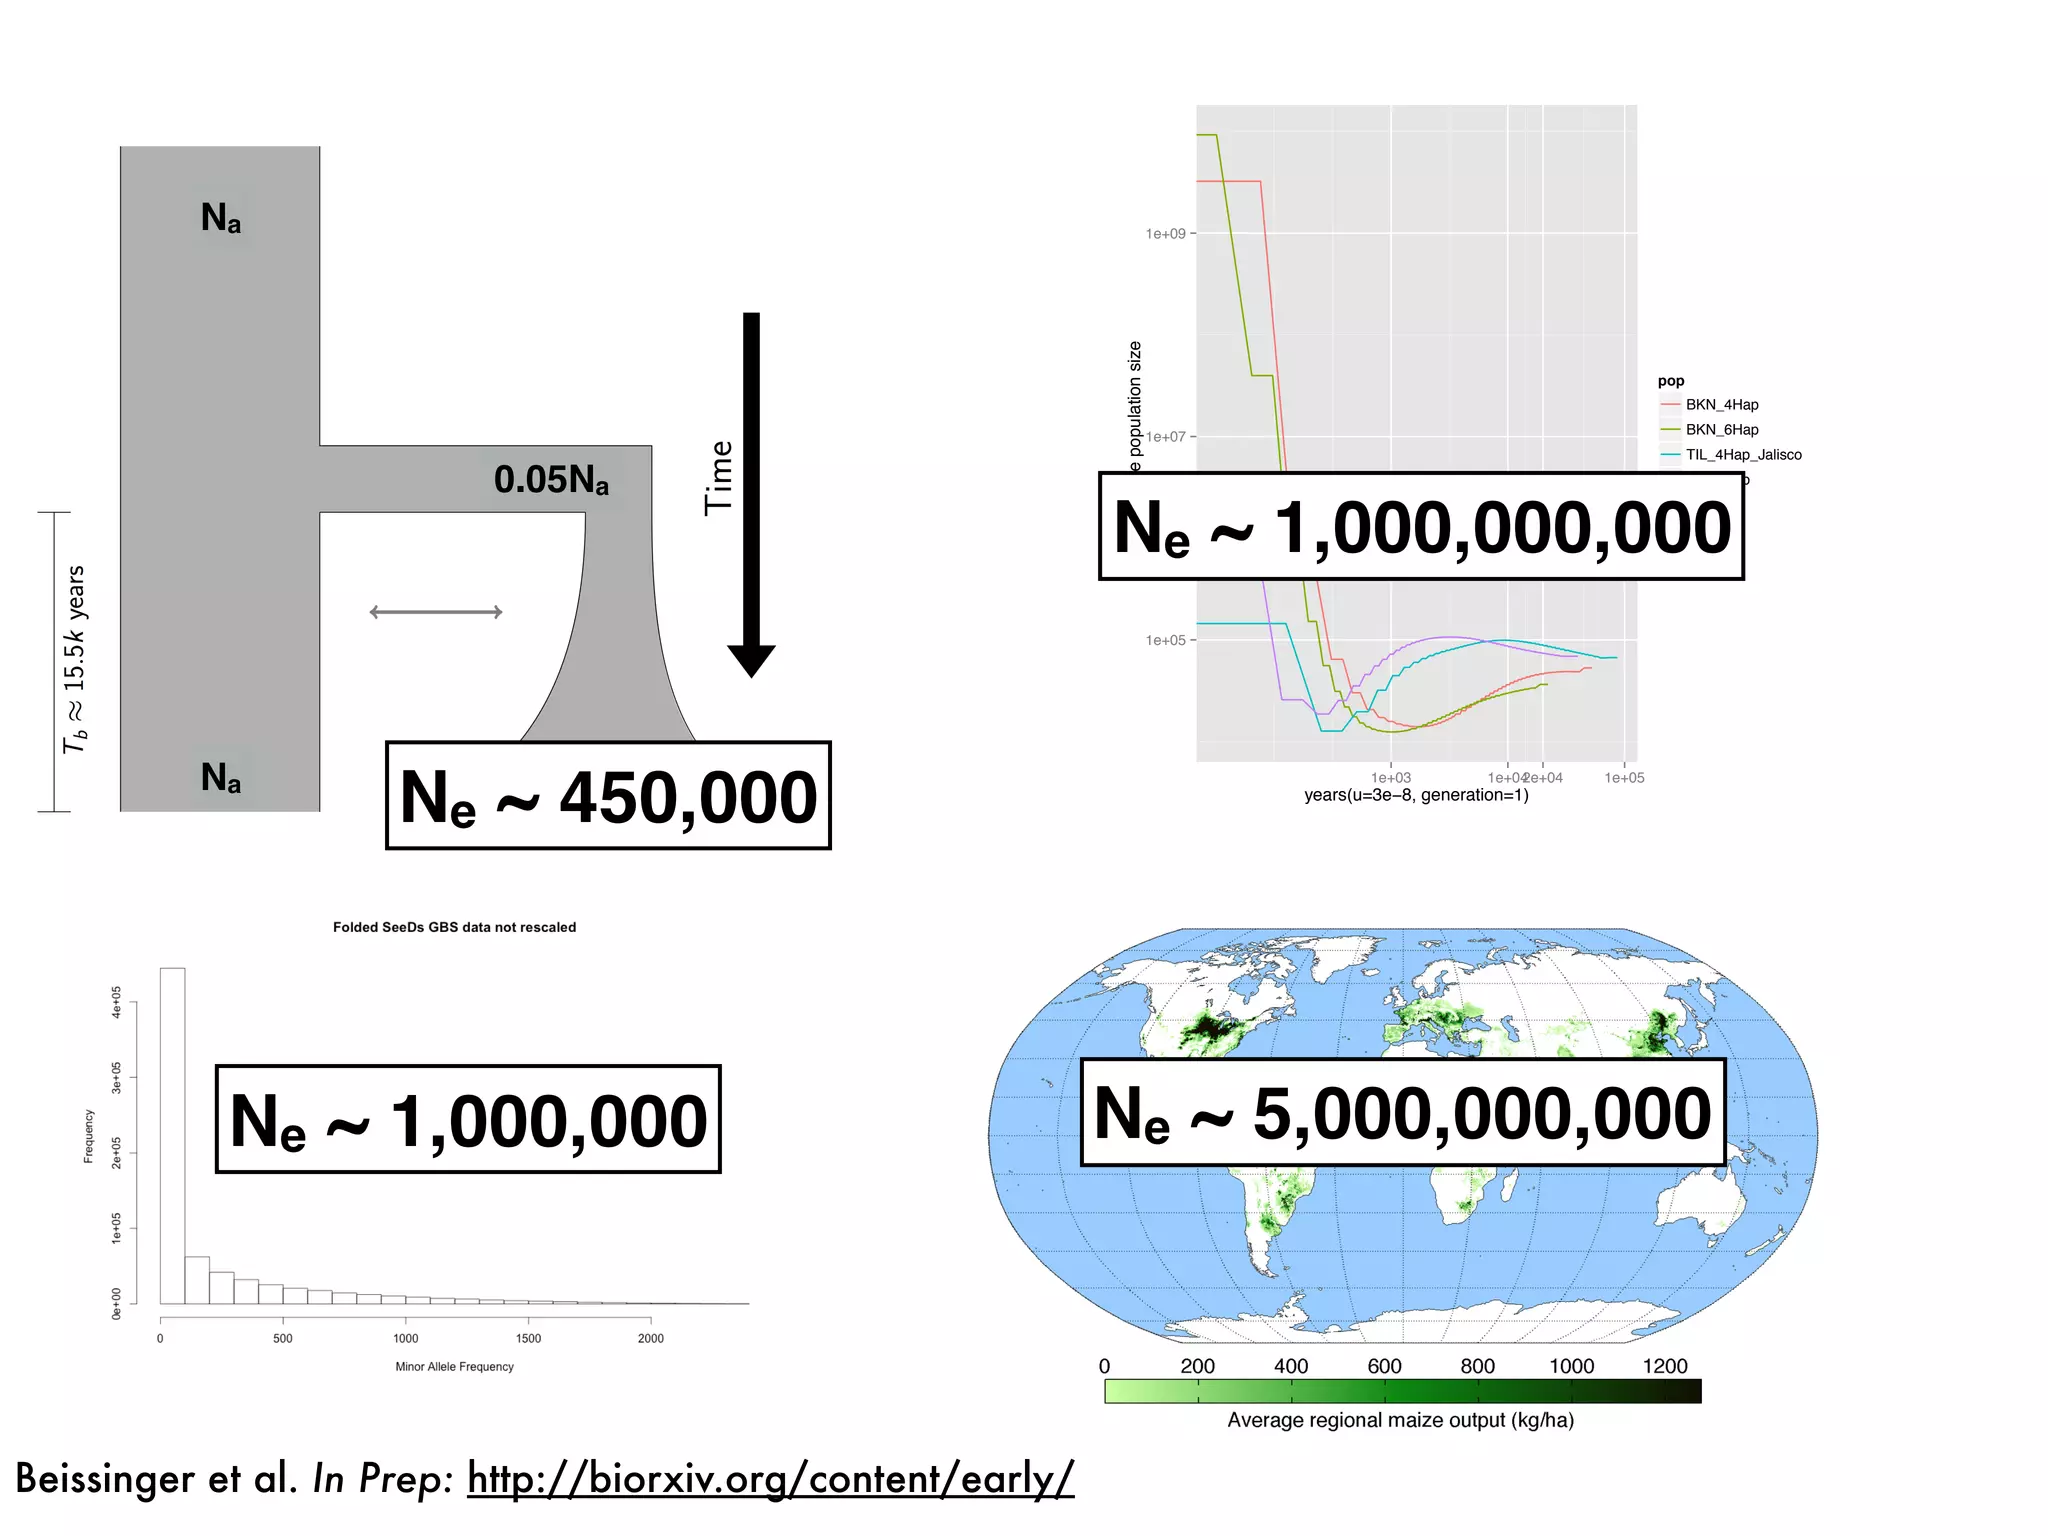
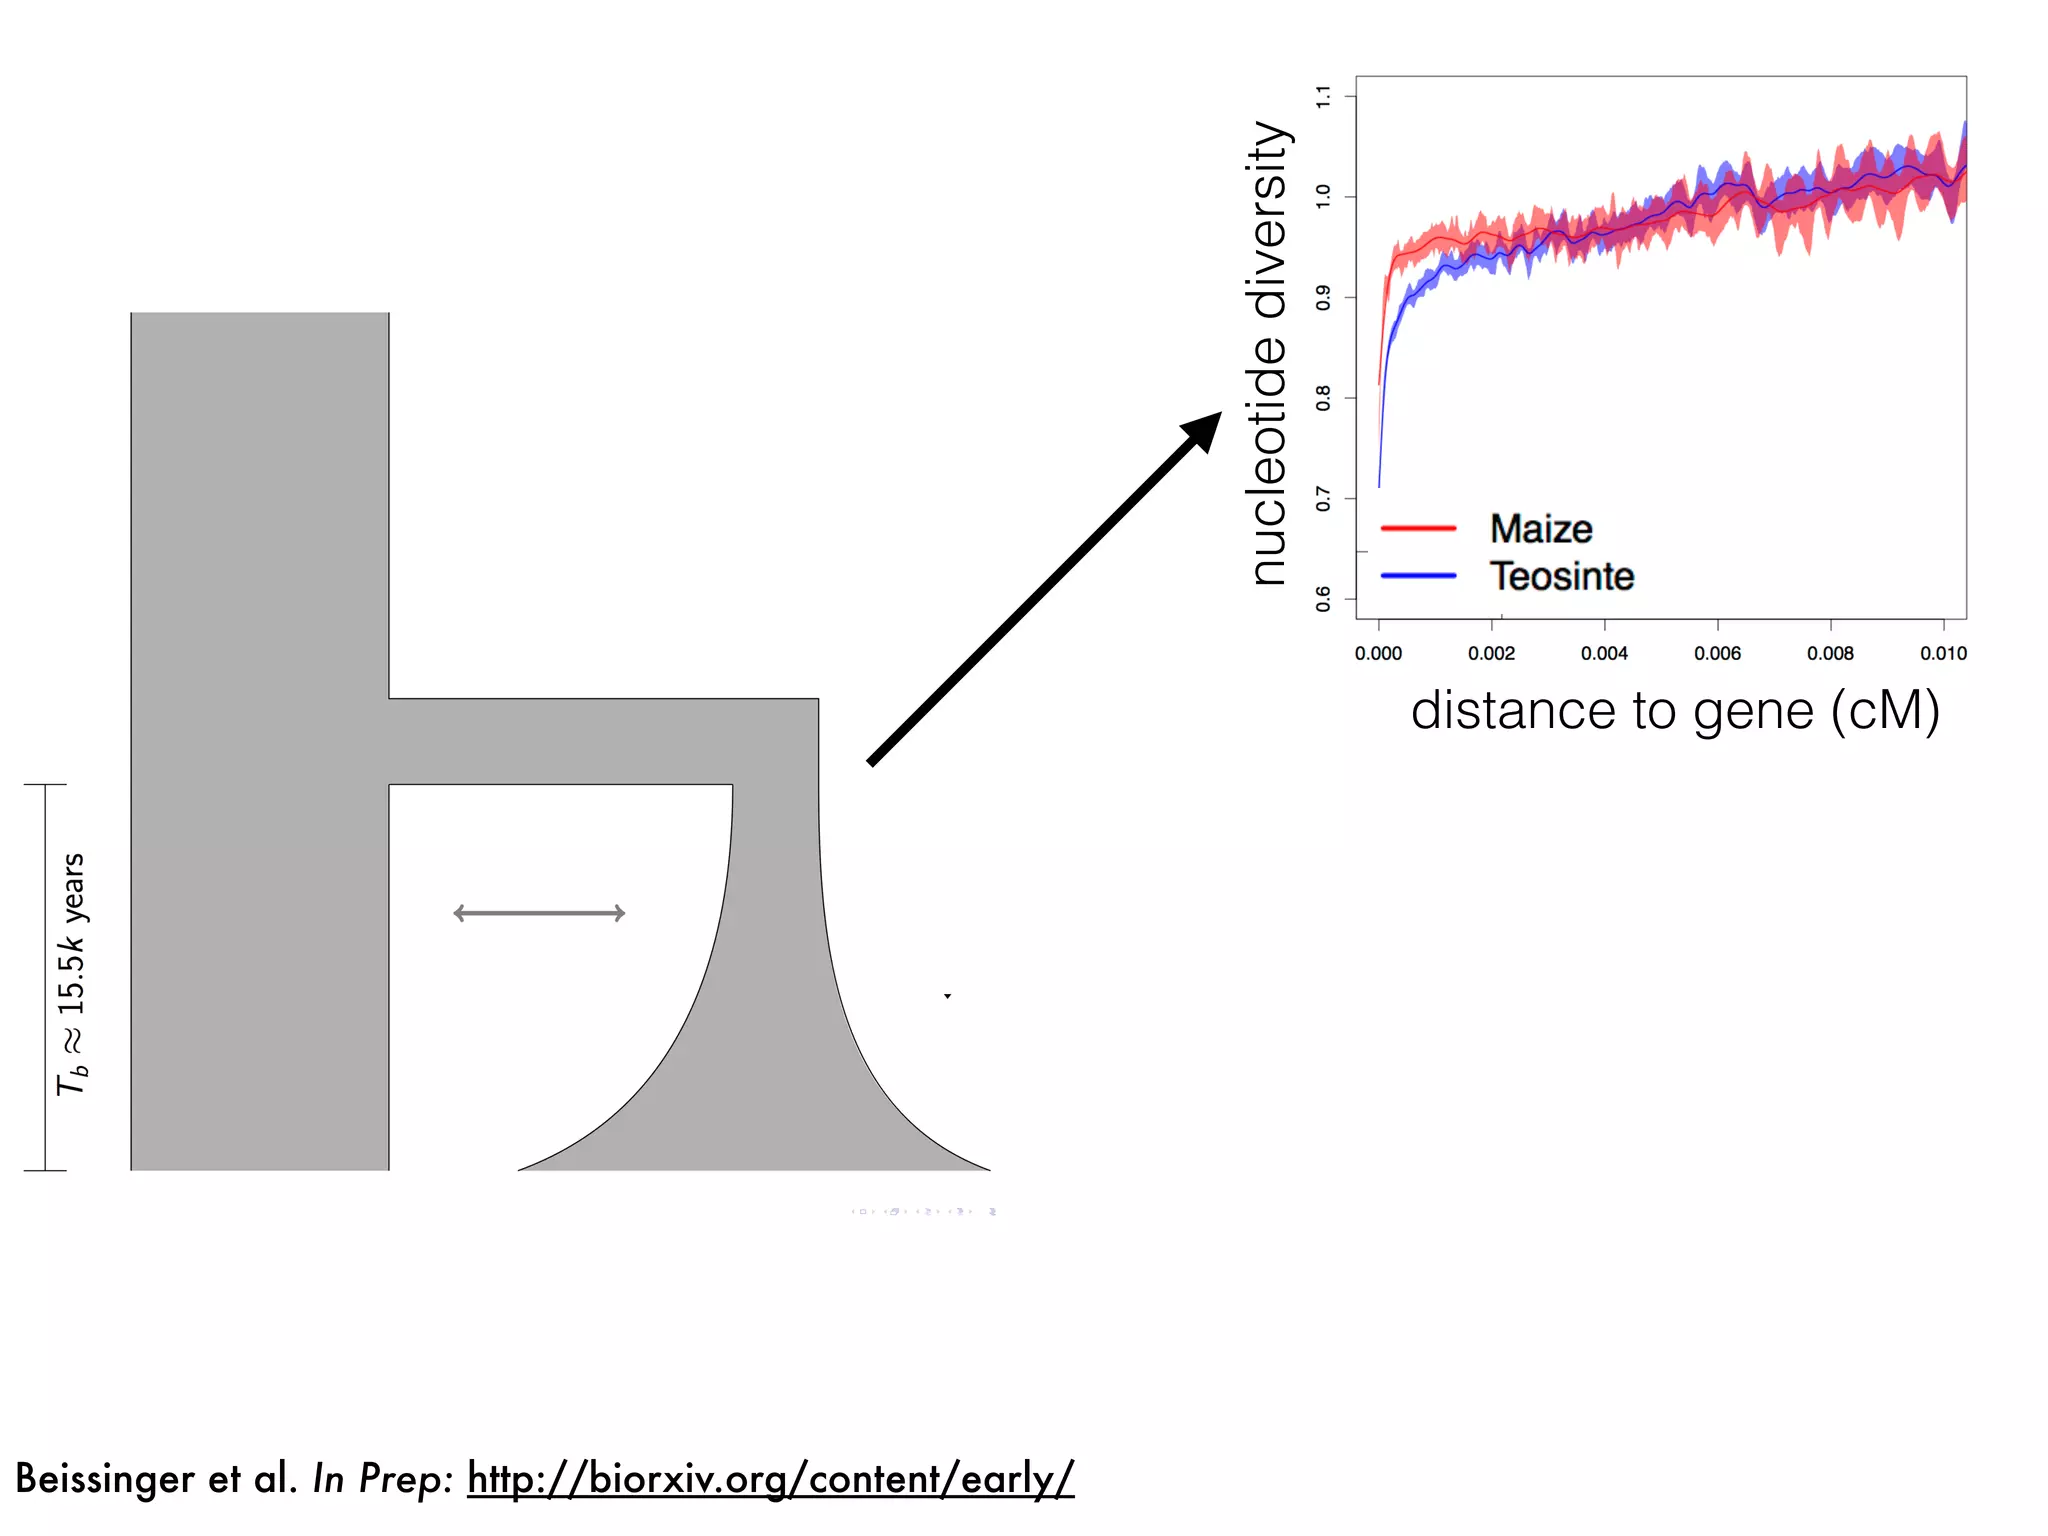
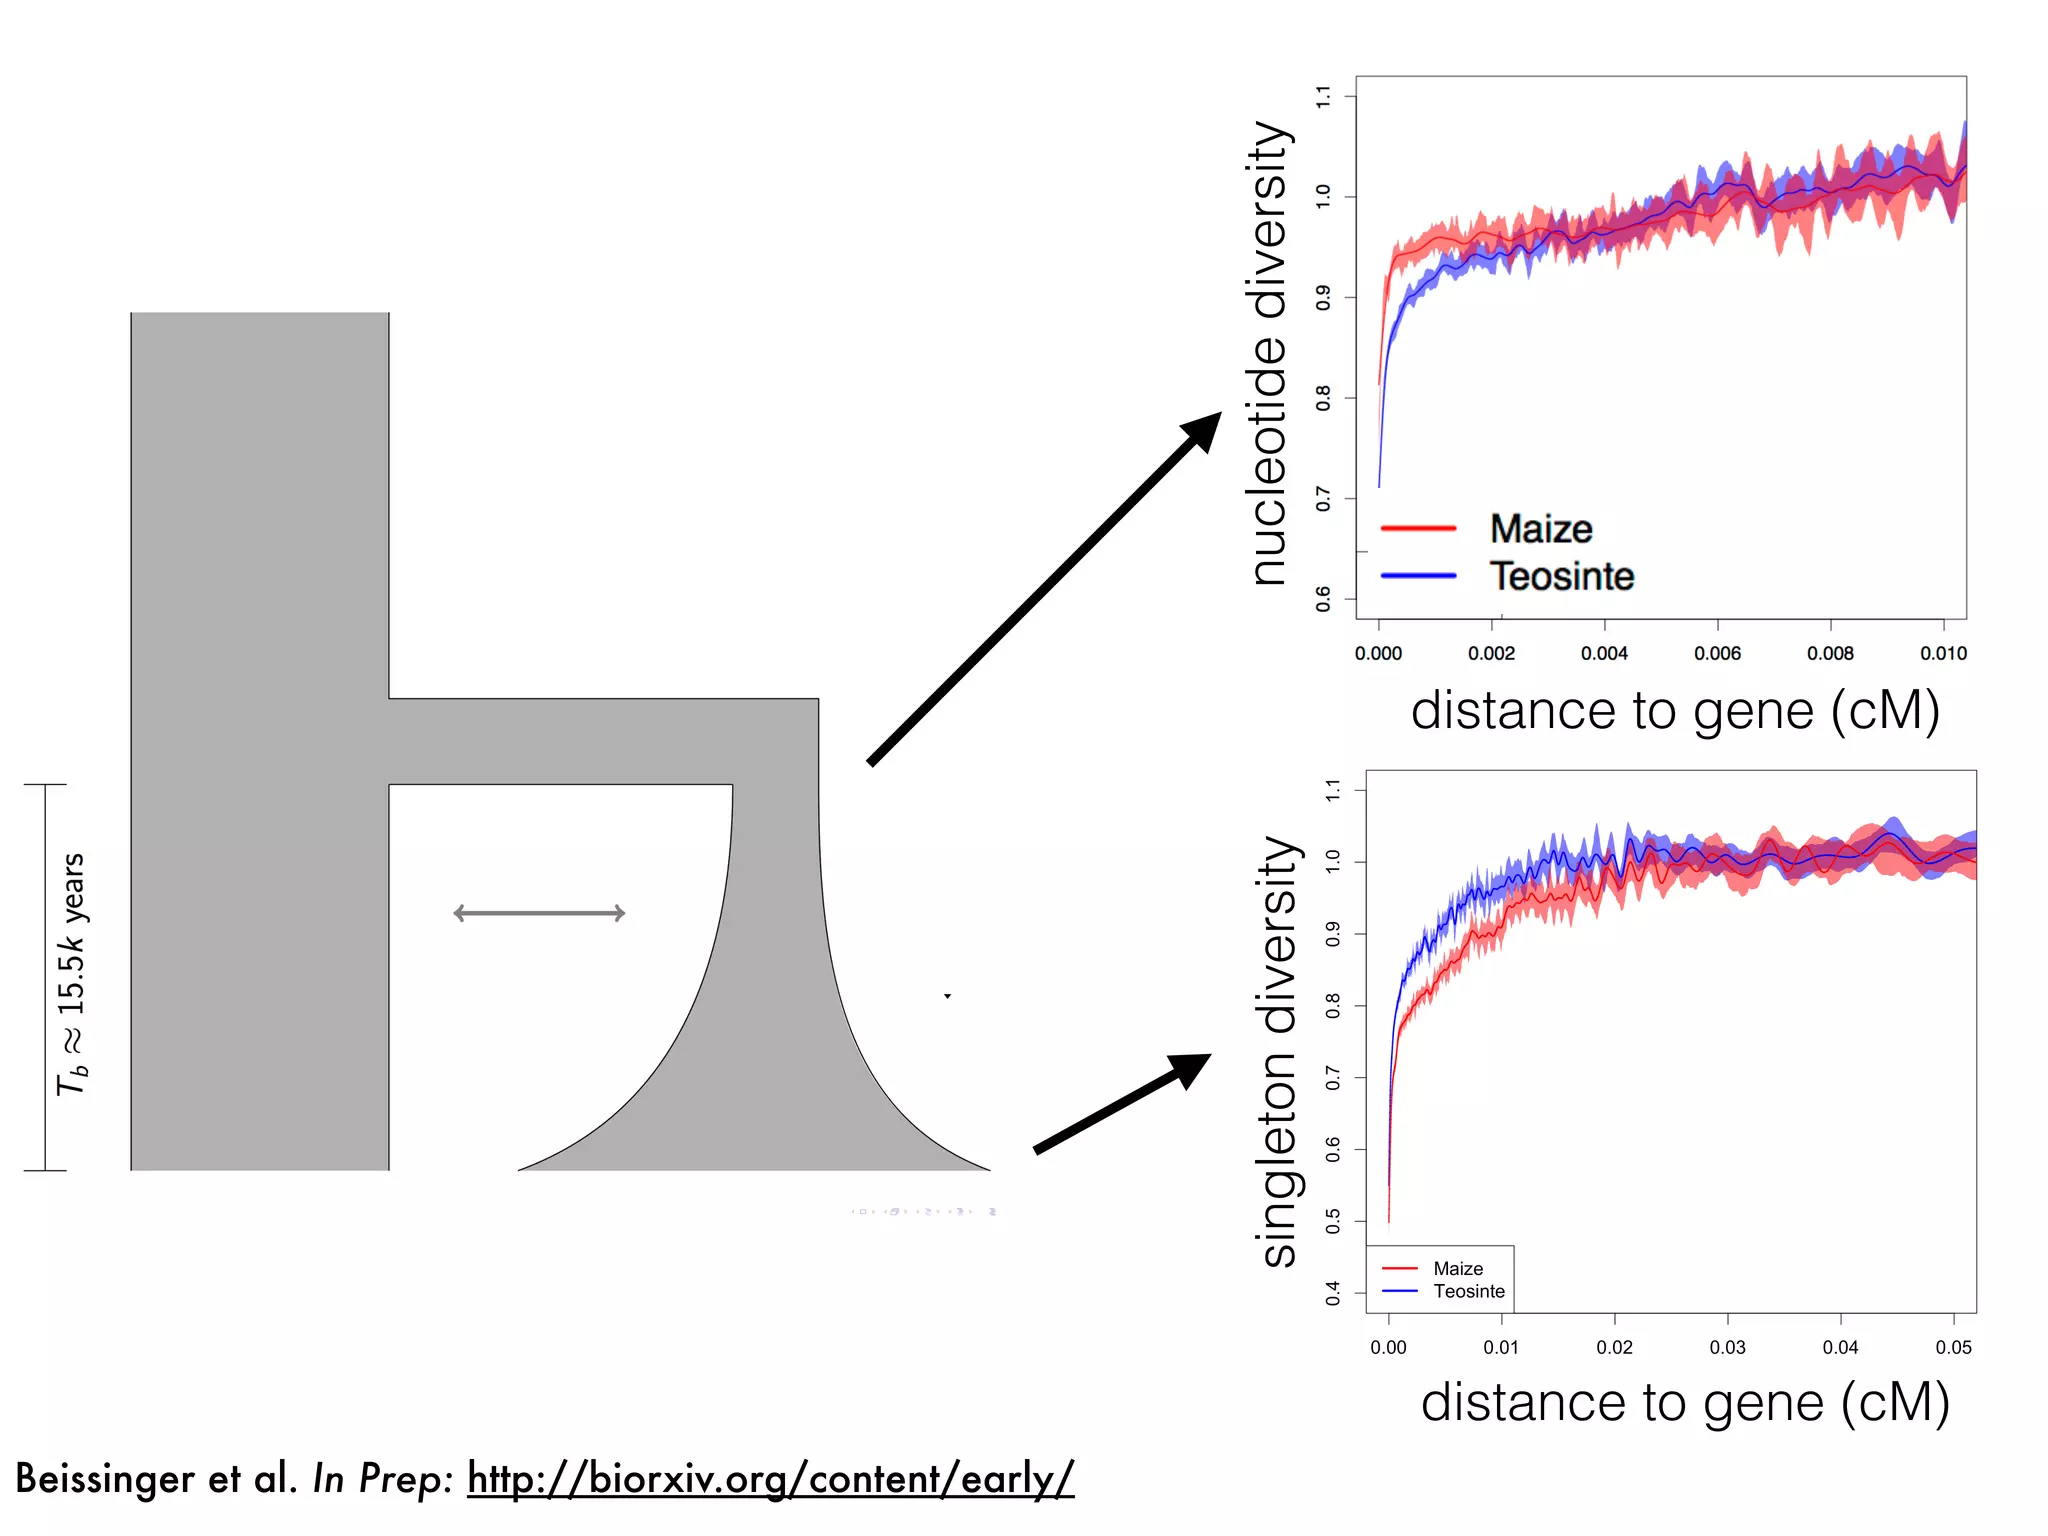
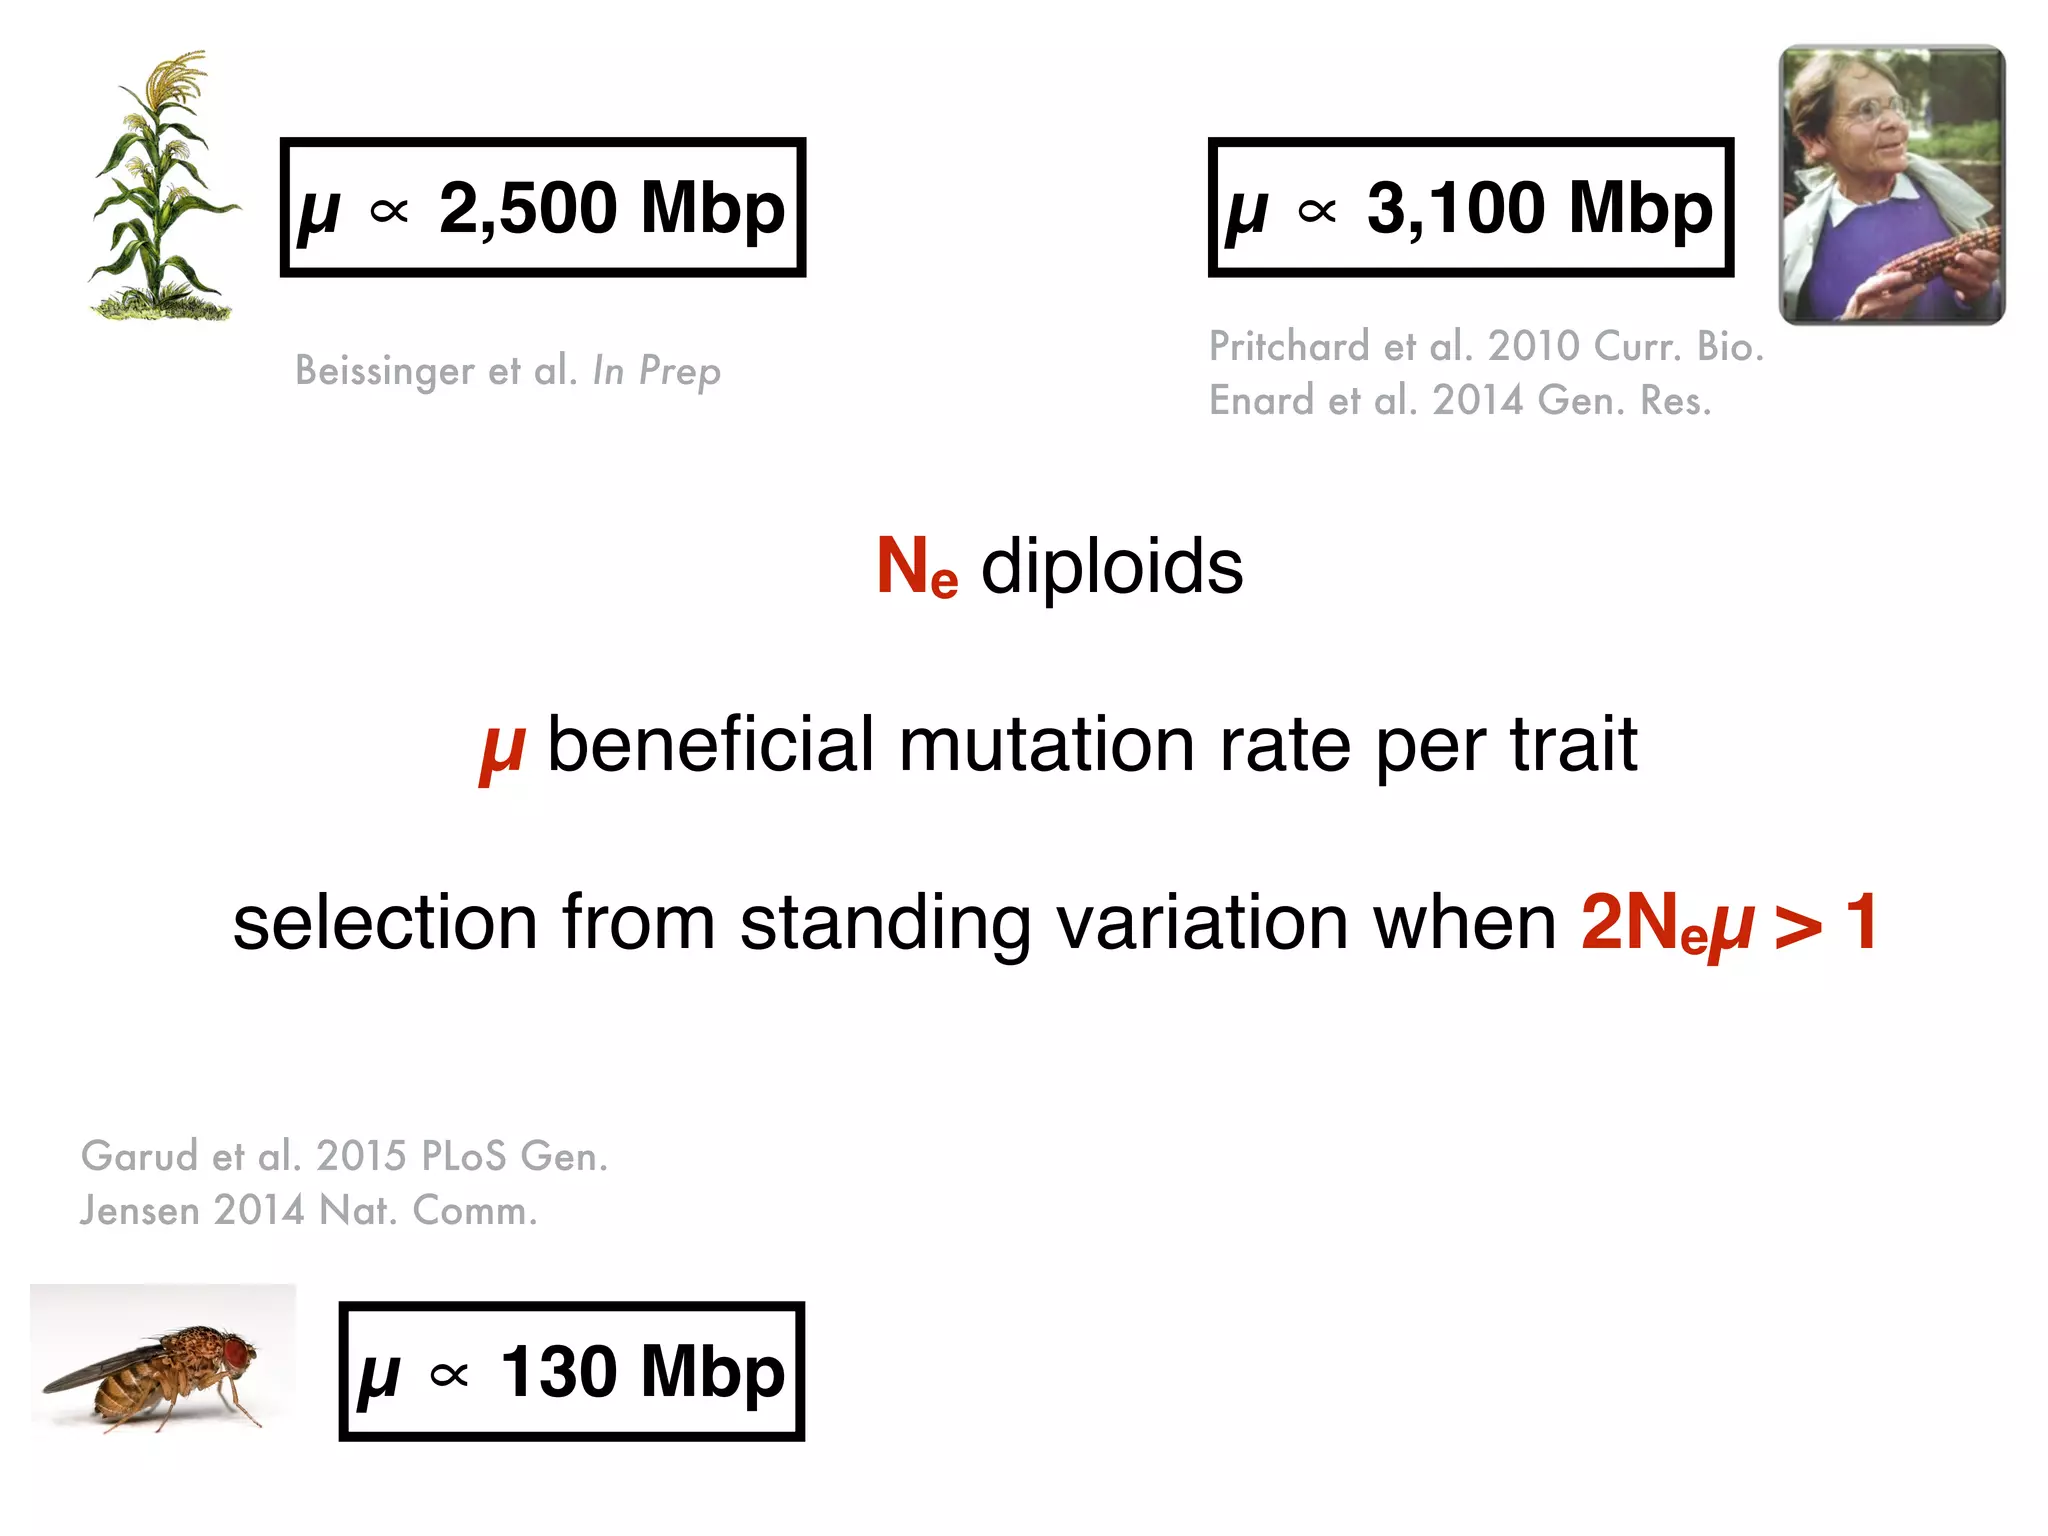
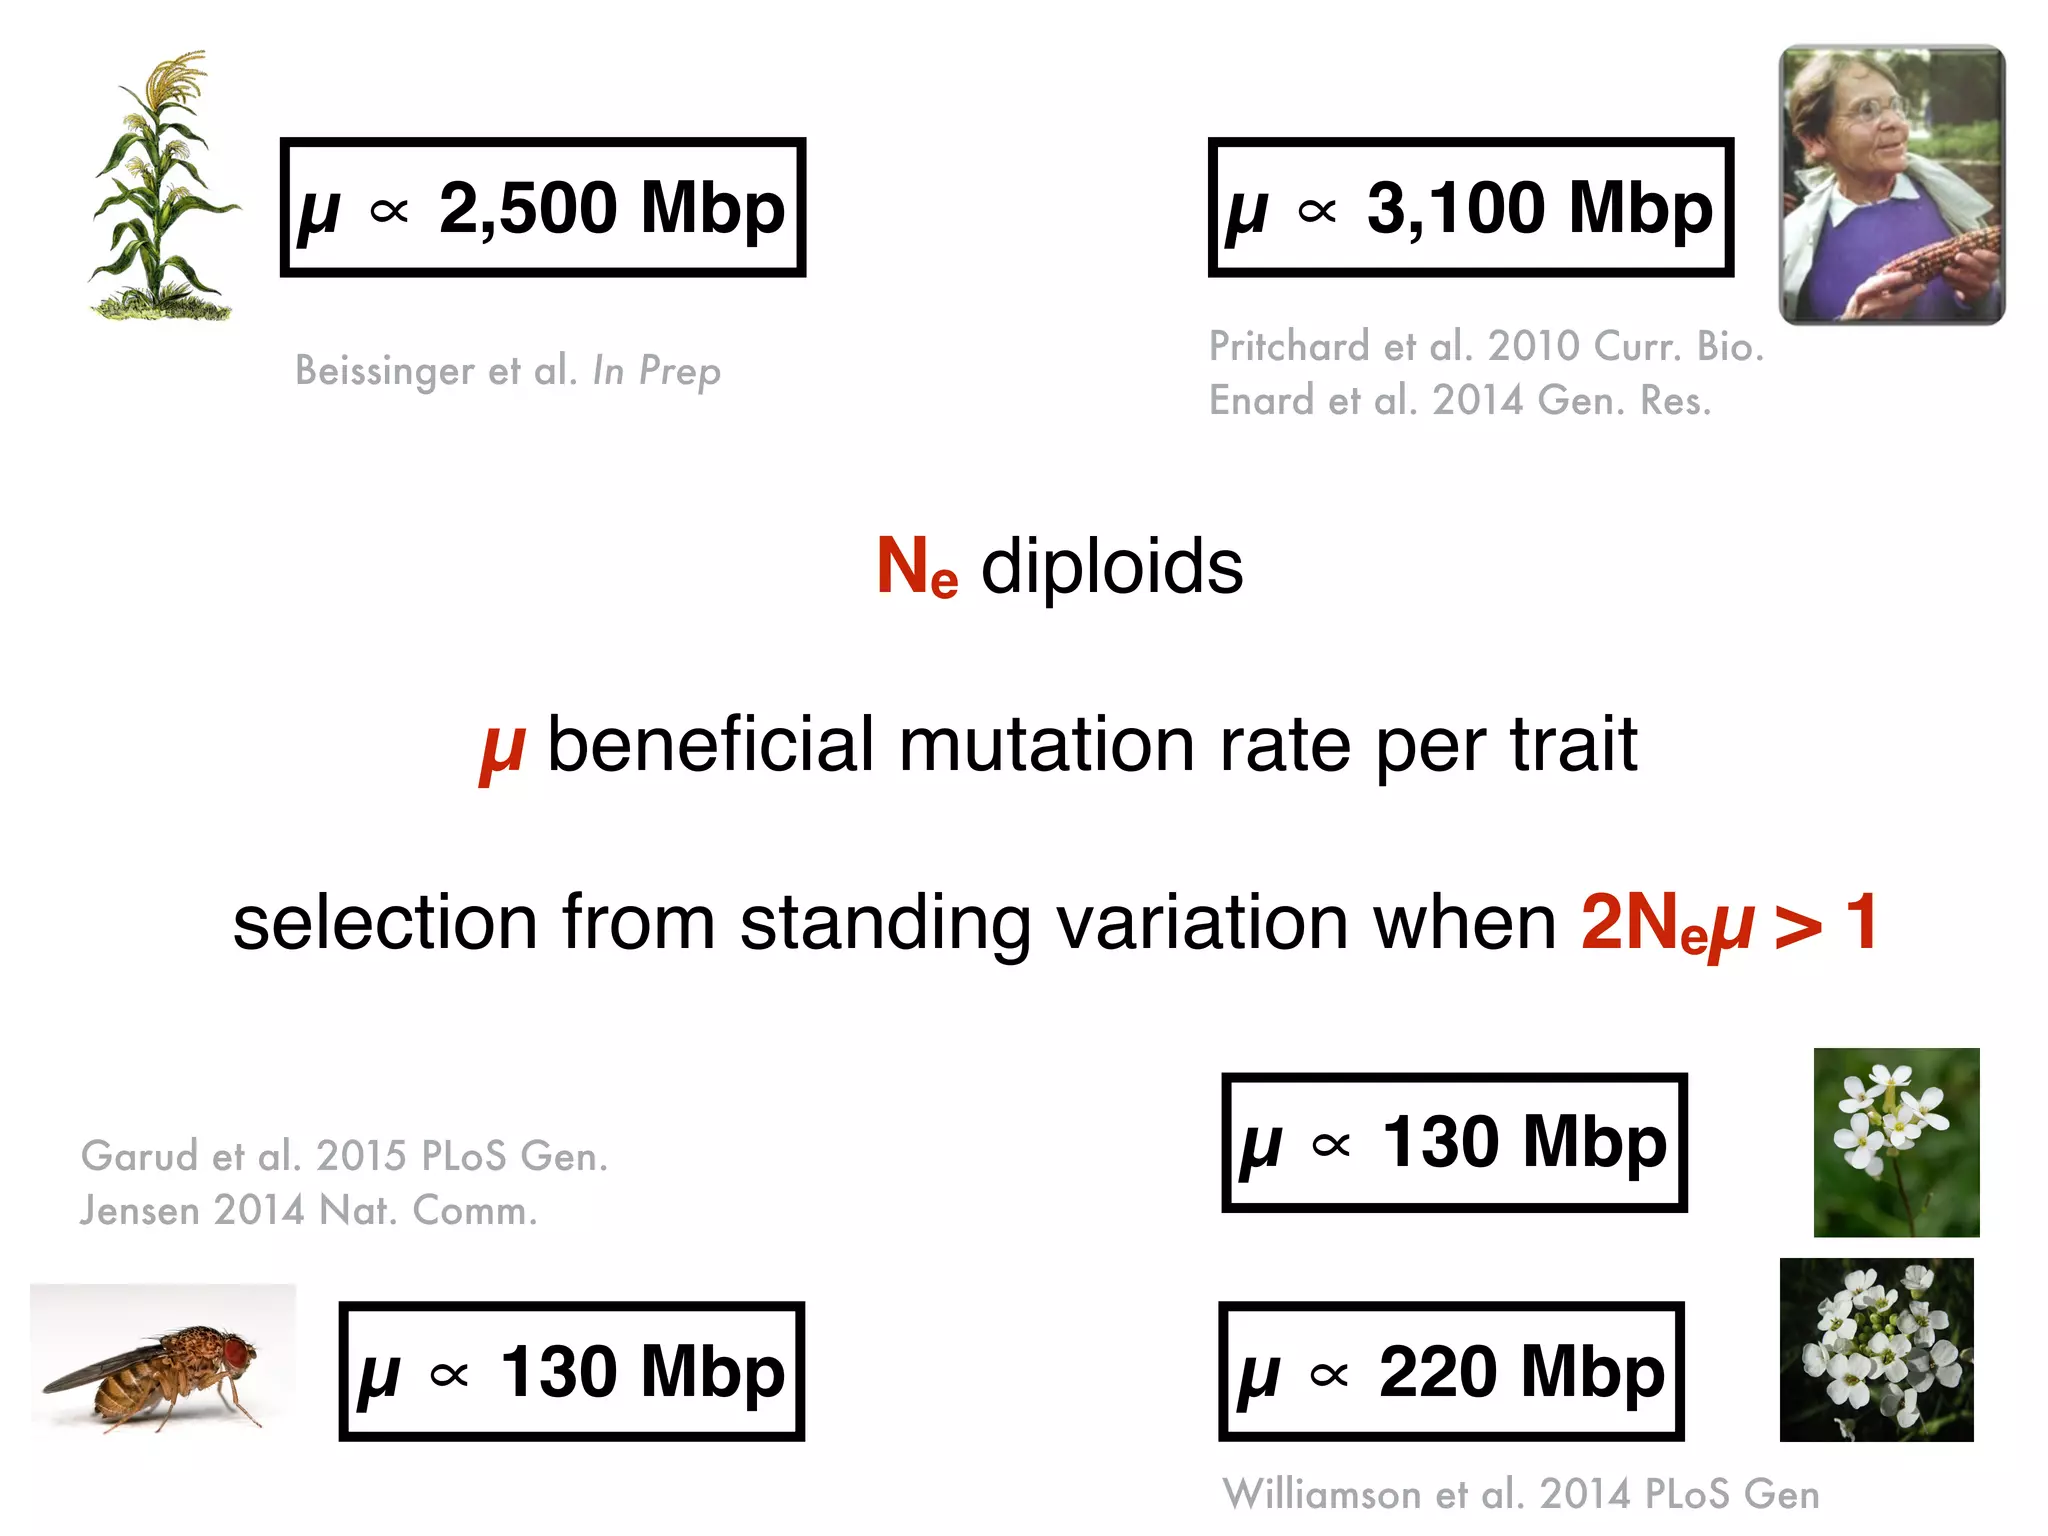
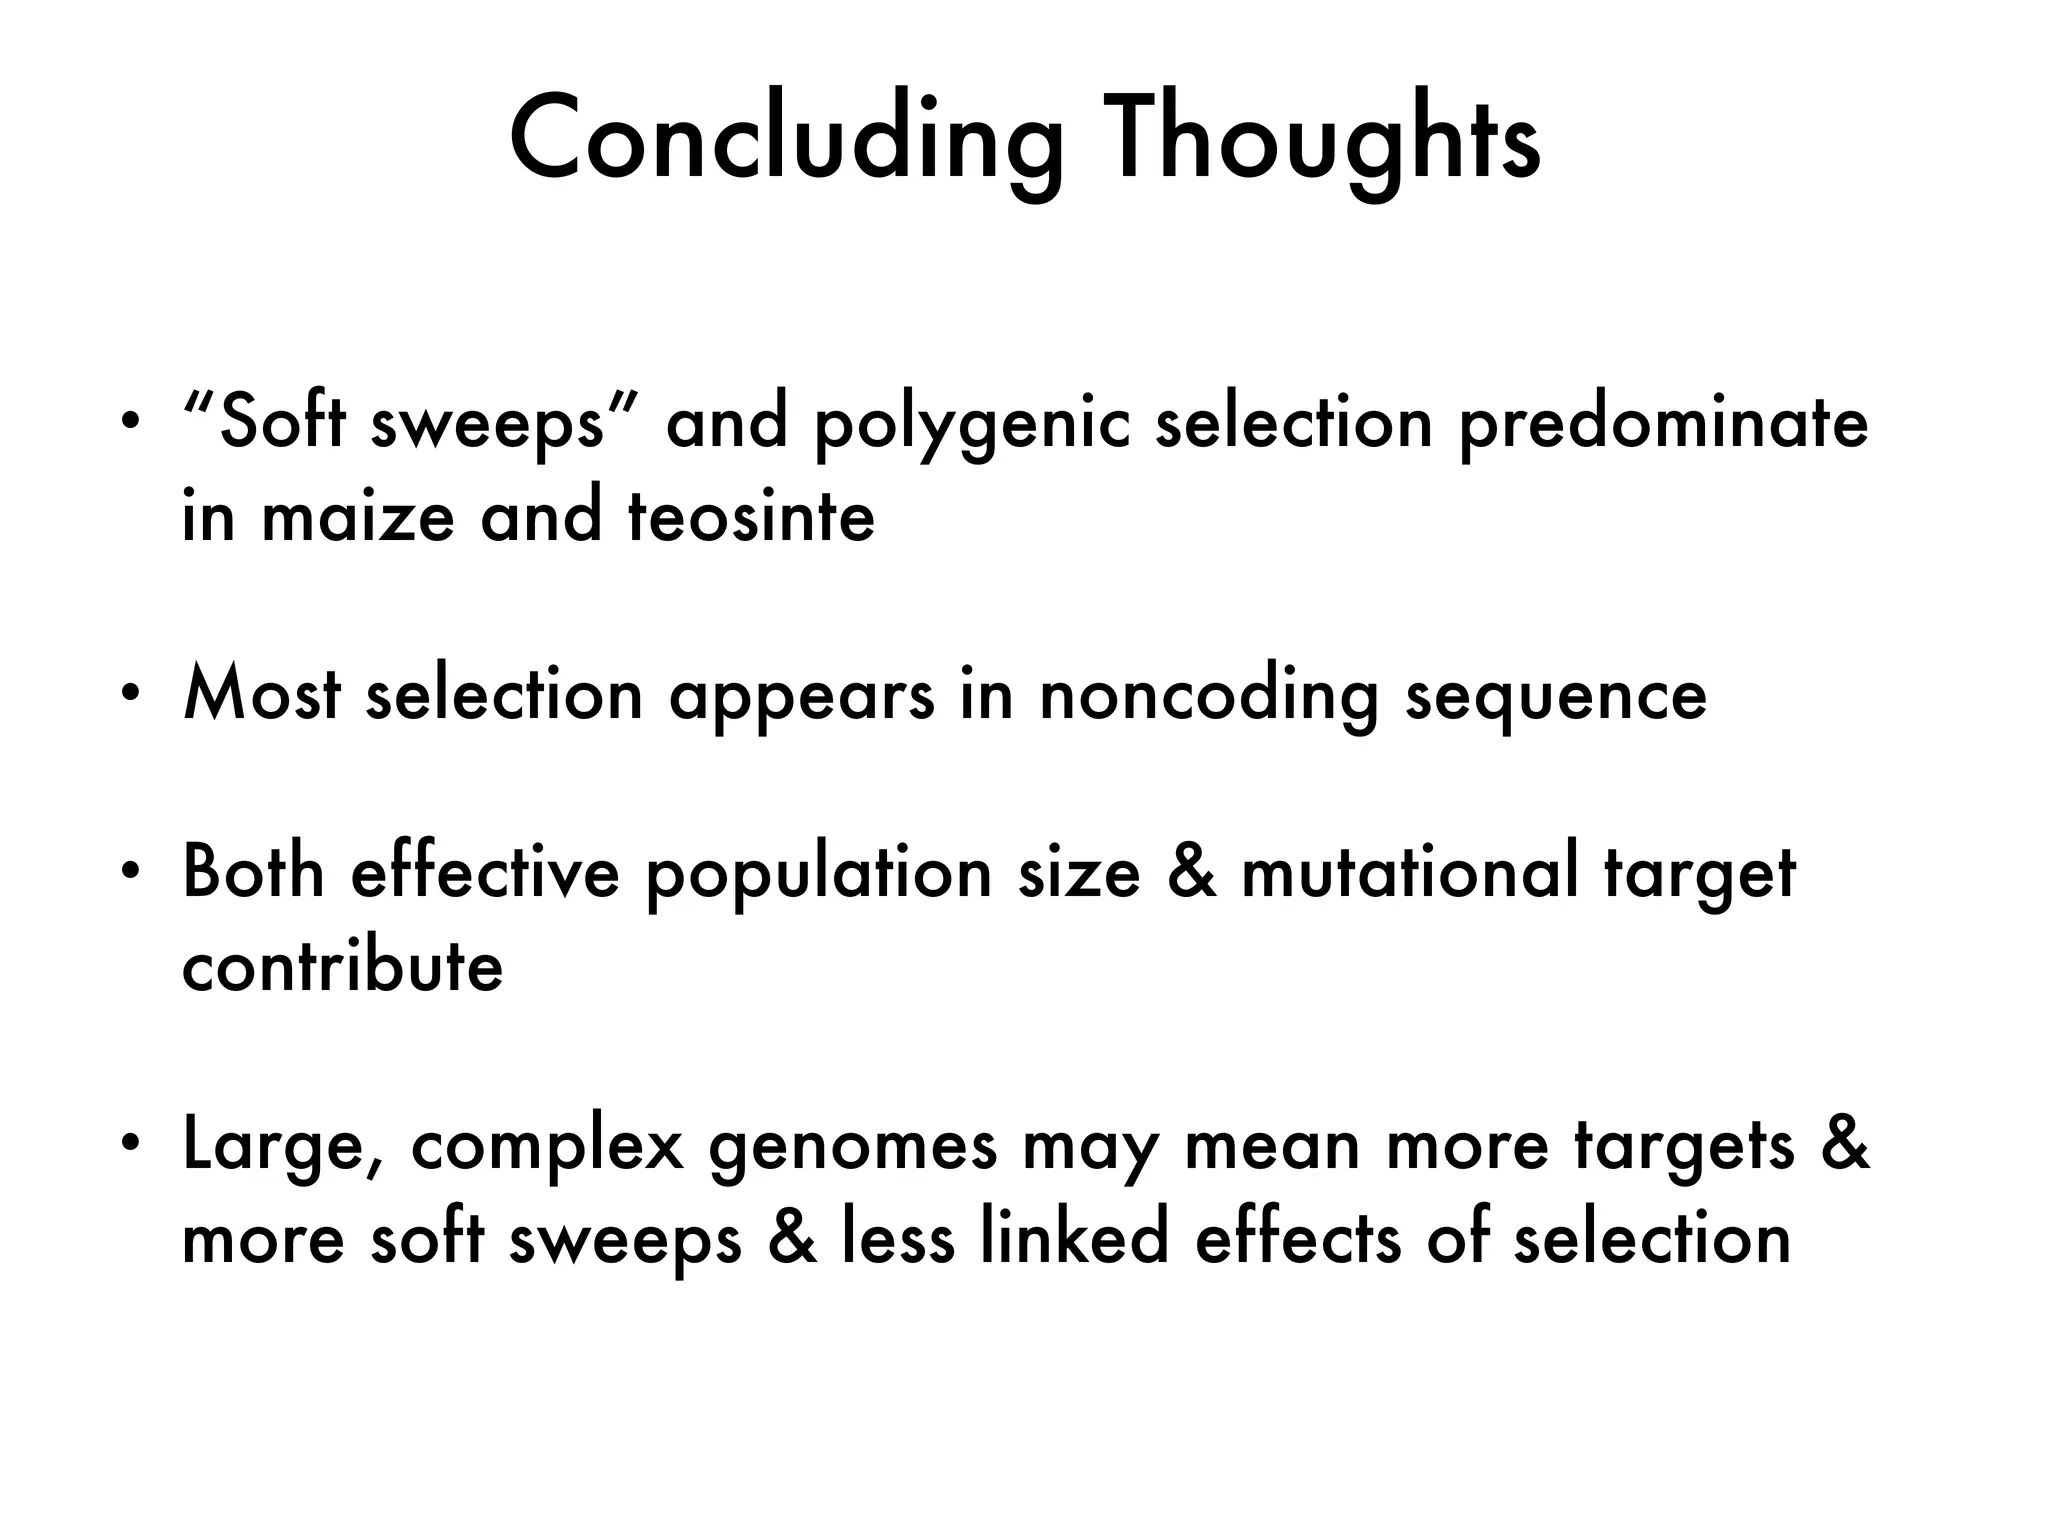
Selection and demography
in maize evolution
Jeffrey Ross-Ibarra
@jrossibarra • www.rilab.org
Dept. Plant Sciences • Center for Population Biology • Genome Center
University of California Davis
photo by lady_lbrty
Photos: Matt Hufford, Brandon Gaut, John Doebley
maizeteosinte
Suketoshi Taba
GeographicalBreadth
0
0.02
0.04
0.06
0.08
0.1
maize
potato
wheat
soybean
sorghum
barley
sunflower
rice
groundnut
rapeseed
cassava
millet
rye
sugarcane
oilpalm
sugarbeet
Hake & Ross-Ibarra 2015 eLife
hard sweep
Diversity
hard sweep
multiple
mutations
Diversity
standing
variation
“soft” sweeps
hard sweep
multiple
mutations polygenic adaptation
Diversity
standing
variation
“soft” sweeps
M T G P H R L
GGTCGAC ATG ACT GGT CCA CAT CGA CTG TAG
M T G P H R L
GGTCGAC ATG ACT GGT CCA CAT CGA CTG TAG
M T N P H R L
GGTCGAC ATG ACT GAT CCA CAT CGA CTG TAG
M T G P H R L
GGTAAAC ATG ACT GGT CCA CAT CGA CTG TAG
GG—-AC ATG ACT GGT CCA CAT CGA CTG TAG
maize origins
TripsacumF1
teosinte
(Z. mays ssp. parviglumis)
maize
(Z. mays ssp. mays)
F1
Beadle 1979 Field Museum of Nat. Hist. Bull.
F1
Beadle 1979 Field Museum of Nat. Hist. Bull.
F1
Beadle 1979 Field Museum of Nat. Hist. Bull.
F1
Beadle 1979 Field Museum of Nat. Hist. Bull.
Briggs et al. 2007 Genetics
1 2 3 4 5
6 7 8 9 10
Wang et al. 2005 Nature
1 2 3 4 5
6 7 8 9 10
Figure 1.
Phenotypes. a. Maize ear showing the cob (cb) exposed at top. b. Teosinte e
internode (in) and glume (gl) labeled. c. Teosinte ear from a plant with a m
introgressed into it. d. Close-up of a single teosinte fruitcase. e. Close-up o
teosinte plant with a maize allele of tga1 introgressed into it. f. Ear of maiz
(Tga1-maize allele) with the cob exposed showing the small white glumes a
of maize inbred W22:tga1 which carries the teosinte allele, showing enlarge
h. Ear of maize inbred W22 carrying the tga1-ems1 allele, showing enlarged g
NIH-PAAuthorManuscriptNIH-PAAuthorManuscriptNIH-P
tga1
Wang et al. 2015 Genetics
1 2 3 4 5
6 7 8 9 10
gt1 tga1
Wills et al. 2013 PLoS Genetics
1 2 3 4 5
6 7 8 9 10
gt1 tga1
Wills et al. 2013 PLoS Genetics
teosinte maize
Clint Whipple, BYU
1 2 3 4 5
6 7 8 9 10
gt1 tga1
Wills et al. 2013 PLoS Genetics
1 2 3 4 5
6 7 8 9 10
gt1 tga1
Wills et al. 2013 PLoS Genetics
5’ control region 3’ UTR
1 2 3 4 5
6 7 8 9 10
tb1
Studer et al. 2011 Nat. Gen.; Vann et al. 2015 PeerJ
tga1gt1
1 2 3 4 5
6 7 8 9 10
tb1
Studer et al. 2011 Nat. Gen.; Vann et al. 2015 PeerJ
tga1
GENETICS ADVANCE ONLINE PUBLICATION 3
nguish maize and teosinte. Both the maize and teosinte
s for the distal component repressed luciferase expression
luc
luc
luc
luc
luc
luc
Hopscotch
mpCaMV
M-dist
T-prox
M-prox
0 0.5 1.0 1.5 2.0
∆M-dist
∆M-prox
ProximalcontrolregionDistal
Constructs and corresponding normalized luciferase expression
nsient assays were performed in maize leaf protoplast. Each
is drawn to scale. The construct backbone consists of the
romoter from the cauliflower mosaic virus (mpCaMV, gray box),
ORF (luc, white box) and the nopaline synthase terminator
). Portions of the proximal and distal components of the
gion (hatched boxes) from maize and teosinte were cloned
ction sites upstream of the minimal promoter. “ ” denotes
on of either the Tourist or Hopscotch element from the maize
Horizontal green bars show the normalized mean with s.e.m.
onstruct.
relative expressionconstruct
gt1
1 2 3 4 5
6 7 8 9 10
tb1
Figure 2 Map of parviglumis Populations and Hopscotch allele frequency. Map showing the frequency
of the Hopscotch allele in populations of parviglumis where we sampled more than 6 individuals. Size of
circles reflects number of individuals sampled. The Balsas River is shown, as the Balsas River Basin is
believed to be the center of domestication of maize.
as our independent trait for phenotyping analyses. SAS code used for analysis is available at
http://dx.doi.org/10.6084/m9.figshare.1166630.
RESULTS
Genotyping for the Hopscotch insertion
The genotype at the Hopscotch insertion was confirmed with two PCRs for 837 individuals
of the 1,100 screened (Table S1 and Table S2). Among the 247 maize landrace accessions
genotyped, all but eight were homozygous for the presence of the insertion Within
our parviglumis and mexicana samples we found the Hopscotch insertion segregating
in 37 (n = 86) and four (n = 17) populations, respectively, and at highest frequency
within populations in the states of Jalisco, Colima, and Michoac´an in central-western
Mexico (Fig. 2). Using our Hopscotch genotyping, we calculated diVerentiation between
populations (FST) and subspecies (FCT) for populations in which we sampled sixteen
or more chromosomes. We found that FCT = 0, and levels of FST among populations
within each subspecies (0.22) and among all populations (0.23) (Table 1) are similar to
genome-wide estimates from previous studies Pyh¨aj¨arvi, HuVord & Ross-Ibarra, 2013.
Although we found large variation in Hopscotch allele frequency among our populations,
BayEnv analysis did not indicate a correlation between the Hopscotch insertion and
environmental variables (all Bayes Factors < 1).
Studer et al. 2011 Nat. Gen.; Vann et al. 2015 PeerJ
tga1
GENETICS ADVANCE ONLINE PUBLICATION 3
nguish maize and teosinte. Both the maize and teosinte
s for the distal component repressed luciferase expression
luc
luc
luc
luc
luc
luc
Hopscotch
mpCaMV
M-dist
T-prox
M-prox
0 0.5 1.0 1.5 2.0
∆M-dist
∆M-prox
ProximalcontrolregionDistal
Constructs and corresponding normalized luciferase expression
nsient assays were performed in maize leaf protoplast. Each
is drawn to scale. The construct backbone consists of the
romoter from the cauliflower mosaic virus (mpCaMV, gray box),
ORF (luc, white box) and the nopaline synthase terminator
). Portions of the proximal and distal components of the
gion (hatched boxes) from maize and teosinte were cloned
ction sites upstream of the minimal promoter. “ ” denotes
on of either the Tourist or Hopscotch element from the maize
Horizontal green bars show the normalized mean with s.e.m.
onstruct.
relative expressionconstruct
gt1
hard sweep
M T N P H R L
GGTCGA ATG ACT GAT CCA CAT CGA CTG TAG
tga1
hard sweep
M T N P H R L
GGTCGA ATG ACT GAT CCA CAT CGA CTG TAG
tga1
gt1
tb1
Multiple
Mutations
Standing
Variation
M T G P H R L
GGTAAA ATG ACT GGT CCA CAT CGA CTG TAG
Vann et al. 2015 PeerJ
polygenic adaptation
30%
phenotypic
variance
0%
phenotypic
variance
Hufford et al. 2012 Nat. Gen.
Chia et al. 2012 Nat. Gen
13 teosinte
23 maize
~500 genes (2%)
11M shared SNPs
3,000 fixed
genomes:
Hufford et al. 2012 Nat. Gen.
Chia et al. 2012 Nat. Gen
13 teosinte
23 maize
genomes:
Hufford et al. 2012 Nat. Gen.
Chia et al. 2012 Nat. Gen
13 teosinte
23 maize
genomes:
Swanson-Wagner et al. 2012 PNAS
E
ze network edges
6
7
2
Mb
or conservation and targets of selection during improvement and/or domestication. (A) Venn diagram
es, and the genes that occur in genomic regions that have evidence for selective sweeps during maize
s). (B) Teosinte coexpression networks for three genes (GRMZM2G068436, GRMZM2G137947, and
ned in maize coexpression networks are shown. Although the differentially expressed gene (red node) is
tions are lost in maize. However, some parts of the teosinte network are still conserved in maize. (C) Cross-
ExpressionGenealogy
teosinte
maize
nucleotidediversity
distance to nearest substitution (cM)
Beissinger et al. In Prep: http://biorxiv.org/content/early/
nucleotidediversity
distance to nearest substitution (cM)
Beissinger et al. In Prep: http://biorxiv.org/content/early/
Mexico lowland
9,000 BP
Matsuoka et al. 2002; Piperno 2006
Perry et al. 2006; Piperno et al. 2009
Mexico highland6,000 BP
Mexico lowland
9,000 BP
Matsuoka et al. 2002; Piperno 2006
Perry et al. 2006; Piperno et al. 2009
Mexico highland6,000 BP
S. America
lowland
6,000 BP
Mexico lowland
9,000 BP
Matsuoka et al. 2002; Piperno 2006
Perry et al. 2006; Piperno et al. 2009
Mexico highland6,000 BP
S. America
lowland
6,000 BP
S. America
Highland
4,000 BP
Mexico lowland
9,000 BP
Matsuoka et al. 2002; Piperno 2006
Perry et al. 2006; Piperno et al. 2009
Mexico
photobyMonthonWachirasettakul
Andes
photobyMattHufford
SA MEX SA MEX
SA MEX SA MEX SA MEX SA MEX
Ear Height Plant Height
Tassel Br. Number
TW
Days to Anthesis
SA MEX SA MEX
SA MEX SA MEX
LowlandHighland
95 landraces
~100K SNPs
Takuno et al. 2015 Genetics
-Logp-valueFstS.America
-Log p-value Fst Mexico
shared SNPs
unique S.America
unique Mexico
95 landraces
~100K SNPs
Takuno et al. 2015 Genetics
-Logp-valueFstS.America
-Log p-value Fst Mexico
shared SNPs
unique S.America
unique Mexico
39%
61%
Intergenic
Genic
19%
81%
Standing Variation
New mutation
Takuno et al. 2015 Genetics
Beissinger et al. In Prep (b) Berg & Coop 2014 PLoS Genetics
Z =
LX
i=1
↵ipi
allele freq.
population
breeding value
effect size
Beissinger et al. In Prep (b) Berg & Coop 2014 PLoS Genetics
Z =
LX
i=1
↵ipi
allele freq.
population
breeding value
effect size
relatednessdispersion
add. genetic var.
QX =
~Z0
T
F 1 ~Z0
2VA
Beissinger et al. In Prep (b) Berg & Coop 2014 PLoS Genetics
Warm
Cold
Beissinger et al. In Prep (b) Berg & Coop 2014 PLoS Genetics
Warm
Cold
Beissinger et al. In Prep (b) Berg & Coop 2014 PLoS Genetics
Warm
masl
Pyhäjärvi et al. GBE 2013
Beissinger et al. In Prep: http://biorxiv.org/content/early/
how to adapt: Zea mays
soft sweeps
M T G P H R L
GGTAAA ATG ACT GGT CCA CAT CGA CTG TAG
polygenic adaptation
regulatory variation
Sattah et al. 2011 PLoS Gen.
Williamson et al. 2014 PLoS Gen
Hernandez et al. 2011 Science
Sattah et al. 2011 PLoS Gen.
Williamson et al. 2014 PLoS Gen
Hernandez et al. 2011 Science
Sattah et al. 2011 PLoS Gen.
Williamson et al. 2014 PLoS Gen
Hernandez et al. 2011 Science
diversity
Ne diploids
s selection coefficient
selection is effective if 2Nes > 1
Ne diploids
s selection coefficient
selection is effective if 2Nes > 1
Ne ~ 150,000 Ne ~ 10,000
Ne ~ 2,000,000 Ne ~ 600,000
Ne diploids
s selection coefficient
selection is effective if 2Nes > 1
Ne ~ 150,000 Ne ~ 10,000
Ne ~ 2,000,000 Ne ~ 600,000
20% nonsyn. subs 10% nonsyn. subs
50% nonsyn. subs 40% nonsyn. subs
teosinte
maize
DATA
teosinte
maize
MODEL
Beissinger et al. In Prep: http://biorxiv.org/content/early/2015/11/13/031666
Hufford et al. 2012
teosinte
maize
DATA
teosinte
maize
MODEL
0.05Na
Na
Na 3Na
Beissinger et al. In Prep: http://biorxiv.org/content/early/2015/11/13/031666
Hufford et al. 2012
Ne ~
150,000
Ne ~
50,000
Beissinger et al. In Prep: http://biorxiv.org/content/early/
0.05Na
Na
Na 3Na
Ne ~ 450,000
Beissinger et al. In Prep: http://biorxiv.org/content/early/
0.05Na
Na
Na 3Na
Ne ~ 450,000
Ne ~ 1,000,000
Beissinger et al. In Prep: http://biorxiv.org/content/early/
0.05Na
Na
Na 3Na
Ne ~ 450,000
Ne ~ 1,000,000
1e+05
1e+07
1e+09
1e+03 1e+042e+04 1e+05
years(u=3e−8, generation=1)
effectivepopulationsize
pop
BKN_4Hap
BKN_6Hap
TIL_4Hap_Jalisco
TIL_6Hap
Ne ~ 1,000,000,000
Beissinger et al. In Prep: http://biorxiv.org/content/early/
0.05Na
Na
Na 3Na
Ne ~ 450,000
Ne ~ 1,000,000
1e+05
1e+07
1e+09
1e+03 1e+042e+04 1e+05
years(u=3e−8, generation=1)
effectivepopulationsize
pop
BKN_4Hap
BKN_6Hap
TIL_4Hap_Jalisco
TIL_6Hap
Ne ~ 1,000,000,000
Ne ~ 5,000,000,000
Beissinger et al. In Prep: http://biorxiv.org/content/early/
nucleotidediversity
distance to gene (cM)
Beissinger et al. In Prep: http://biorxiv.org/content/early/
nucleotidediversity
distance to gene (cM)
singletondiversity
distance to gene (cM)
Beissinger et al. In Prep: http://biorxiv.org/content/early/
singletondiversity
distance to nearest substitution (cM)
Beissinger et al. In Prep: http://biorxiv.org/content/early/
Sattah et al. 2011 PLoS Gen.
Williamson et al. 2014 PLoS Gen
Hernandez et al. 2011 Science
diversity
Ne >> 1,000,000 Ne ~ 10,000*
Ne ~ 2,000,000 Ne ~ 600,000
M T G P H R L
ATG ACT GGT CCA CAT CGA CTG TAG
M T G P H R L
ATG ACT GGT CCA CAT CGA CTG TAG
M T N P H R L
ATG ACT GAT CCA CAT CGA CTG TAGx
M T G P H R L
ATG ACT GGT CCA CAT CGA CTG TAG
M T N P H R L
ATG ACT GAT CCA CAT CGA CTG TAGx
M T G P H R L
ATG ACT GGT CCA CAT CGA CTG TAG
M T N P H R L
ATG ACT GAT CCA CAT CGA CTG TAG
x x x
x
M T G P H R L
ATG ACT GGT CCA CAT CGA CTG TAG
M T N P H R L
ATG ACT GAT CCA CAT CGA CTG TAG
x xx x
x
M T G P H R L
ATG ACT GGT CCA CAT CGA CTG TAG
M T N P H R L
ATG ACT GAT CCA CAT CGA CTG TAG
x xx x
x
M T G P H R L
ATG ACT GGT CCA CAT CGA CTG TAG
M T N P H R L
ATG ACT GAT CCA CAT CGA CTG TAG
x xx x
x x x x
x
Makarevitch et al. 2014 PLoS Genetics
single TE family, many genes
Makarevitch et al. 2014 PLoS Genetics
single TE family, many genes
new insertions activate expression
Makarevitch et al. 2014 bioRxiv
Lines with the
TE insertion
Lines without the
TE insertion
GRMZM2G071206
Log2(stress/control)
-2
0
2
4
6
8
10
12
Lines with the
TE insertion
Lines without the
TE insertion
-2
0
2
4
6
8
10
12
Log2(stress/control)
GRMZM2G400718
C
1.0
1.5
2.0
D
GRMZM2G102447
-2
0
2
4
6
8
10
12
14
Lines with the
TE insertion
Lines without the
TE insertion
GRMZM2G108149
A
B
Log2(stress/control)s/control)
http://biDownloaded from
-0.5
0.0
0.5
1.0
1.5
2.0
2.5
3.0
3.5
1 2 3 4 5 6 7 8 9 10
Oh43
B73
Mo17
- - + - - + - + - - ++ - - + - - + - - + - - + - - + - - +
Gene
Log2(stress/control)
TE
presence
0%
20%
40%
60%
80%
100%
alaw
dagaf
etug
flip
gyma
ipiki
jeli
joemon
naiba
nihep
odoj
pebi
raider
riiryl
ubel
uwum
Zm00346
Zm02117
Zm03238
Zm05382
Salt
UV
Heat
Cold
B
A
Percentofconserved
genes
*
**
***
*
*
** *
single gene,
many individuals
Hancock et al 2011 Science
Hernandez et al. 2011 Science
Fraser et al. 2013 Gen. Research
enrichment
intergenic<———>coding
Pyhäjärvi et al. GBE 2013
enrichment
intergenic<———>coding
Ne diploids
µ beneficial mutation rate per trait
selection from standing variation when 2Neµ > 1
Ne diploids
µ beneficial mutation rate per trait
selection from standing variation when 2Neµ > 1
Garud et al. 2015 PLoS Gen.
Jensen 2014 Nat. Comm.
Pritchard et al. 2010 Curr. Bio.
Enard et al. 2014 Gen. Res.
Beissinger et al. In Prep
µ ∝ 2,500 Mbp µ ∝ 3,100 Mbp
µ ∝ 130 Mbp
Ne diploids
µ beneficial mutation rate per trait
selection from standing variation when 2Neµ > 1
Garud et al. 2015 PLoS Gen.
Jensen 2014 Nat. Comm.
Pritchard et al. 2010 Curr. Bio.
Enard et al. 2014 Gen. Res.
Beissinger et al. In Prep
µ ∝ 2,500 Mbp µ ∝ 3,100 Mbp
µ ∝ 130 Mbp µ ∝ 220 Mbp
µ ∝ 130 Mbp
Williamson et al. 2014 PLoS Gen
Brandon Gaut
maizeArabidopsis
Kew C-Value Database
log 1C genome size
• “Soft sweeps” and polygenic selection predominate
in maize and teosinte
• Most selection appears in noncoding sequence
• Both effective population size & mutational target
contribute
• Large, complex genomes may mean more targets &
more soft sweeps & less linked effects of selection
Concluding Thoughts
Acknowledgments
Maize Diversity Group
Peter Bradbury
Ed Buckler
John Doebley
Theresa Fulton
Sherry Flint-Garcia
Jim Holland
Sharon Mitchell
Qi Sun
Doreen Ware
Collaborators
Graham Coop
Nathan Springer
Ruairidh Sawers
Lab Alumni
Tim Beissinger (USDA-ARS, Mizzou)
Kate Crosby (Monsanto)
Matt Hufford (Iowa State)
Tanja Pyhäjärvi (Oulu)
Shohei Takuno (Sokendai)
Joost van Heerwaarden (Wageningen)
Langebio 2015

Langebio 2015

  • 1.
    Selection and demography inmaize evolution Jeffrey Ross-Ibarra @jrossibarra • www.rilab.org Dept. Plant Sciences • Center for Population Biology • Genome Center University of California Davis photo by lady_lbrty
  • 3.
    Photos: Matt Hufford,Brandon Gaut, John Doebley
  • 4.
  • 5.
  • 6.
  • 7.
  • 8.
  • 9.
    hard sweep multiple mutations polygenicadaptation Diversity standing variation “soft” sweeps
  • 10.
    M T GP H R L GGTCGAC ATG ACT GGT CCA CAT CGA CTG TAG
  • 11.
    M T GP H R L GGTCGAC ATG ACT GGT CCA CAT CGA CTG TAG M T N P H R L GGTCGAC ATG ACT GAT CCA CAT CGA CTG TAG
  • 12.
    M T GP H R L GGTAAAC ATG ACT GGT CCA CAT CGA CTG TAG GG—-AC ATG ACT GGT CCA CAT CGA CTG TAG
  • 13.
    maize origins TripsacumF1 teosinte (Z. maysssp. parviglumis) maize (Z. mays ssp. mays)
  • 14.
    F1 Beadle 1979 FieldMuseum of Nat. Hist. Bull.
  • 15.
    F1 Beadle 1979 FieldMuseum of Nat. Hist. Bull.
  • 16.
    F1 Beadle 1979 FieldMuseum of Nat. Hist. Bull.
  • 17.
    F1 Beadle 1979 FieldMuseum of Nat. Hist. Bull.
  • 18.
    Briggs et al.2007 Genetics 1 2 3 4 5 6 7 8 9 10
  • 19.
    Wang et al.2005 Nature 1 2 3 4 5 6 7 8 9 10 Figure 1. Phenotypes. a. Maize ear showing the cob (cb) exposed at top. b. Teosinte e internode (in) and glume (gl) labeled. c. Teosinte ear from a plant with a m introgressed into it. d. Close-up of a single teosinte fruitcase. e. Close-up o teosinte plant with a maize allele of tga1 introgressed into it. f. Ear of maiz (Tga1-maize allele) with the cob exposed showing the small white glumes a of maize inbred W22:tga1 which carries the teosinte allele, showing enlarge h. Ear of maize inbred W22 carrying the tga1-ems1 allele, showing enlarged g NIH-PAAuthorManuscriptNIH-PAAuthorManuscriptNIH-P tga1 Wang et al. 2015 Genetics
  • 20.
    Wang et al.2005 Nature 1 2 3 4 5 6 7 8 9 10 Figure 1. Phenotypes. a. Maize ear showing the cob (cb) exposed at top. b. Teosinte e internode (in) and glume (gl) labeled. c. Teosinte ear from a plant with a m introgressed into it. d. Close-up of a single teosinte fruitcase. e. Close-up o teosinte plant with a maize allele of tga1 introgressed into it. f. Ear of maiz (Tga1-maize allele) with the cob exposed showing the small white glumes a of maize inbred W22:tga1 which carries the teosinte allele, showing enlarge h. Ear of maize inbred W22 carrying the tga1-ems1 allele, showing enlarged g NIH-PAAuthorManuscriptNIH-PAAuthorManuscriptNIH-P tga1 Wang et al. 2015 Genetics
  • 21.
    1 2 34 5 6 7 8 9 10 gt1 tga1 Wills et al. 2013 PLoS Genetics
  • 22.
    1 2 34 5 6 7 8 9 10 gt1 tga1 Wills et al. 2013 PLoS Genetics teosinte maize Clint Whipple, BYU
  • 23.
    1 2 34 5 6 7 8 9 10 gt1 tga1 Wills et al. 2013 PLoS Genetics
  • 24.
    1 2 34 5 6 7 8 9 10 gt1 tga1 Wills et al. 2013 PLoS Genetics 5’ control region 3’ UTR
  • 25.
    1 2 34 5 6 7 8 9 10 tb1 Studer et al. 2011 Nat. Gen.; Vann et al. 2015 PeerJ tga1gt1
  • 26.
    1 2 34 5 6 7 8 9 10 tb1 Studer et al. 2011 Nat. Gen.; Vann et al. 2015 PeerJ tga1 GENETICS ADVANCE ONLINE PUBLICATION 3 nguish maize and teosinte. Both the maize and teosinte s for the distal component repressed luciferase expression luc luc luc luc luc luc Hopscotch mpCaMV M-dist T-prox M-prox 0 0.5 1.0 1.5 2.0 ∆M-dist ∆M-prox ProximalcontrolregionDistal Constructs and corresponding normalized luciferase expression nsient assays were performed in maize leaf protoplast. Each is drawn to scale. The construct backbone consists of the romoter from the cauliflower mosaic virus (mpCaMV, gray box), ORF (luc, white box) and the nopaline synthase terminator ). Portions of the proximal and distal components of the gion (hatched boxes) from maize and teosinte were cloned ction sites upstream of the minimal promoter. “ ” denotes on of either the Tourist or Hopscotch element from the maize Horizontal green bars show the normalized mean with s.e.m. onstruct. relative expressionconstruct gt1
  • 27.
    1 2 34 5 6 7 8 9 10 tb1 Figure 2 Map of parviglumis Populations and Hopscotch allele frequency. Map showing the frequency of the Hopscotch allele in populations of parviglumis where we sampled more than 6 individuals. Size of circles reflects number of individuals sampled. The Balsas River is shown, as the Balsas River Basin is believed to be the center of domestication of maize. as our independent trait for phenotyping analyses. SAS code used for analysis is available at http://dx.doi.org/10.6084/m9.figshare.1166630. RESULTS Genotyping for the Hopscotch insertion The genotype at the Hopscotch insertion was confirmed with two PCRs for 837 individuals of the 1,100 screened (Table S1 and Table S2). Among the 247 maize landrace accessions genotyped, all but eight were homozygous for the presence of the insertion Within our parviglumis and mexicana samples we found the Hopscotch insertion segregating in 37 (n = 86) and four (n = 17) populations, respectively, and at highest frequency within populations in the states of Jalisco, Colima, and Michoac´an in central-western Mexico (Fig. 2). Using our Hopscotch genotyping, we calculated diVerentiation between populations (FST) and subspecies (FCT) for populations in which we sampled sixteen or more chromosomes. We found that FCT = 0, and levels of FST among populations within each subspecies (0.22) and among all populations (0.23) (Table 1) are similar to genome-wide estimates from previous studies Pyh¨aj¨arvi, HuVord & Ross-Ibarra, 2013. Although we found large variation in Hopscotch allele frequency among our populations, BayEnv analysis did not indicate a correlation between the Hopscotch insertion and environmental variables (all Bayes Factors < 1). Studer et al. 2011 Nat. Gen.; Vann et al. 2015 PeerJ tga1 GENETICS ADVANCE ONLINE PUBLICATION 3 nguish maize and teosinte. Both the maize and teosinte s for the distal component repressed luciferase expression luc luc luc luc luc luc Hopscotch mpCaMV M-dist T-prox M-prox 0 0.5 1.0 1.5 2.0 ∆M-dist ∆M-prox ProximalcontrolregionDistal Constructs and corresponding normalized luciferase expression nsient assays were performed in maize leaf protoplast. Each is drawn to scale. The construct backbone consists of the romoter from the cauliflower mosaic virus (mpCaMV, gray box), ORF (luc, white box) and the nopaline synthase terminator ). Portions of the proximal and distal components of the gion (hatched boxes) from maize and teosinte were cloned ction sites upstream of the minimal promoter. “ ” denotes on of either the Tourist or Hopscotch element from the maize Horizontal green bars show the normalized mean with s.e.m. onstruct. relative expressionconstruct gt1
  • 28.
    hard sweep M TN P H R L GGTCGA ATG ACT GAT CCA CAT CGA CTG TAG tga1
  • 29.
    hard sweep M TN P H R L GGTCGA ATG ACT GAT CCA CAT CGA CTG TAG tga1 gt1 tb1 Multiple Mutations Standing Variation M T G P H R L GGTAAA ATG ACT GGT CCA CAT CGA CTG TAG
  • 30.
    Vann et al.2015 PeerJ polygenic adaptation 30% phenotypic variance 0% phenotypic variance
  • 31.
    Hufford et al.2012 Nat. Gen. Chia et al. 2012 Nat. Gen 13 teosinte 23 maize ~500 genes (2%) 11M shared SNPs 3,000 fixed genomes:
  • 32.
    Hufford et al.2012 Nat. Gen. Chia et al. 2012 Nat. Gen 13 teosinte 23 maize genomes:
  • 33.
    Hufford et al.2012 Nat. Gen. Chia et al. 2012 Nat. Gen 13 teosinte 23 maize genomes:
  • 34.
    Swanson-Wagner et al.2012 PNAS E ze network edges 6 7 2 Mb or conservation and targets of selection during improvement and/or domestication. (A) Venn diagram es, and the genes that occur in genomic regions that have evidence for selective sweeps during maize s). (B) Teosinte coexpression networks for three genes (GRMZM2G068436, GRMZM2G137947, and ned in maize coexpression networks are shown. Although the differentially expressed gene (red node) is tions are lost in maize. However, some parts of the teosinte network are still conserved in maize. (C) Cross- ExpressionGenealogy teosinte maize
  • 35.
    nucleotidediversity distance to nearestsubstitution (cM) Beissinger et al. In Prep: http://biorxiv.org/content/early/
  • 36.
    nucleotidediversity distance to nearestsubstitution (cM) Beissinger et al. In Prep: http://biorxiv.org/content/early/
  • 37.
    Mexico lowland 9,000 BP Matsuokaet al. 2002; Piperno 2006 Perry et al. 2006; Piperno et al. 2009
  • 38.
    Mexico highland6,000 BP Mexicolowland 9,000 BP Matsuoka et al. 2002; Piperno 2006 Perry et al. 2006; Piperno et al. 2009
  • 39.
    Mexico highland6,000 BP S.America lowland 6,000 BP Mexico lowland 9,000 BP Matsuoka et al. 2002; Piperno 2006 Perry et al. 2006; Piperno et al. 2009
  • 40.
    Mexico highland6,000 BP S.America lowland 6,000 BP S. America Highland 4,000 BP Mexico lowland 9,000 BP Matsuoka et al. 2002; Piperno 2006 Perry et al. 2006; Piperno et al. 2009
  • 41.
  • 42.
    SA MEX SAMEX SA MEX SA MEX SA MEX SA MEX Ear Height Plant Height Tassel Br. Number TW Days to Anthesis SA MEX SA MEX SA MEX SA MEX LowlandHighland
  • 43.
    95 landraces ~100K SNPs Takunoet al. 2015 Genetics
  • 44.
    -Logp-valueFstS.America -Log p-value FstMexico shared SNPs unique S.America unique Mexico 95 landraces ~100K SNPs Takuno et al. 2015 Genetics
  • 45.
    -Logp-valueFstS.America -Log p-value FstMexico shared SNPs unique S.America unique Mexico 39% 61% Intergenic Genic 19% 81% Standing Variation New mutation Takuno et al. 2015 Genetics
  • 46.
    Beissinger et al.In Prep (b) Berg & Coop 2014 PLoS Genetics
  • 47.
    Beissinger et al.In Prep (b) Berg & Coop 2014 PLoS Genetics Z = LX i=1 ↵ipi allele freq. population breeding value effect size
  • 48.
    Beissinger et al.In Prep (b) Berg & Coop 2014 PLoS Genetics Z = LX i=1 ↵ipi allele freq. population breeding value effect size relatednessdispersion add. genetic var. QX = ~Z0 T F 1 ~Z0 2VA
  • 49.
    Beissinger et al.In Prep (b) Berg & Coop 2014 PLoS Genetics Warm
  • 50.
    Cold Beissinger et al.In Prep (b) Berg & Coop 2014 PLoS Genetics Warm
  • 51.
    Cold Beissinger et al.In Prep (b) Berg & Coop 2014 PLoS Genetics Warm
  • 52.
  • 53.
  • 54.
  • 55.
  • 56.
    Beissinger et al.In Prep: http://biorxiv.org/content/early/
  • 57.
    how to adapt:Zea mays soft sweeps M T G P H R L GGTAAA ATG ACT GGT CCA CAT CGA CTG TAG polygenic adaptation regulatory variation
  • 58.
    Sattah et al.2011 PLoS Gen. Williamson et al. 2014 PLoS Gen Hernandez et al. 2011 Science
  • 59.
    Sattah et al.2011 PLoS Gen. Williamson et al. 2014 PLoS Gen Hernandez et al. 2011 Science
  • 60.
    Sattah et al.2011 PLoS Gen. Williamson et al. 2014 PLoS Gen Hernandez et al. 2011 Science diversity
  • 61.
    Ne diploids s selectioncoefficient selection is effective if 2Nes > 1
  • 62.
    Ne diploids s selectioncoefficient selection is effective if 2Nes > 1 Ne ~ 150,000 Ne ~ 10,000 Ne ~ 2,000,000 Ne ~ 600,000
  • 63.
    Ne diploids s selectioncoefficient selection is effective if 2Nes > 1 Ne ~ 150,000 Ne ~ 10,000 Ne ~ 2,000,000 Ne ~ 600,000 20% nonsyn. subs 10% nonsyn. subs 50% nonsyn. subs 40% nonsyn. subs
  • 64.
    teosinte maize DATA teosinte maize MODEL Beissinger et al.In Prep: http://biorxiv.org/content/early/2015/11/13/031666 Hufford et al. 2012
  • 65.
    teosinte maize DATA teosinte maize MODEL 0.05Na Na Na 3Na Beissinger etal. In Prep: http://biorxiv.org/content/early/2015/11/13/031666 Hufford et al. 2012
  • 66.
    Ne ~ 150,000 Ne ~ 50,000 Beissingeret al. In Prep: http://biorxiv.org/content/early/
  • 67.
    0.05Na Na Na 3Na Ne ~450,000 Beissinger et al. In Prep: http://biorxiv.org/content/early/
  • 68.
    0.05Na Na Na 3Na Ne ~450,000 Ne ~ 1,000,000 Beissinger et al. In Prep: http://biorxiv.org/content/early/
  • 69.
    0.05Na Na Na 3Na Ne ~450,000 Ne ~ 1,000,000 1e+05 1e+07 1e+09 1e+03 1e+042e+04 1e+05 years(u=3e−8, generation=1) effectivepopulationsize pop BKN_4Hap BKN_6Hap TIL_4Hap_Jalisco TIL_6Hap Ne ~ 1,000,000,000 Beissinger et al. In Prep: http://biorxiv.org/content/early/
  • 70.
    0.05Na Na Na 3Na Ne ~450,000 Ne ~ 1,000,000 1e+05 1e+07 1e+09 1e+03 1e+042e+04 1e+05 years(u=3e−8, generation=1) effectivepopulationsize pop BKN_4Hap BKN_6Hap TIL_4Hap_Jalisco TIL_6Hap Ne ~ 1,000,000,000 Ne ~ 5,000,000,000 Beissinger et al. In Prep: http://biorxiv.org/content/early/
  • 71.
    nucleotidediversity distance to gene(cM) Beissinger et al. In Prep: http://biorxiv.org/content/early/
  • 72.
    nucleotidediversity distance to gene(cM) singletondiversity distance to gene (cM) Beissinger et al. In Prep: http://biorxiv.org/content/early/
  • 73.
    singletondiversity distance to nearestsubstitution (cM) Beissinger et al. In Prep: http://biorxiv.org/content/early/
  • 74.
    Sattah et al.2011 PLoS Gen. Williamson et al. 2014 PLoS Gen Hernandez et al. 2011 Science diversity Ne >> 1,000,000 Ne ~ 10,000* Ne ~ 2,000,000 Ne ~ 600,000
  • 75.
    M T GP H R L ATG ACT GGT CCA CAT CGA CTG TAG
  • 76.
    M T GP H R L ATG ACT GGT CCA CAT CGA CTG TAG M T N P H R L ATG ACT GAT CCA CAT CGA CTG TAGx
  • 77.
    M T GP H R L ATG ACT GGT CCA CAT CGA CTG TAG M T N P H R L ATG ACT GAT CCA CAT CGA CTG TAGx
  • 78.
    M T GP H R L ATG ACT GGT CCA CAT CGA CTG TAG M T N P H R L ATG ACT GAT CCA CAT CGA CTG TAG x x x x
  • 79.
    M T GP H R L ATG ACT GGT CCA CAT CGA CTG TAG M T N P H R L ATG ACT GAT CCA CAT CGA CTG TAG x xx x x
  • 80.
    M T GP H R L ATG ACT GGT CCA CAT CGA CTG TAG M T N P H R L ATG ACT GAT CCA CAT CGA CTG TAG x xx x x
  • 81.
    M T GP H R L ATG ACT GGT CCA CAT CGA CTG TAG M T N P H R L ATG ACT GAT CCA CAT CGA CTG TAG x xx x x x x x x
  • 82.
    Makarevitch et al.2014 PLoS Genetics
  • 83.
    Makarevitch et al.2014 PLoS Genetics single TE family, many genes
  • 84.
    Makarevitch et al.2014 PLoS Genetics single TE family, many genes new insertions activate expression Makarevitch et al. 2014 bioRxiv Lines with the TE insertion Lines without the TE insertion GRMZM2G071206 Log2(stress/control) -2 0 2 4 6 8 10 12 Lines with the TE insertion Lines without the TE insertion -2 0 2 4 6 8 10 12 Log2(stress/control) GRMZM2G400718 C 1.0 1.5 2.0 D GRMZM2G102447 -2 0 2 4 6 8 10 12 14 Lines with the TE insertion Lines without the TE insertion GRMZM2G108149 A B Log2(stress/control)s/control) http://biDownloaded from -0.5 0.0 0.5 1.0 1.5 2.0 2.5 3.0 3.5 1 2 3 4 5 6 7 8 9 10 Oh43 B73 Mo17 - - + - - + - + - - ++ - - + - - + - - + - - + - - + - - + Gene Log2(stress/control) TE presence 0% 20% 40% 60% 80% 100% alaw dagaf etug flip gyma ipiki jeli joemon naiba nihep odoj pebi raider riiryl ubel uwum Zm00346 Zm02117 Zm03238 Zm05382 Salt UV Heat Cold B A Percentofconserved genes * ** *** * * ** * single gene, many individuals
  • 85.
    Hancock et al2011 Science Hernandez et al. 2011 Science Fraser et al. 2013 Gen. Research enrichment intergenic<———>coding Pyhäjärvi et al. GBE 2013 enrichment intergenic<———>coding
  • 86.
    Ne diploids µ beneficialmutation rate per trait selection from standing variation when 2Neµ > 1
  • 87.
    Ne diploids µ beneficialmutation rate per trait selection from standing variation when 2Neµ > 1 Garud et al. 2015 PLoS Gen. Jensen 2014 Nat. Comm. Pritchard et al. 2010 Curr. Bio. Enard et al. 2014 Gen. Res. Beissinger et al. In Prep µ ∝ 2,500 Mbp µ ∝ 3,100 Mbp µ ∝ 130 Mbp
  • 88.
    Ne diploids µ beneficialmutation rate per trait selection from standing variation when 2Neµ > 1 Garud et al. 2015 PLoS Gen. Jensen 2014 Nat. Comm. Pritchard et al. 2010 Curr. Bio. Enard et al. 2014 Gen. Res. Beissinger et al. In Prep µ ∝ 2,500 Mbp µ ∝ 3,100 Mbp µ ∝ 130 Mbp µ ∝ 220 Mbp µ ∝ 130 Mbp Williamson et al. 2014 PLoS Gen
  • 89.
    Brandon Gaut maizeArabidopsis Kew C-ValueDatabase log 1C genome size
  • 90.
    • “Soft sweeps”and polygenic selection predominate in maize and teosinte • Most selection appears in noncoding sequence • Both effective population size & mutational target contribute • Large, complex genomes may mean more targets & more soft sweeps & less linked effects of selection Concluding Thoughts
  • 91.
    Acknowledgments Maize Diversity Group PeterBradbury Ed Buckler John Doebley Theresa Fulton Sherry Flint-Garcia Jim Holland Sharon Mitchell Qi Sun Doreen Ware Collaborators Graham Coop Nathan Springer Ruairidh Sawers Lab Alumni Tim Beissinger (USDA-ARS, Mizzou) Kate Crosby (Monsanto) Matt Hufford (Iowa State) Tanja Pyhäjärvi (Oulu) Shohei Takuno (Sokendai) Joost van Heerwaarden (Wageningen)