Introduction to t-test:
Introductionto t-Test
• A t-test is a statistical method used to compare the means of two groups to find out if they are significantly
different from each other.
• It helps researchers decide if observed differences between groups are likely due to chance or reflect a real
effect.
• The test is commonly used in experiments and data analysis to test hypotheses about group averages.
Purpose and Applications
• Used in research to compare outcomes, such as treatment effects or group performance.
• Helps validate if changes or differences observed are statistically meaningful.
• Applies to fields like medicine, biology, psychology, and any area involving data comparison.
Assumptions of t-Test
• The data are collected from a small sample size (typically less than 30 observations).
• The population variance is unknown, so sample data is used to estimate it.
• The data should be approximately normally distributed.
• The samples should be independent (except for paired t-tests).
3.
1. One-sample t-Test
•Used to compare the average (mean) of one group to a
known value or population mean.
• Formula:
• where = sample mean, = known mean, = sample
standard deviation, = sample size.
• Example:
A sample of 16 students studied an average of 9 hours for a
test. Test if this differs from the known average study time of
5 hours.
Types of t-Tests:
4.
2. Independent (Two-sample)t-Test
• Used to compare the means of two separate groups to see if
they are significantly different.
• Formula:
• where is pooled variance, are group means, and are
sample sizes.
• Example:
Compare average scores of two different classes on a test to
check if their results differ.
5.
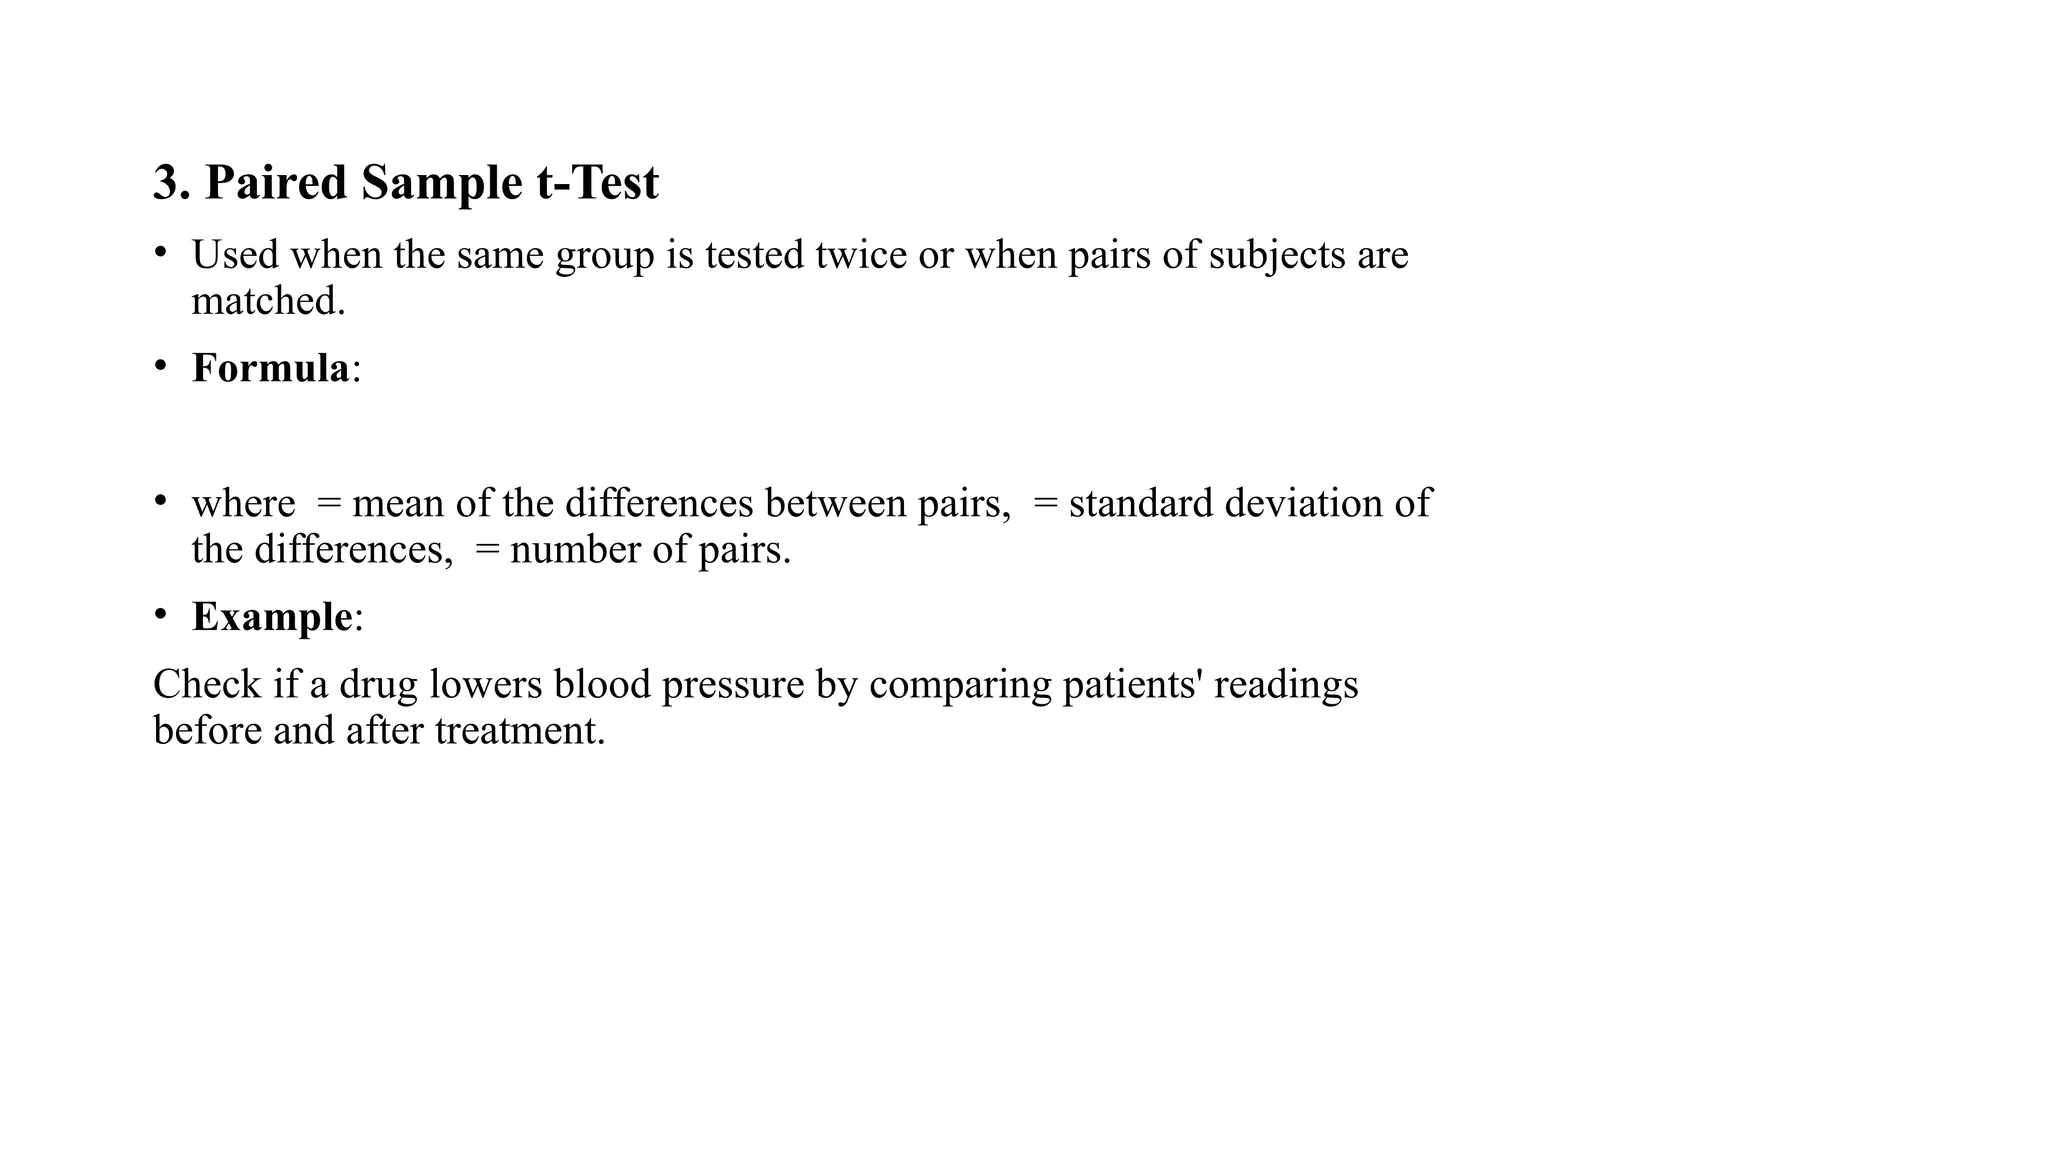
3. Paired Samplet-Test
• Used when the same group is tested twice or when pairs of subjects are
matched.
• Formula:
• where = mean of the differences between pairs, = standard deviation of
the differences, = number of pairs.
• Example:
Check if a drug lowers blood pressure by comparing patients' readings
before and after treatment.
6.
Steps for Hypothesistesting with t-test:
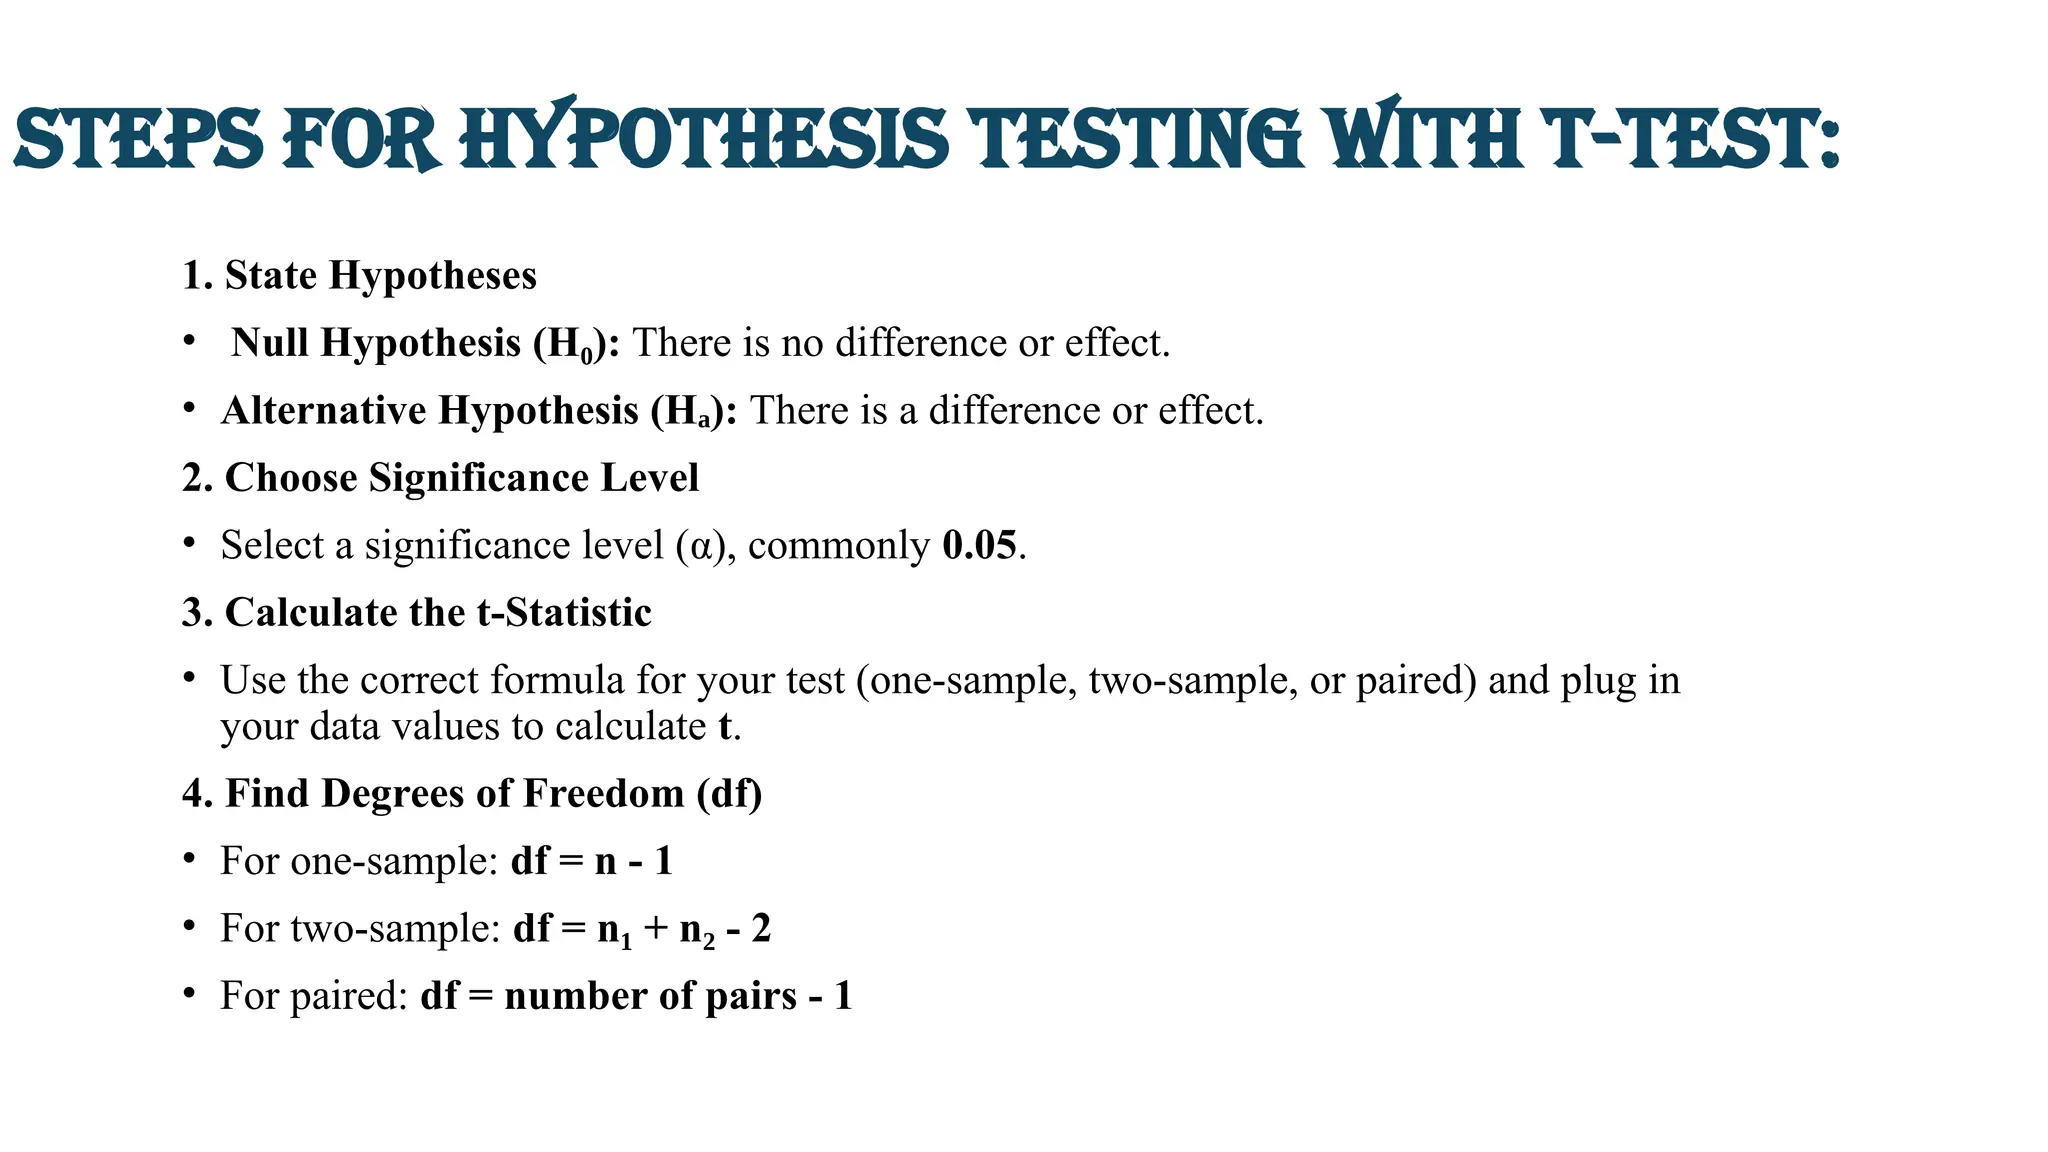
1. State Hypotheses
• Null Hypothesis (H ):
₀ There is no difference or effect.
• Alternative Hypothesis (H ):
ₐ There is a difference or effect.
2. Choose Significance Level
• Select a significance level (α), commonly 0.05.
3. Calculate the t-Statistic
• Use the correct formula for your test (one-sample, two-sample, or paired) and plug in
your data values to calculate t.
4. Find Degrees of Freedom (df)
• For one-sample: df = n - 1
• For two-sample: df = n + n - 2
₁ ₂
• For paired: df = number of pairs - 1
7.
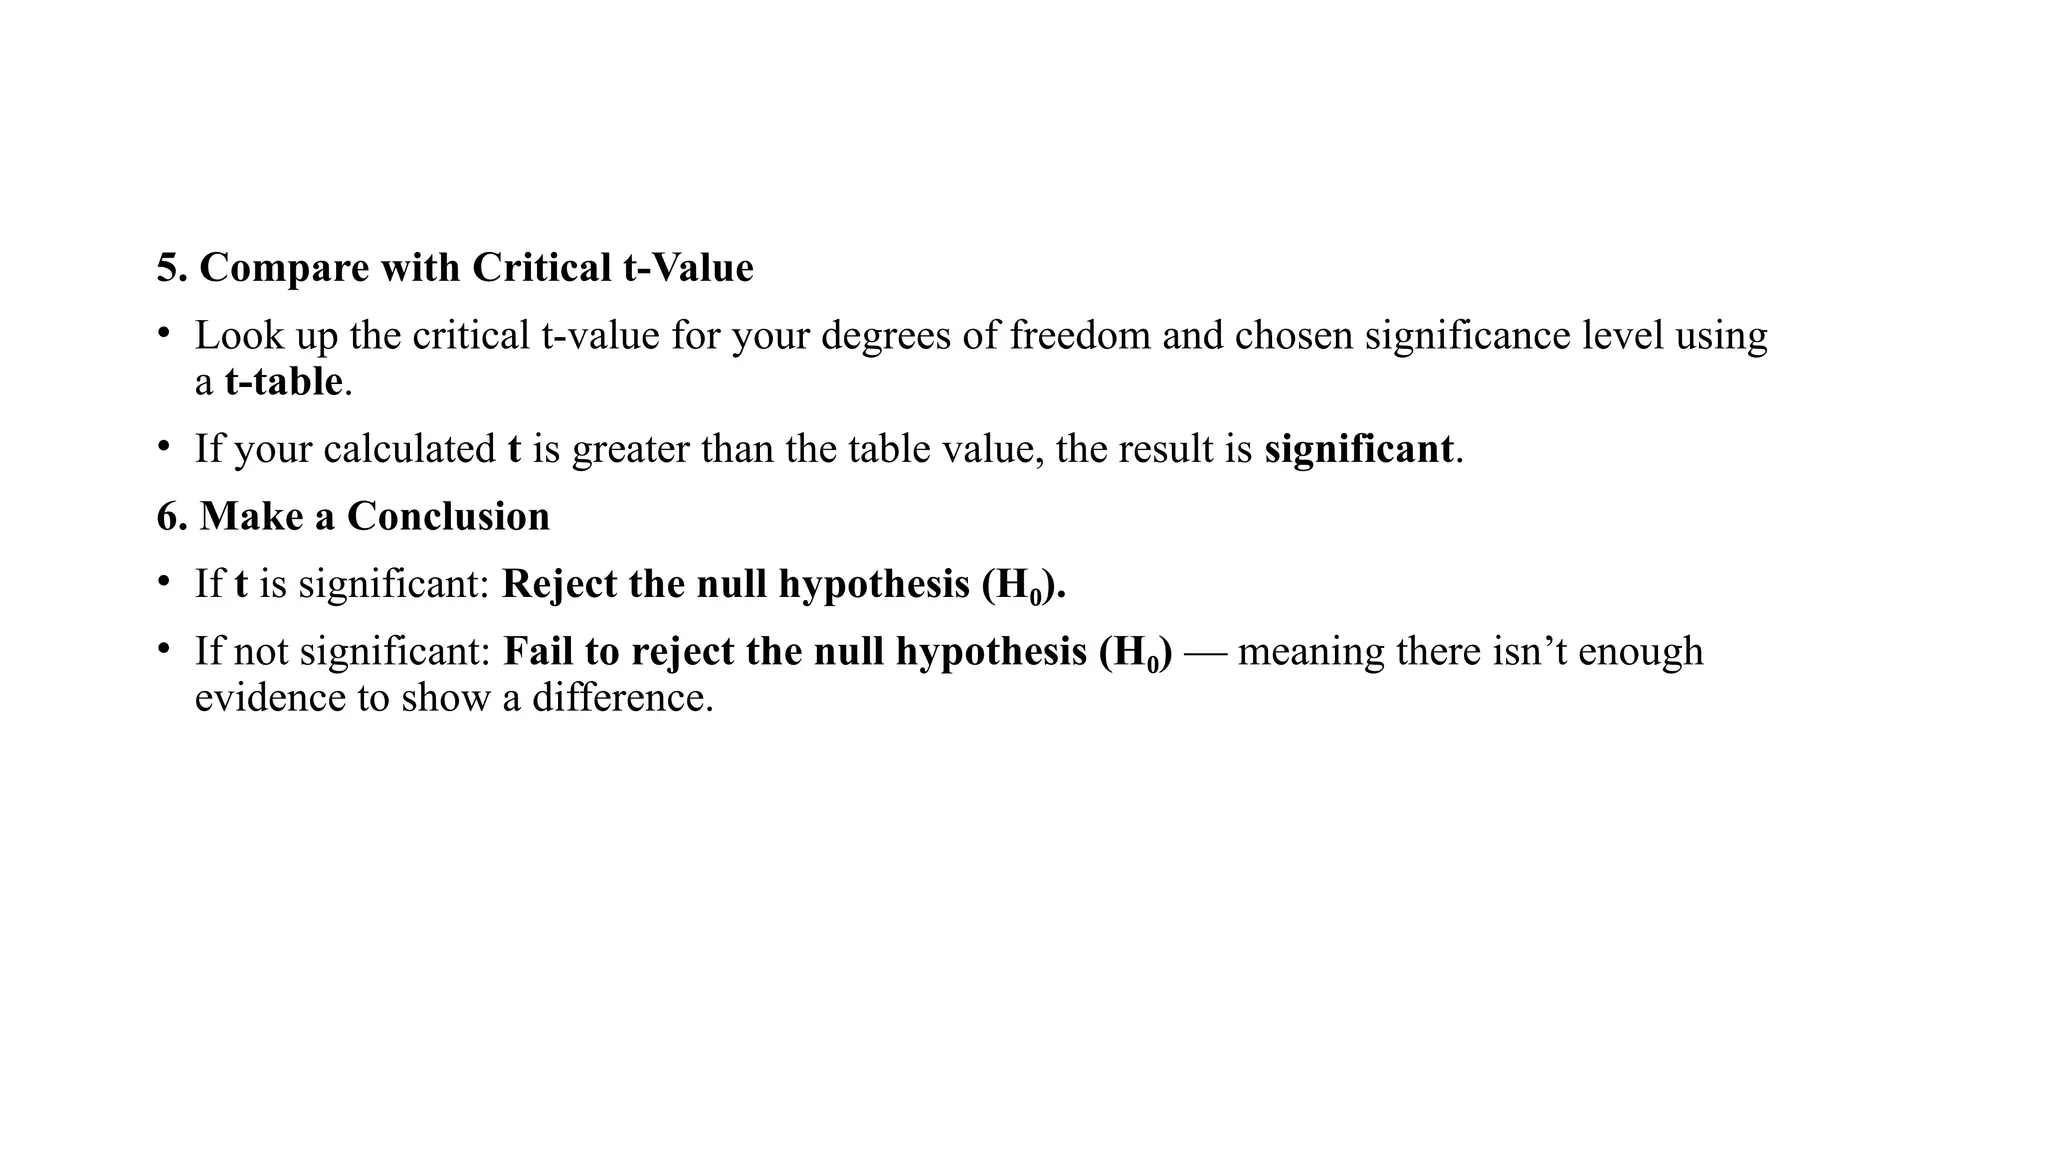
5. Compare withCritical t-Value
• Look up the critical t-value for your degrees of freedom and chosen significance level using
a t-table.
• If your calculated t is greater than the table value, the result is significant.
6. Make a Conclusion
• If t is significant: Reject the null hypothesis (H ).
₀
• If not significant: Fail to reject the null hypothesis (H )
₀ — meaning there isn’t enough
evidence to show a difference.
8.
Problem:
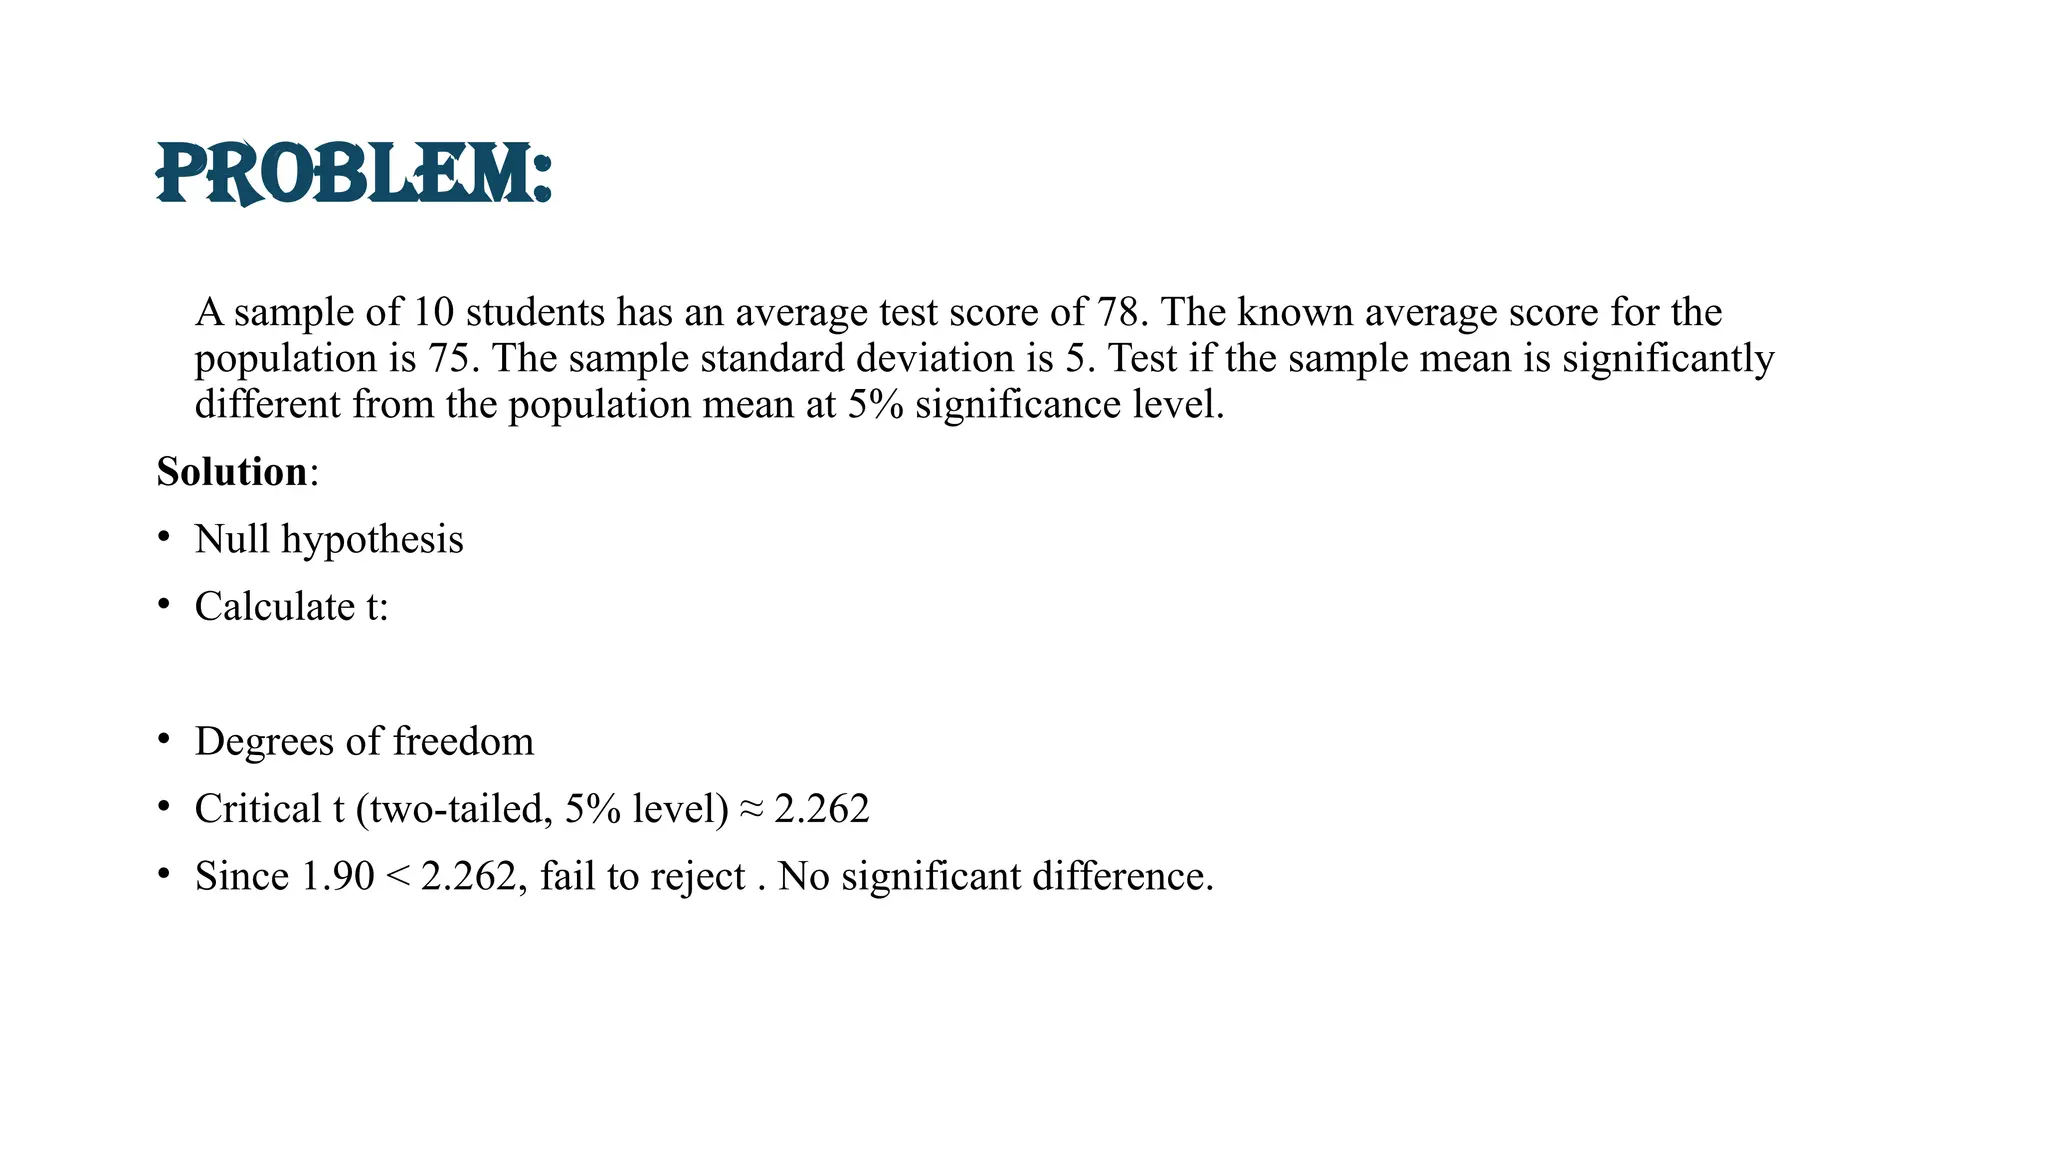
A sample of10 students has an average test score of 78. The known average score for the
population is 75. The sample standard deviation is 5. Test if the sample mean is significantly
different from the population mean at 5% significance level.
Solution:
• Null hypothesis
• Calculate t:
• Degrees of freedom
• Critical t (two-tailed, 5% level) ≈ 2.262
• Since 1.90 < 2.262, fail to reject . No significant difference.
9.
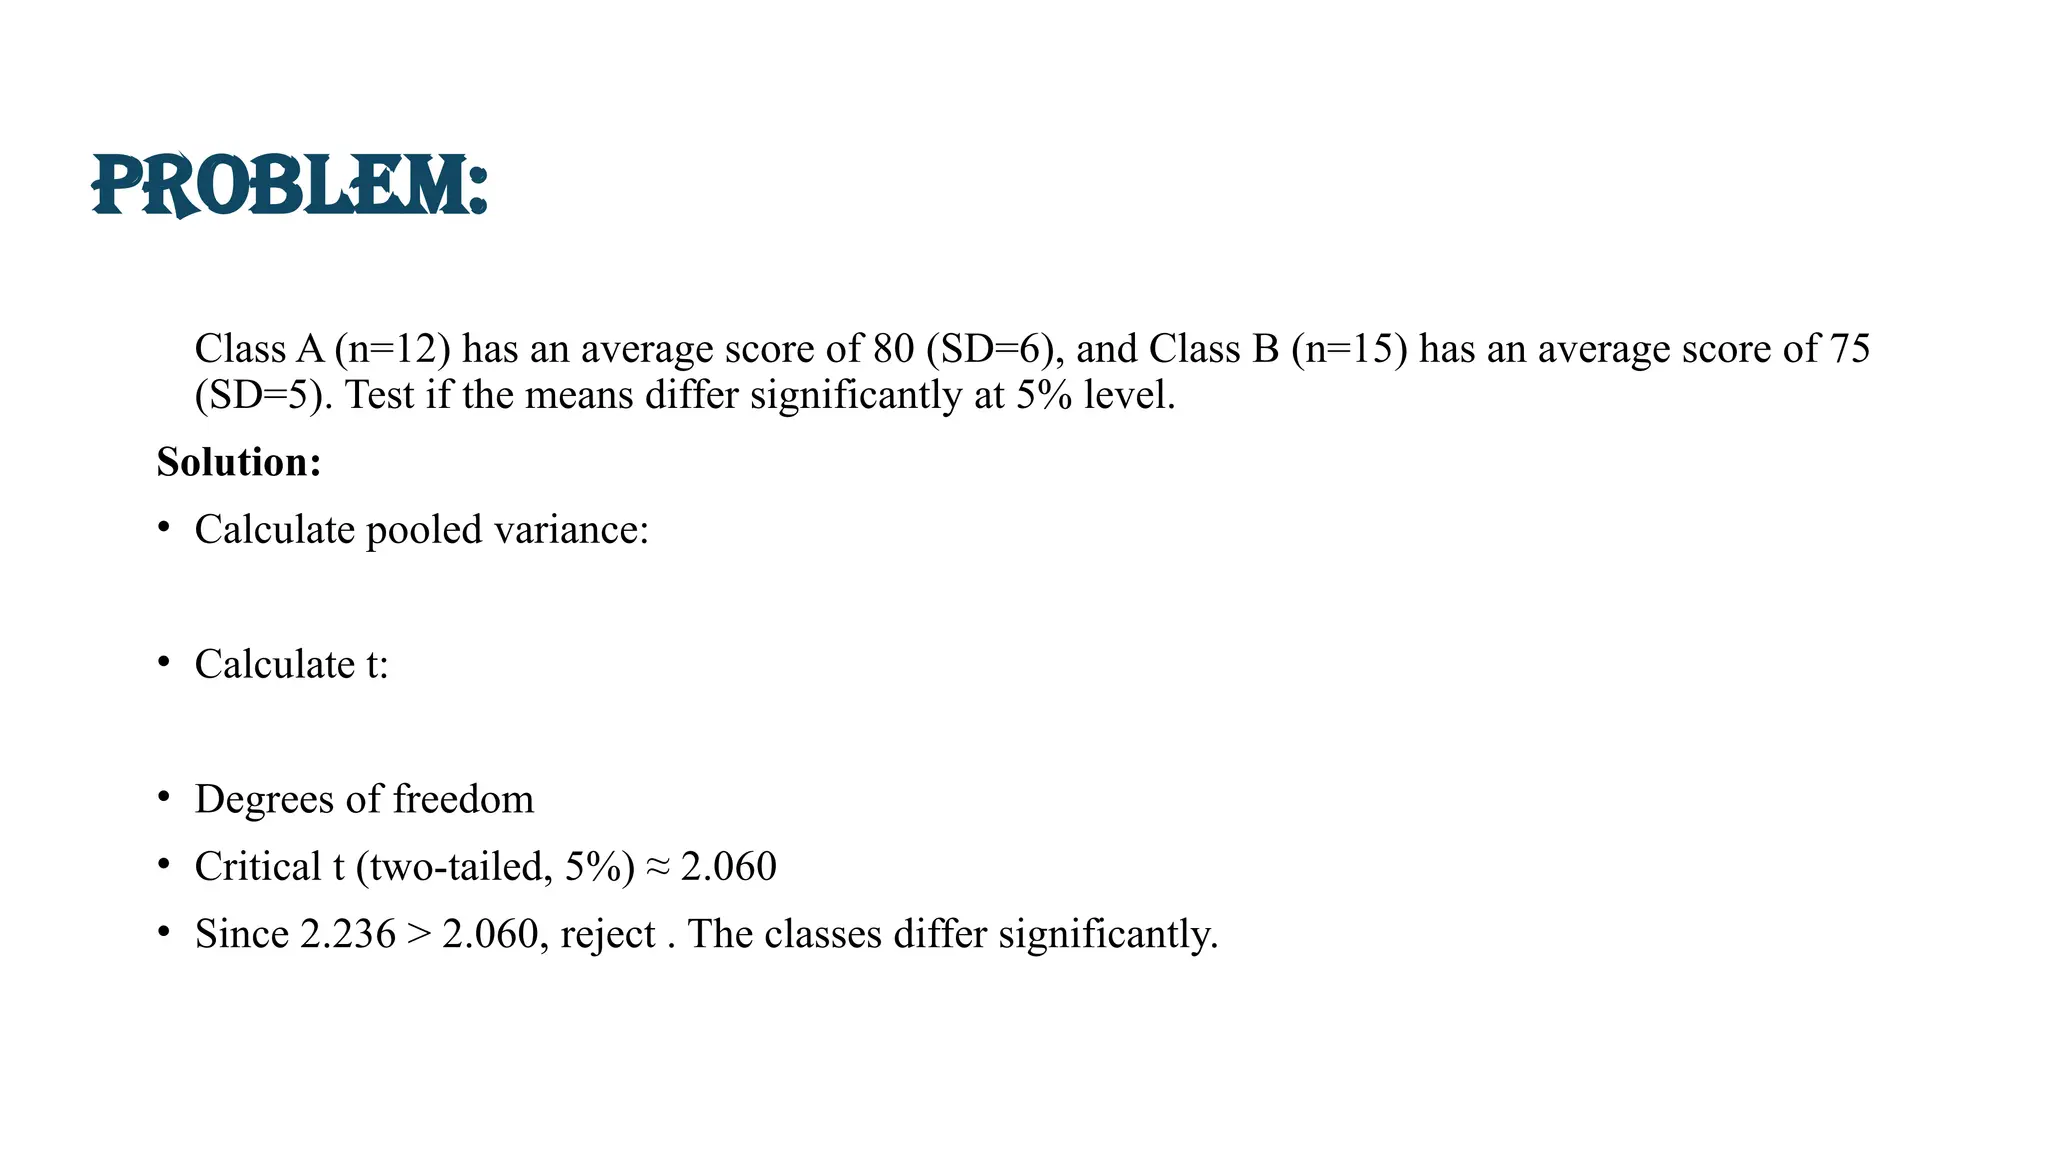
Class A (n=12)has an average score of 80 (SD=6), and Class B (n=15) has an average score of 75
(SD=5). Test if the means differ significantly at 5% level.
Solution:
• Calculate pooled variance:
• Calculate t:
• Degrees of freedom
• Critical t (two-tailed, 5%) ≈ 2.060
• Since 2.236 > 2.060, reject . The classes differ significantly.
Problem:
10.
Problem:
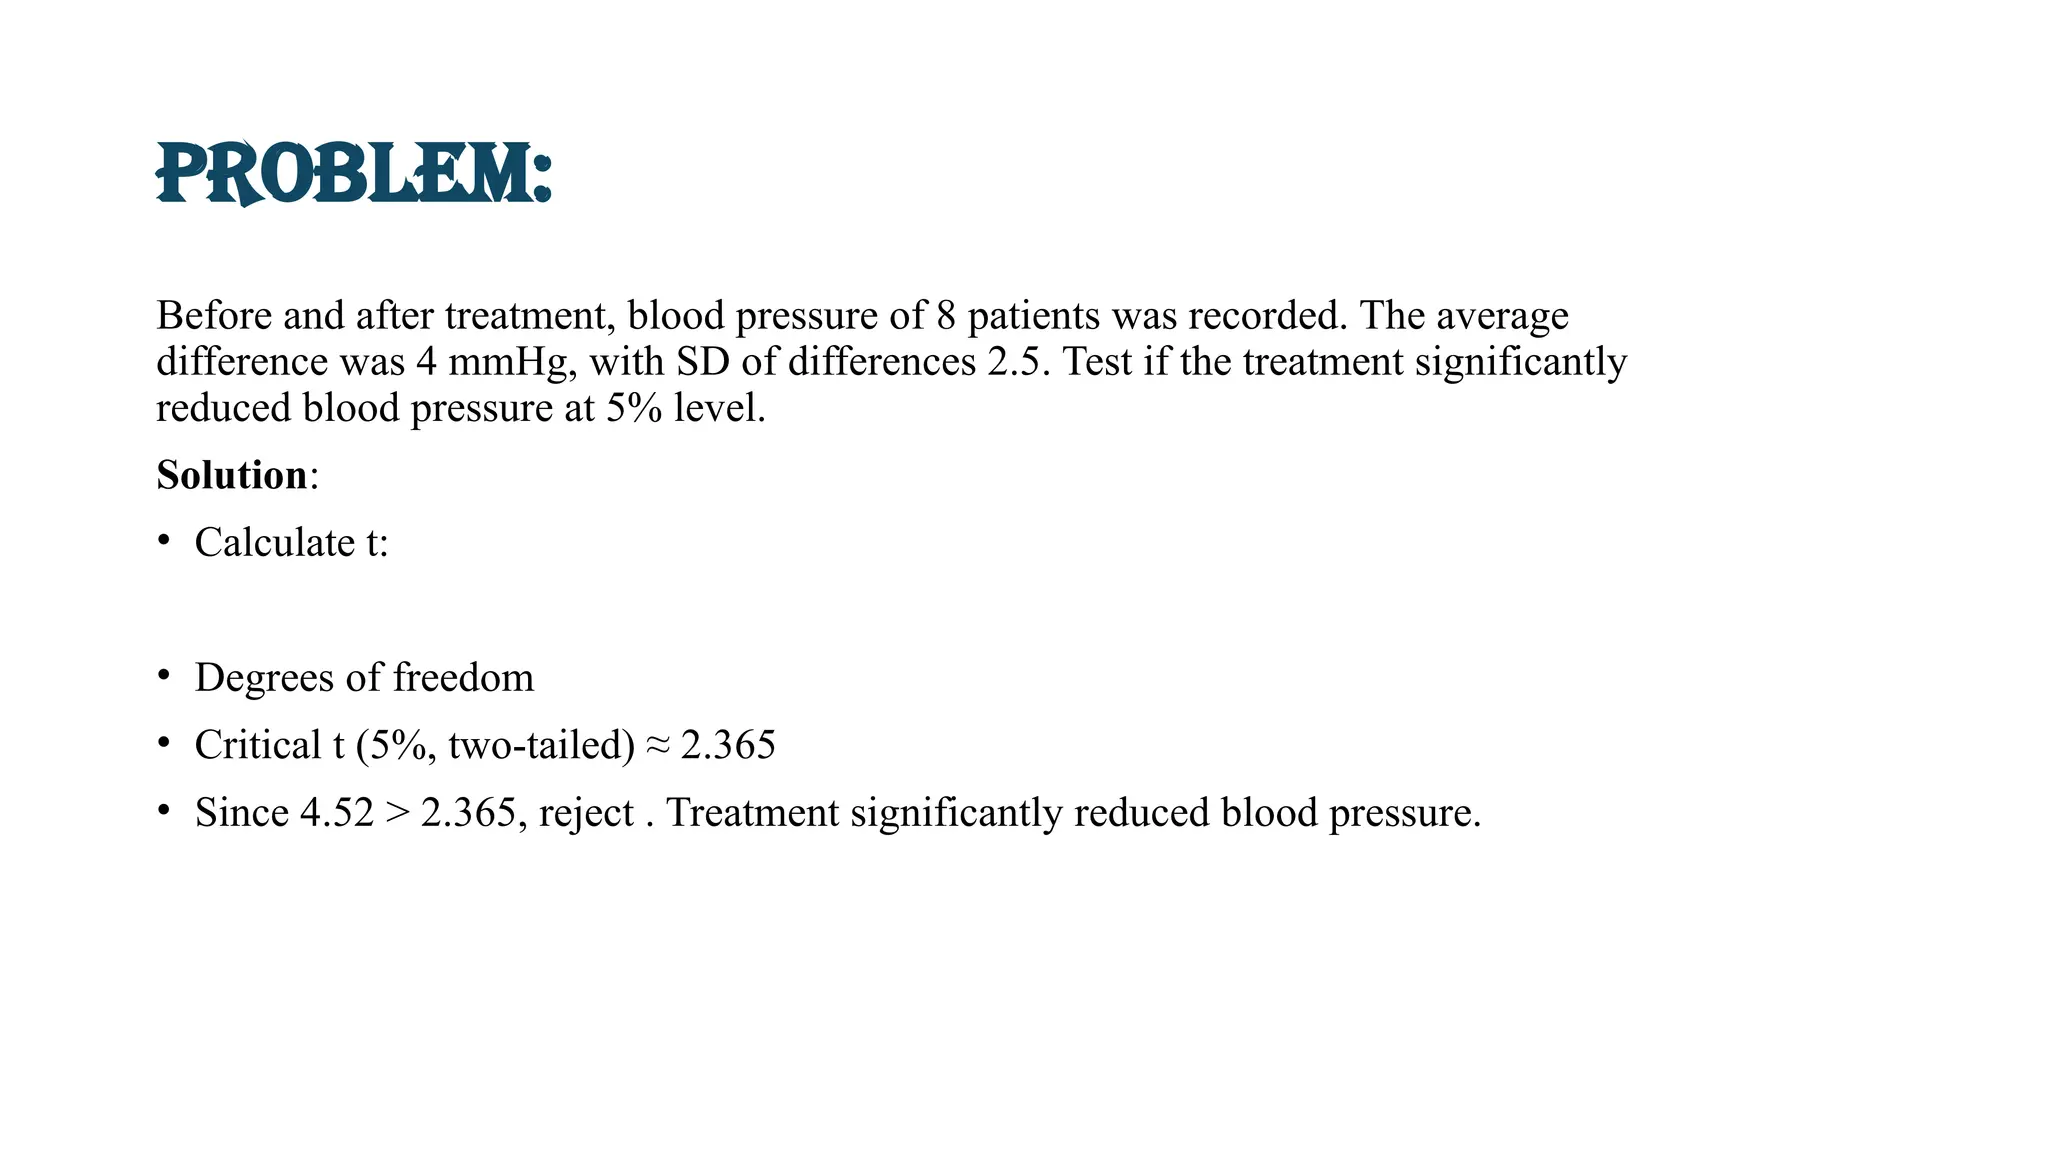
Before and aftertreatment, blood pressure of 8 patients was recorded. The average
difference was 4 mmHg, with SD of differences 2.5. Test if the treatment significantly
reduced blood pressure at 5% level.
Solution:
• Calculate t:
• Degrees of freedom
• Critical t (5%, two-tailed) ≈ 2.365
• Since 4.52 > 2.365, reject . Treatment significantly reduced blood pressure.
11.
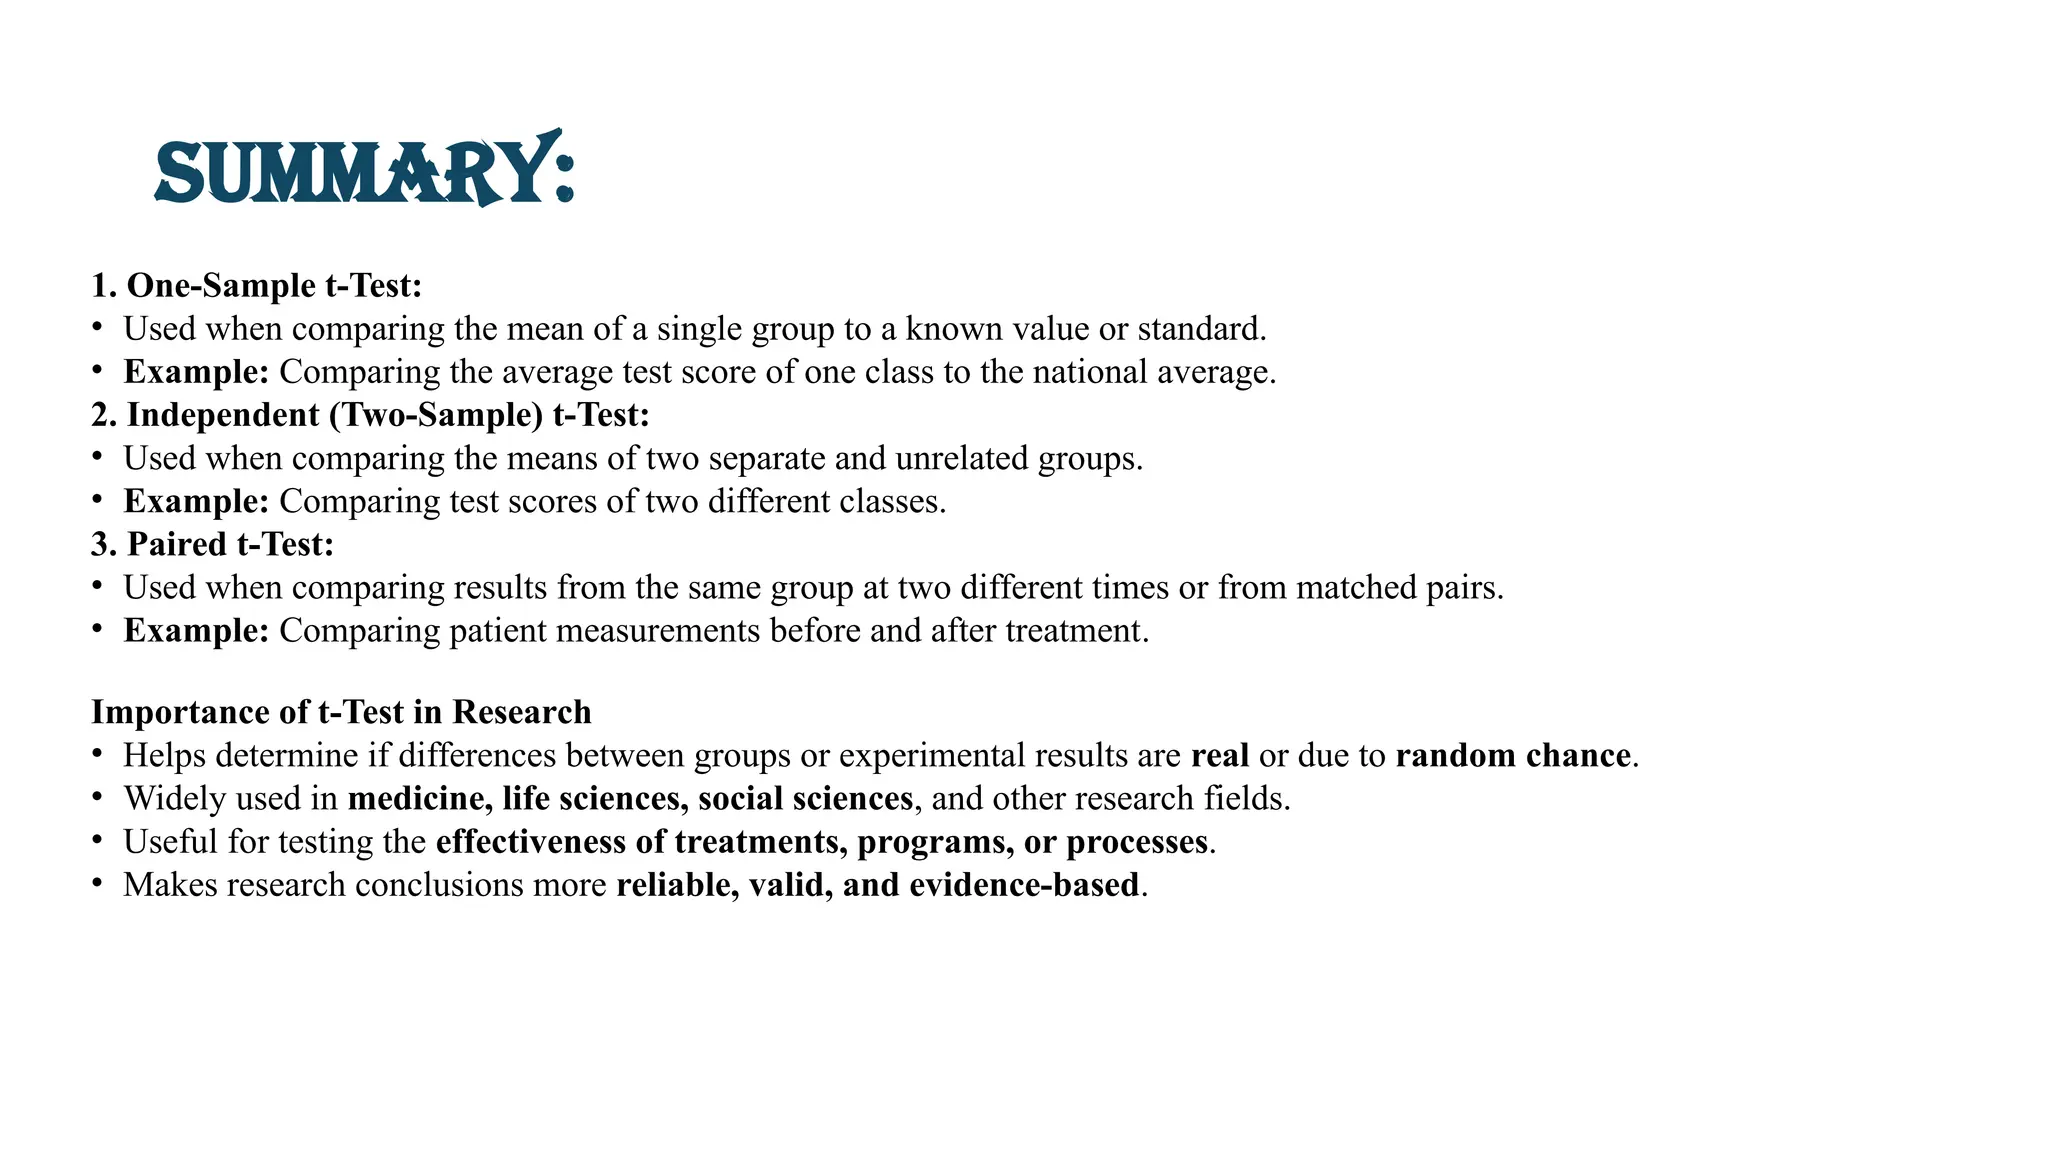
Summary:
1. One-Sample t-Test:
•Used when comparing the mean of a single group to a known value or standard.
• Example: Comparing the average test score of one class to the national average.
2. Independent (Two-Sample) t-Test:
• Used when comparing the means of two separate and unrelated groups.
• Example: Comparing test scores of two different classes.
3. Paired t-Test:
• Used when comparing results from the same group at two different times or from matched pairs.
• Example: Comparing patient measurements before and after treatment.
Importance of t-Test in Research
• Helps determine if differences between groups or experimental results are real or due to random chance.
• Widely used in medicine, life sciences, social sciences, and other research fields.
• Useful for testing the effectiveness of treatments, programs, or processes.
• Makes research conclusions more reliable, valid, and evidence-based.
12.
Reference:
• Scribbr. (2023).An Introduction to t Tests | Definitions, Formula and Examples. Retrieved from
https://www.scribbr.com
• Investopedia. (2025). T-Test: What It Is With Multiple Formulas and When to Use. Retrieved from
https://www.investopedia.com
• GeeksforGeeks. (2020). T-test. Retrieved from https://www.geeksforgeeks.org


![[DSC Europe 25] Natasha Savic - Agentic AI in Production: Lessons from Real-W...](https://cdn.slidesharecdn.com/ss_thumbnails/91fscf7rraabydlmw6xj-natasha-savic-251127093914-7098d487-thumbnail.jpg?width=640&height=640&fit=bounds)


![[DSC Europe 25] Ivan Popovic-E2E AI in Automotive.pdf](https://cdn.slidesharecdn.com/ss_thumbnails/yuhhdbnnsaw6oml183zt-2-dsc-ivan-popovic-e2e-ai-in-automotive-251127093914-09d09072-thumbnail.jpg?width=640&height=640&fit=bounds)


