Parametric and Non-Parametric
Statisticsin Social Science Research
Prof. Ashutosh Biswal
Centre of Advanced Studies in Education (CASE)
Department of Education
Faculty of Education & Psychology
The M.S. University of Baroda
Vadodara-390002
Email: ab9825668982@gmail.com
Quantitative Research: Itfollows Positivist and
empiricist tradition. It is nomothetic in nature and
assumes social reality in objective way.
Qualitative research: Another school of research
has post positivistic dominance emphasizes on
Phenomenological, naturalistic enquiry,
ethnography, subjective enquiry. It is limited to
our discussion.
4.
Scaling in Measurement
NominalScale or Classificatory Scale
Use number or symbols as nomenclature.
It is also used for the purpose of identify the group.
Only operations used are equivalence (=) and not
equivalent (#) like x=y.
Basic statistics used- non-parametric statistics such as,
frequency, mode, percentages, proportions for descriptive
purpose; Chi-square test and Binomial tests for testing
hypothesis and ; contingency coefficient for the
measurement of association etc.
5.
Ordinal Scale
Categoriesare ordered on some continuum or dimension
like arranging in an order like ranks.
The operations involved are >,= and <.
It has all the characteristics of Nominal scale.
Basic statistics used are ranking or order statistics mostly
non-parametric in Nature.
Descriptive statistics such as, median, quartile, QD,
percentile; Statistics for Correlations like, Spearman’s
rank order correlation, Kendall r, Kendall W. Median test,
Mann-Whitney U test, and Wilcoxon Matched-Pairs test.
for testing of hypothesis.
6.
Interval Scale
Theyhave all the characteristics of ordinal scale having an
additional property that numerically equal distances on the
scale represent equal distances on the dimension being
measured.
It has no absolute zero point. The zero point and the unit of
measurement are arbitrary.
All the arithmetic operations are possible with the data in
interval scale.
All higher order both parametric and non-parametric
statistics are possible.
7.
Ratio Scale
Allthe characteristics of interval plus the existence of
absolute or true zero as its origin.
All higher order statistics along with the Geometrical
mean and the coefficient of variation which require
knowledge of true zero is applicable. It is widely used
in Physical science research.
8.
Statistics and Parameter
Parameter(related to population): It is a number
or quantity that describes some characteristics of a
population.
Statistics (related to sample): These are the
quantities that describe the characteristics of a
sample.
Using statistical inference (inductive reasoning
and theory of probability.
9.
Level of Significanceand Sample size
Level of Significance: Also denoted as alpha or
α, is the probability of rejecting the null
hypothesis when it is true
0.05 and 0.01 mainly used in social science.
Sample size >30 statistically called as a large
sample. (The law of large number)
Decision making and testing of null hypothesis
10.
Type I (alpha)and II (bita) errors:
Type I error (α) occurs when a null hypothesis is rejected
falsely when in fact it is true.
Type II error (β) occurs when a null hypothesis is
accepted falsely when in fact it is false
.
11.
The Central LimitTheorem
The sampling distribution of the means of any
independent, random variable will be normal or
nearly normal, if the sample size is large enough
regardless of the distribution of the parent
population.
The distribution of means will increasingly
approximate a normal distribution as the size N
of samples increases. (Explanation)
12.
Choosing An AppropriateStatistical Test
1. The manner in which the sample of scores was drawn.
2. The nature of the population distribution from which the
sample was drawn.
3. The kind of measurement or scaling employed in the
operational definition of variables.
4. Condition of statistical model i.e. assumptions of a test.
5. The power of a statistical test:
13.
Types of Statistics-Parametric
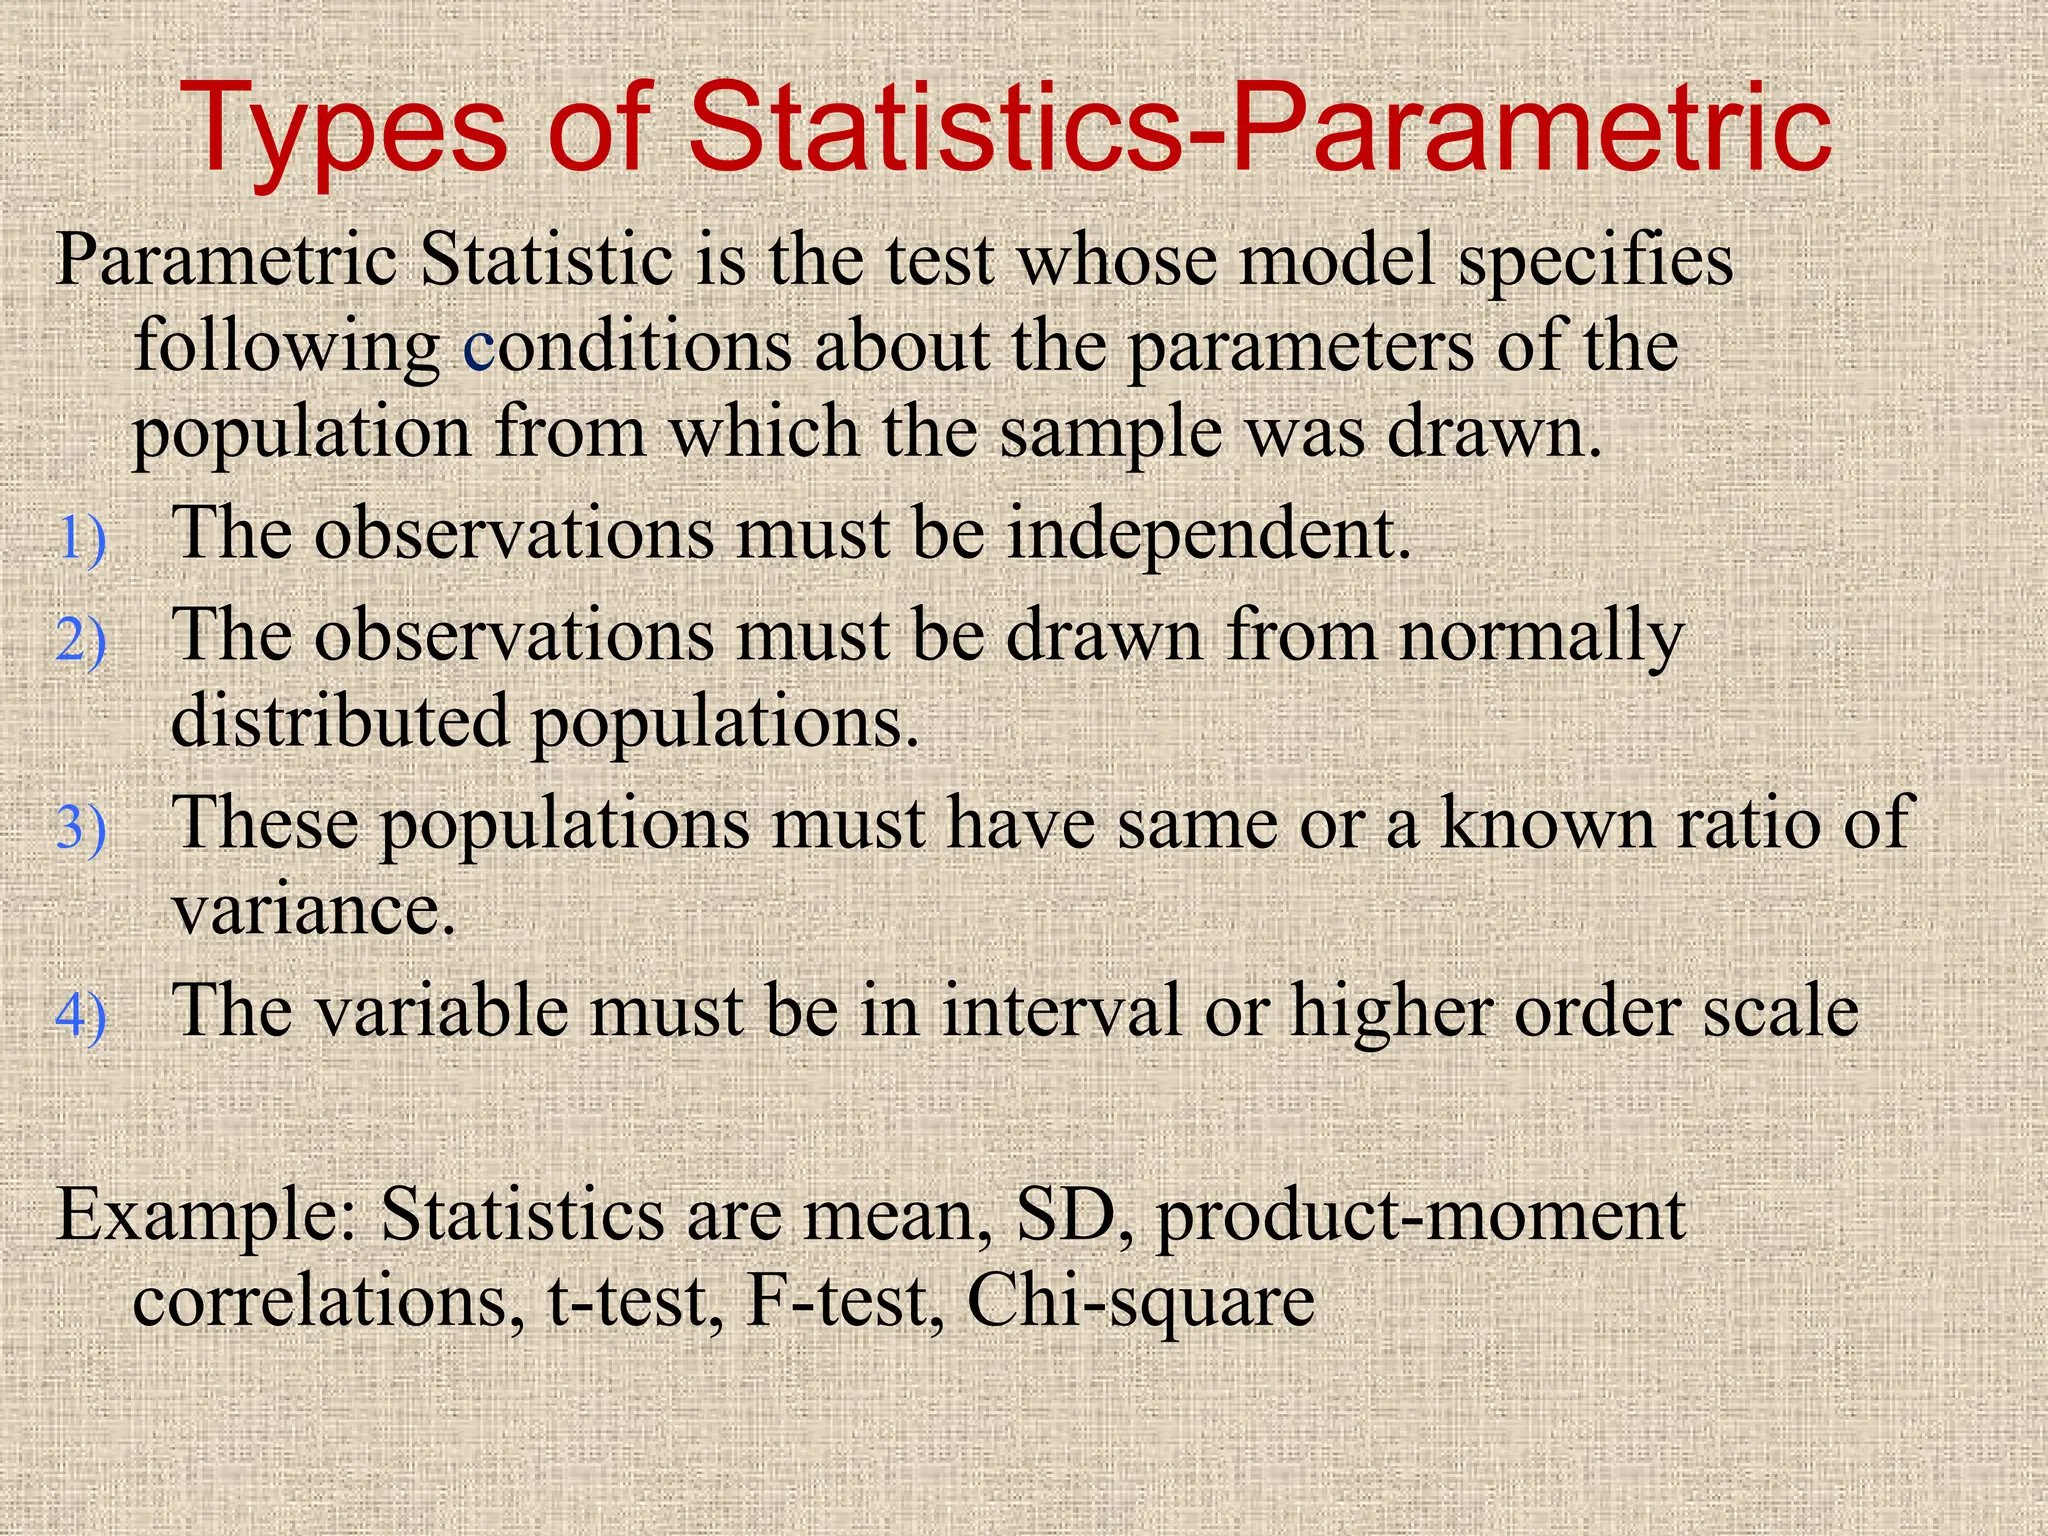
ParametricStatistic is the test whose model specifies
following conditions about the parameters of the
population from which the sample was drawn.
1) The observations must be independent.
2) The observations must be drawn from normally
distributed populations.
3) These populations must have same or a known ratio of
variance.
4) The variable must be in interval or higher order scale
Example: Statistics are mean, SD, product-moment
correlations, t-test, F-test, Chi-square
14.
Non Parametric Statistic
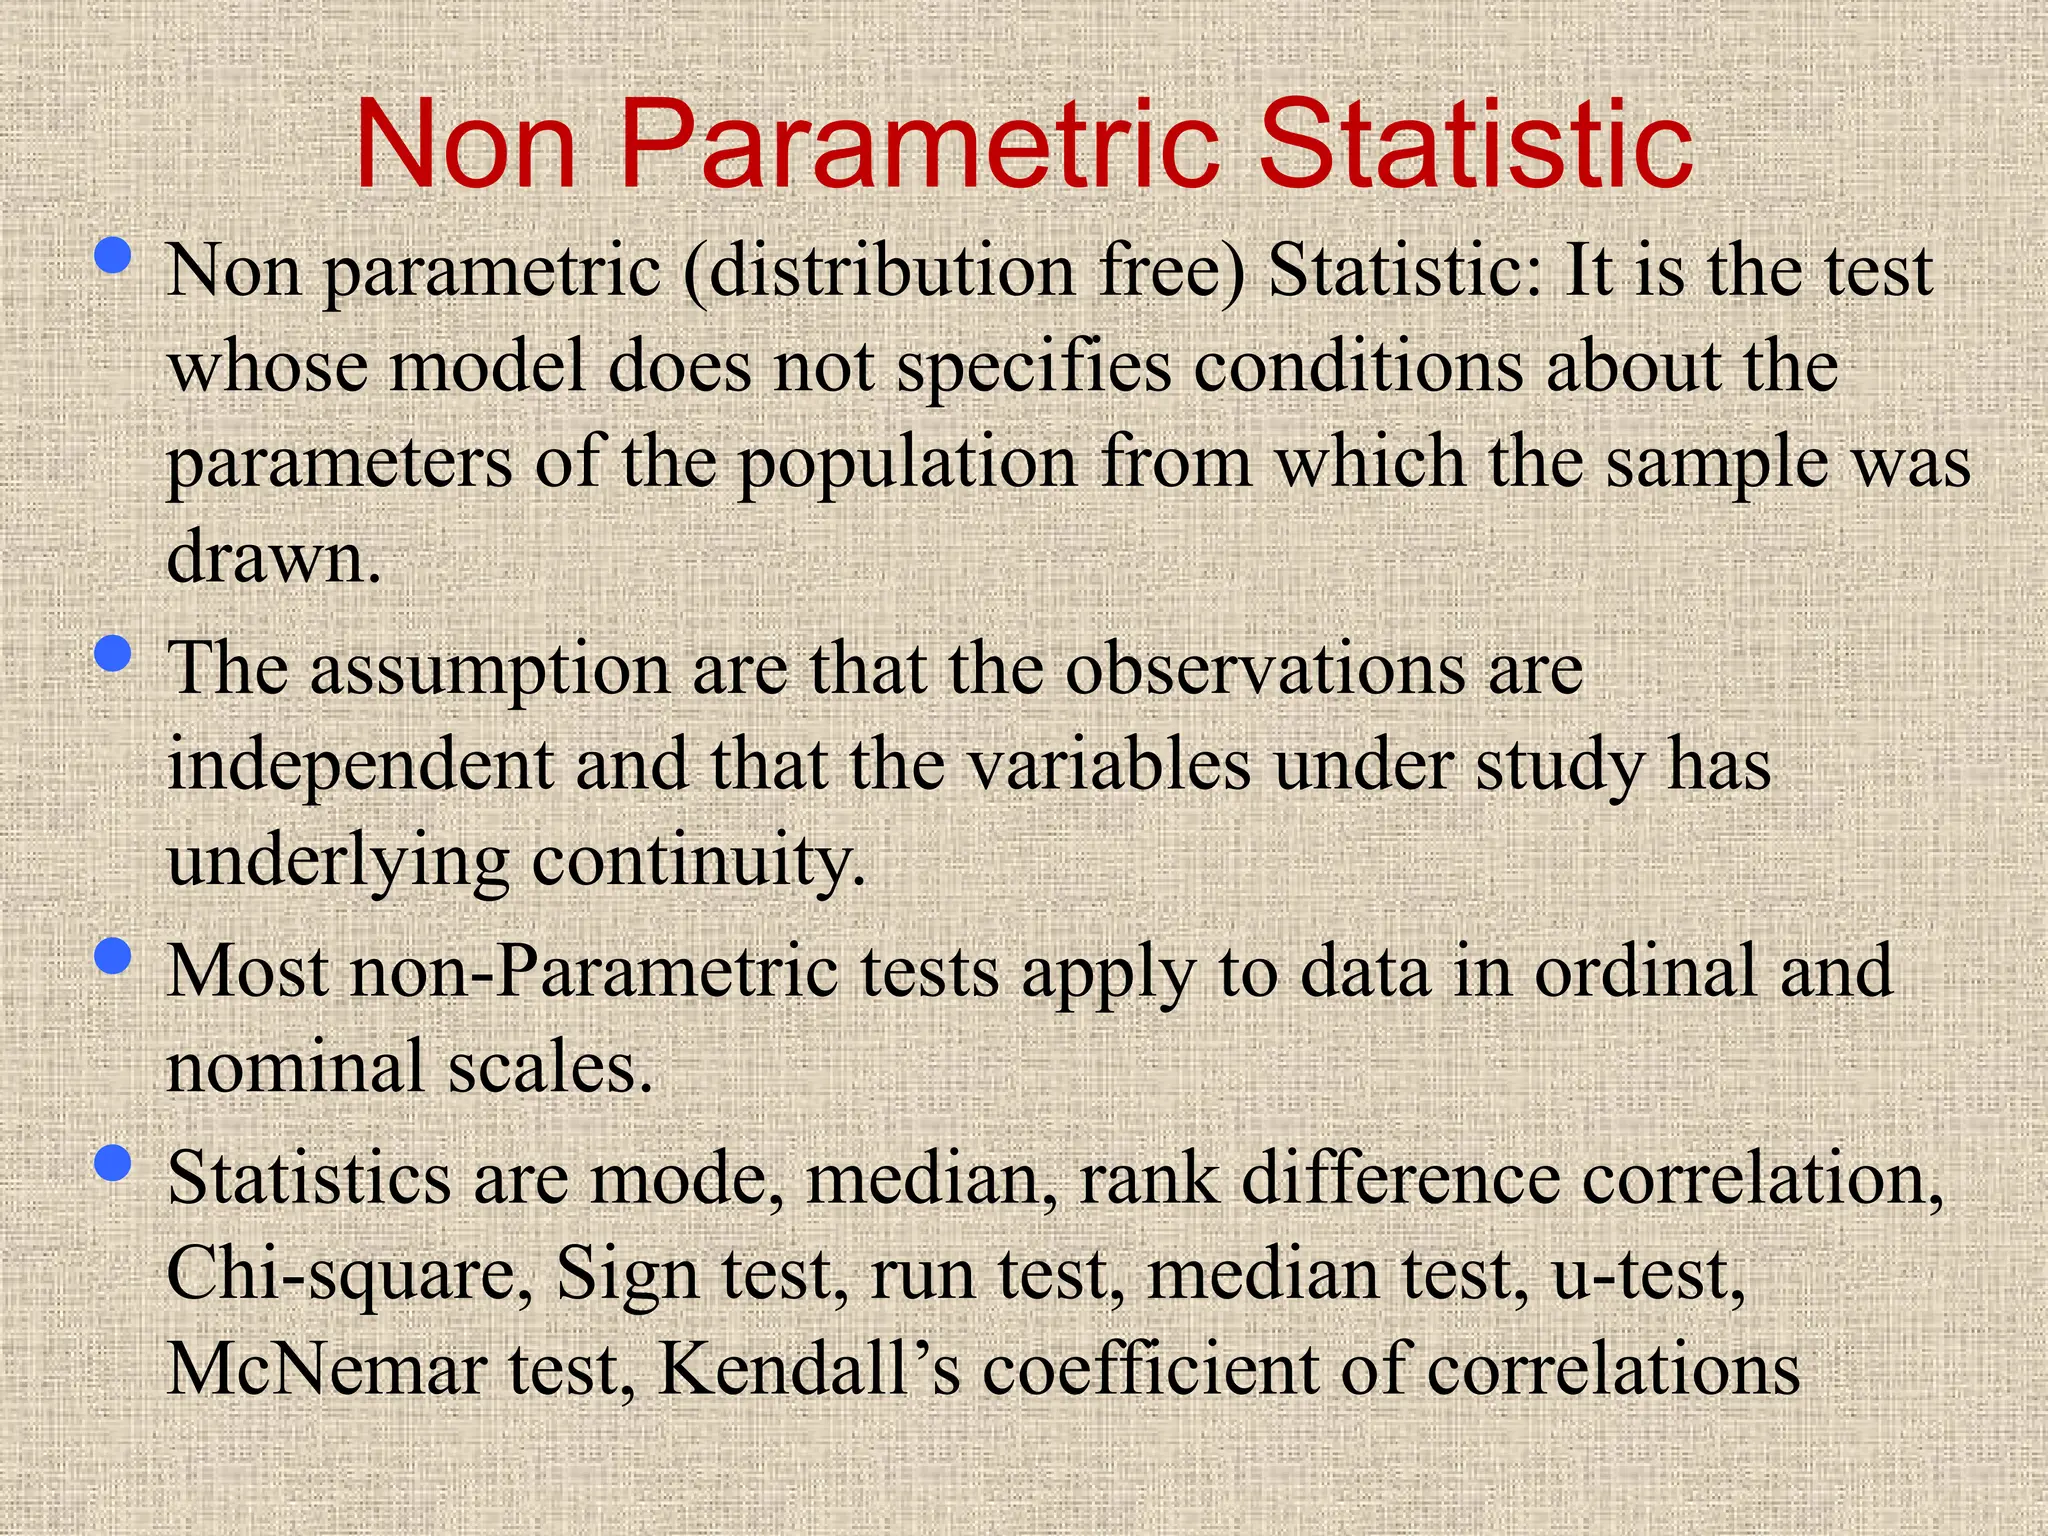
Non parametric (distribution free) Statistic: It is the test
whose model does not specifies conditions about the
parameters of the population from which the sample was
drawn.
The assumption are that the observations are
independent and that the variables under study has
underlying continuity.
Most non-Parametric tests apply to data in ordinal and
nominal scales.
Statistics are mode, median, rank difference correlation,
Chi-square, Sign test, run test, median test, u-test,
McNemar test, Kendall’s coefficient of correlations
15.
Basic Descriptive Statistics(one Variable)
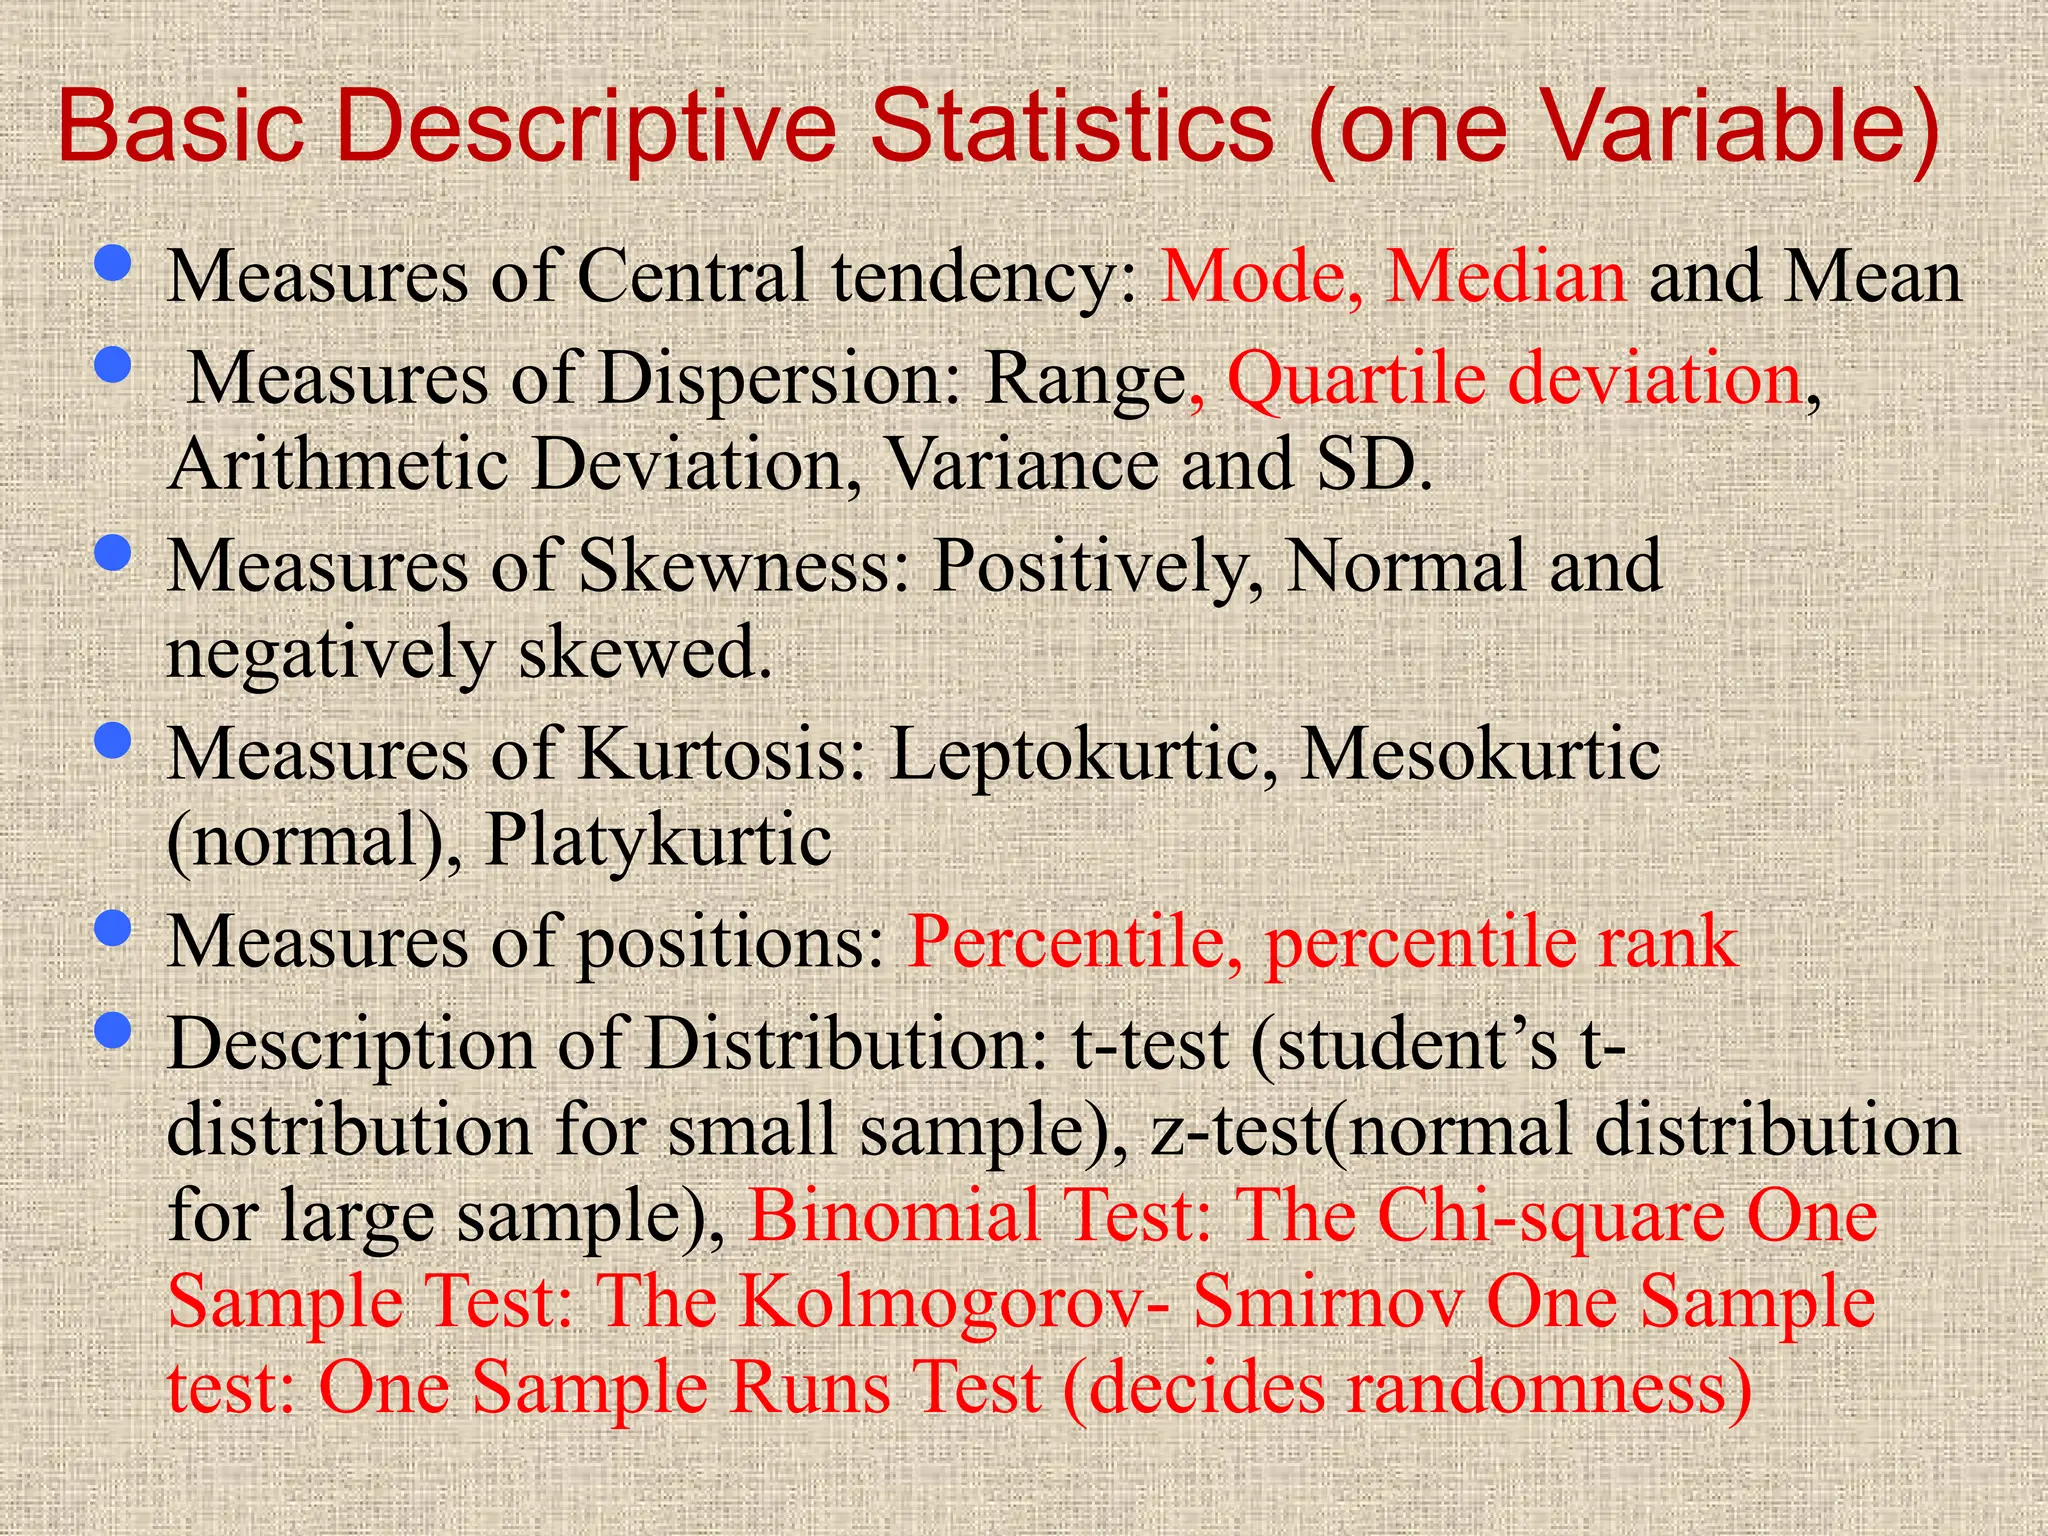
Measures of Central tendency: Mode, Median and Mean
Measures of Dispersion: Range, Quartile deviation,
Arithmetic Deviation, Variance and SD.
Measures of Skewness: Positively, Normal and
negatively skewed.
Measures of Kurtosis: Leptokurtic, Mesokurtic
(normal), Platykurtic
Measures of positions: Percentile, percentile rank
Description of Distribution: t-test (student’s t-
distribution for small sample), z-test(normal distribution
for large sample), Binomial Test: The Chi-square One
Sample Test: The Kolmogorov- Smirnov One Sample
test: One Sample Runs Test (decides randomness)
16.
Descriptive Statistics (Multivariable
Statistics)
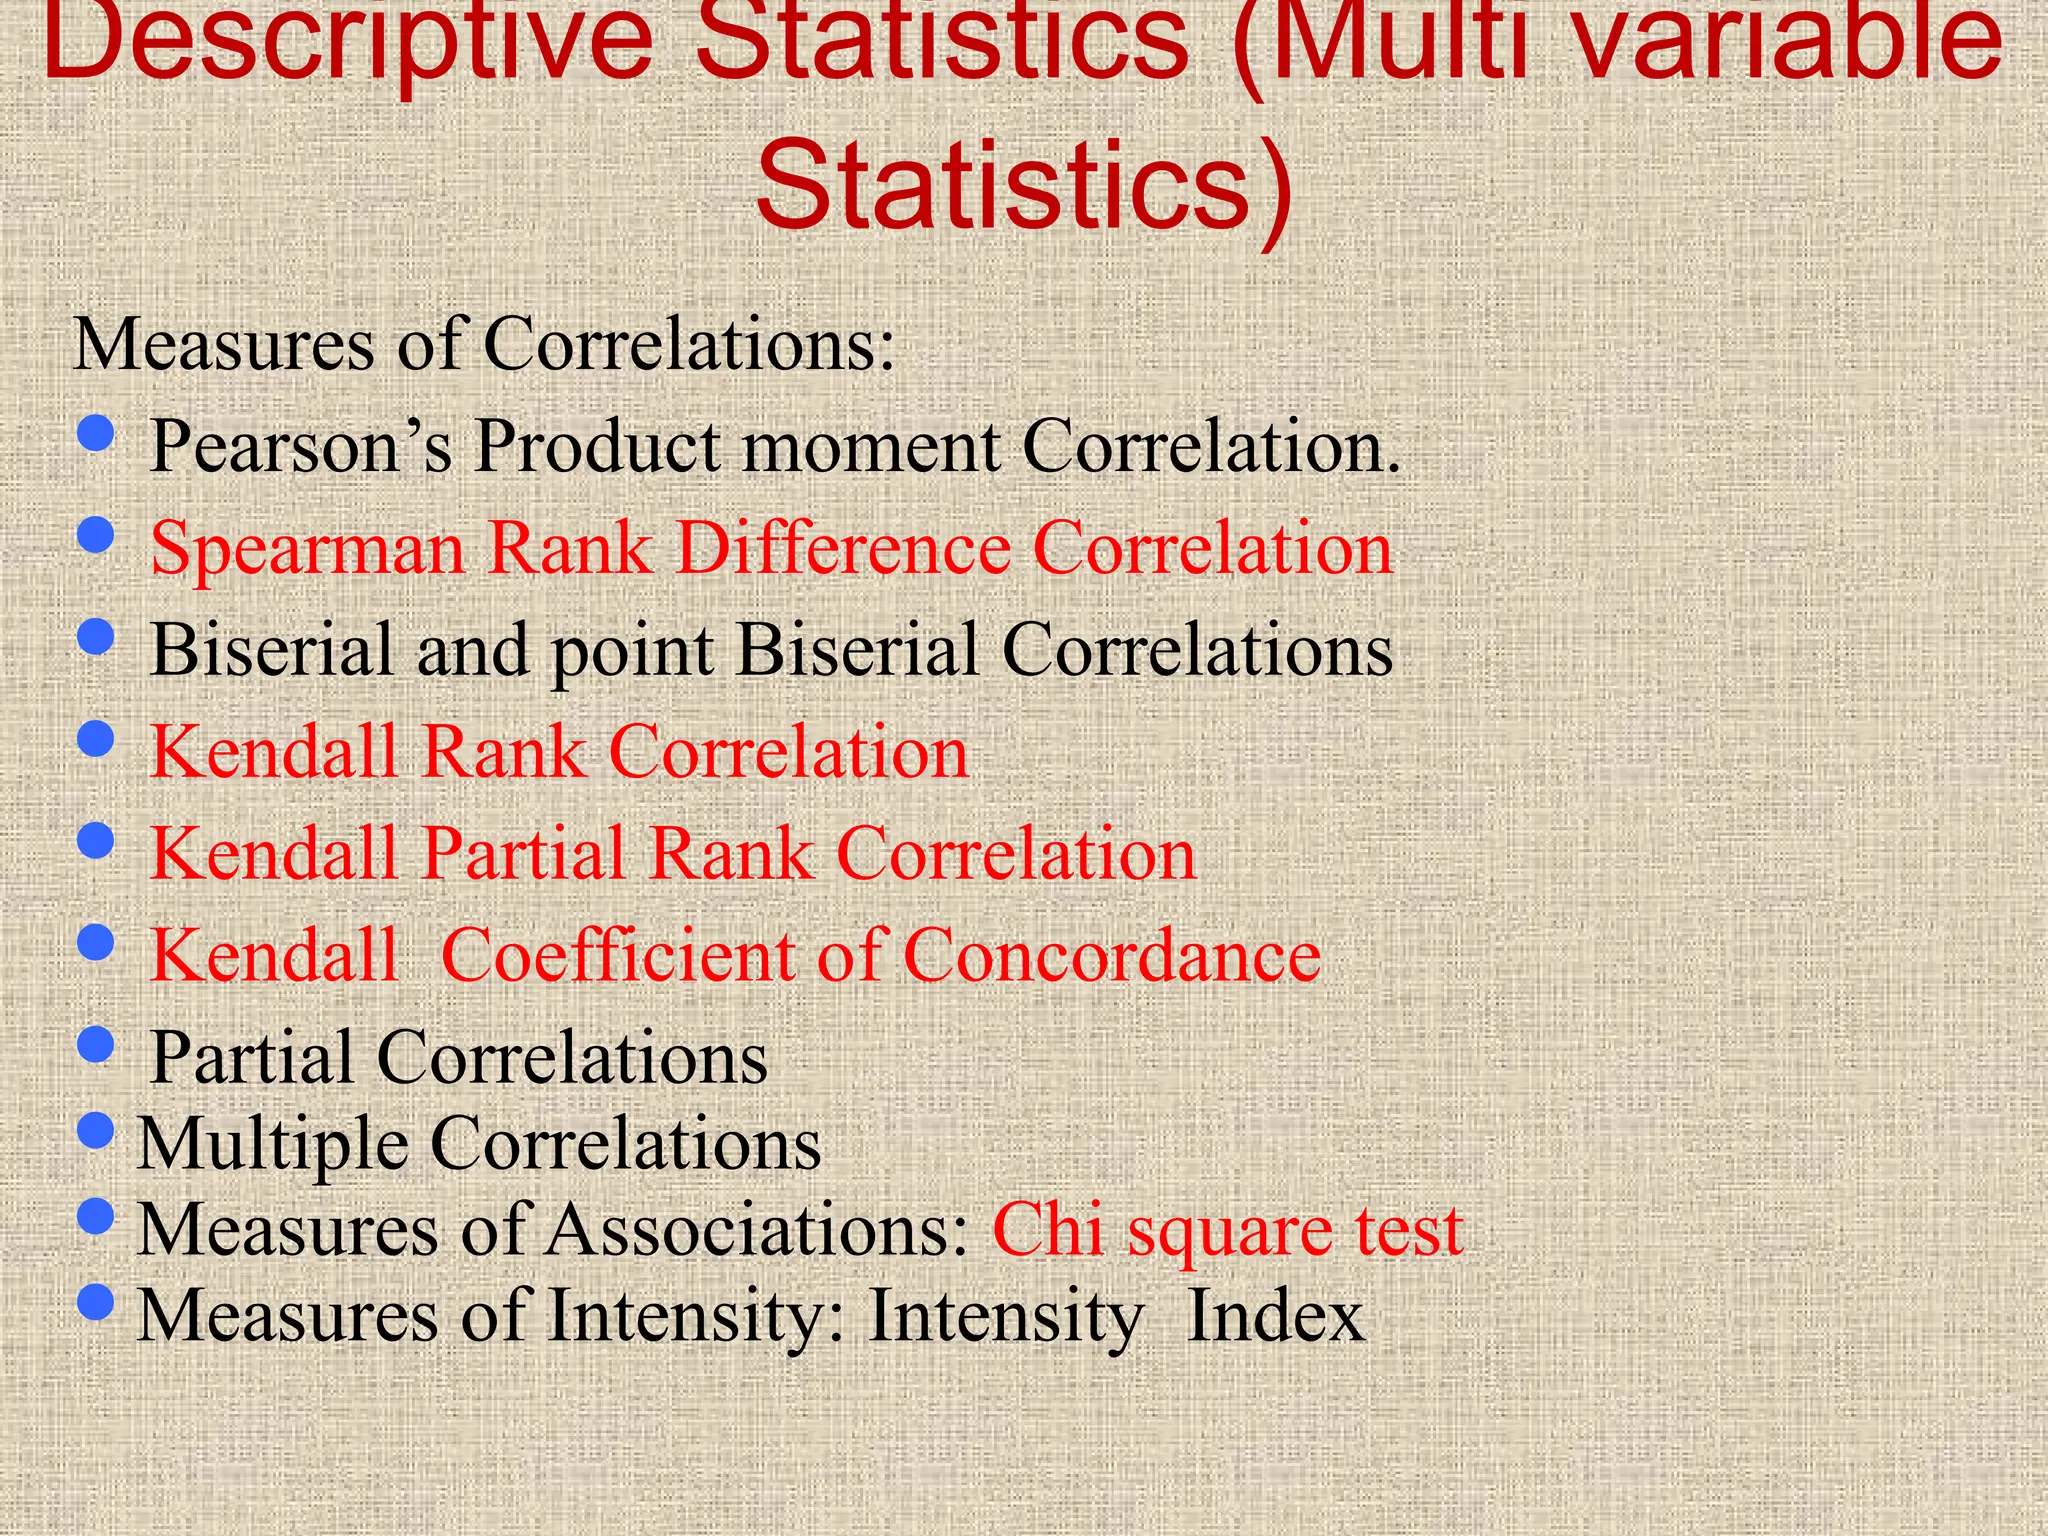
Measures of Correlations:
Pearson’s Product moment Correlation.
Spearman Rank Difference Correlation
Biserial and point Biserial Correlations
Kendall Rank Correlation
Kendall Partial Rank Correlation
Kendall Coefficient of Concordance
Partial Correlations
Multiple Correlations
Measures of Associations: Chi square test
Measures of Intensity: Intensity Index
17.
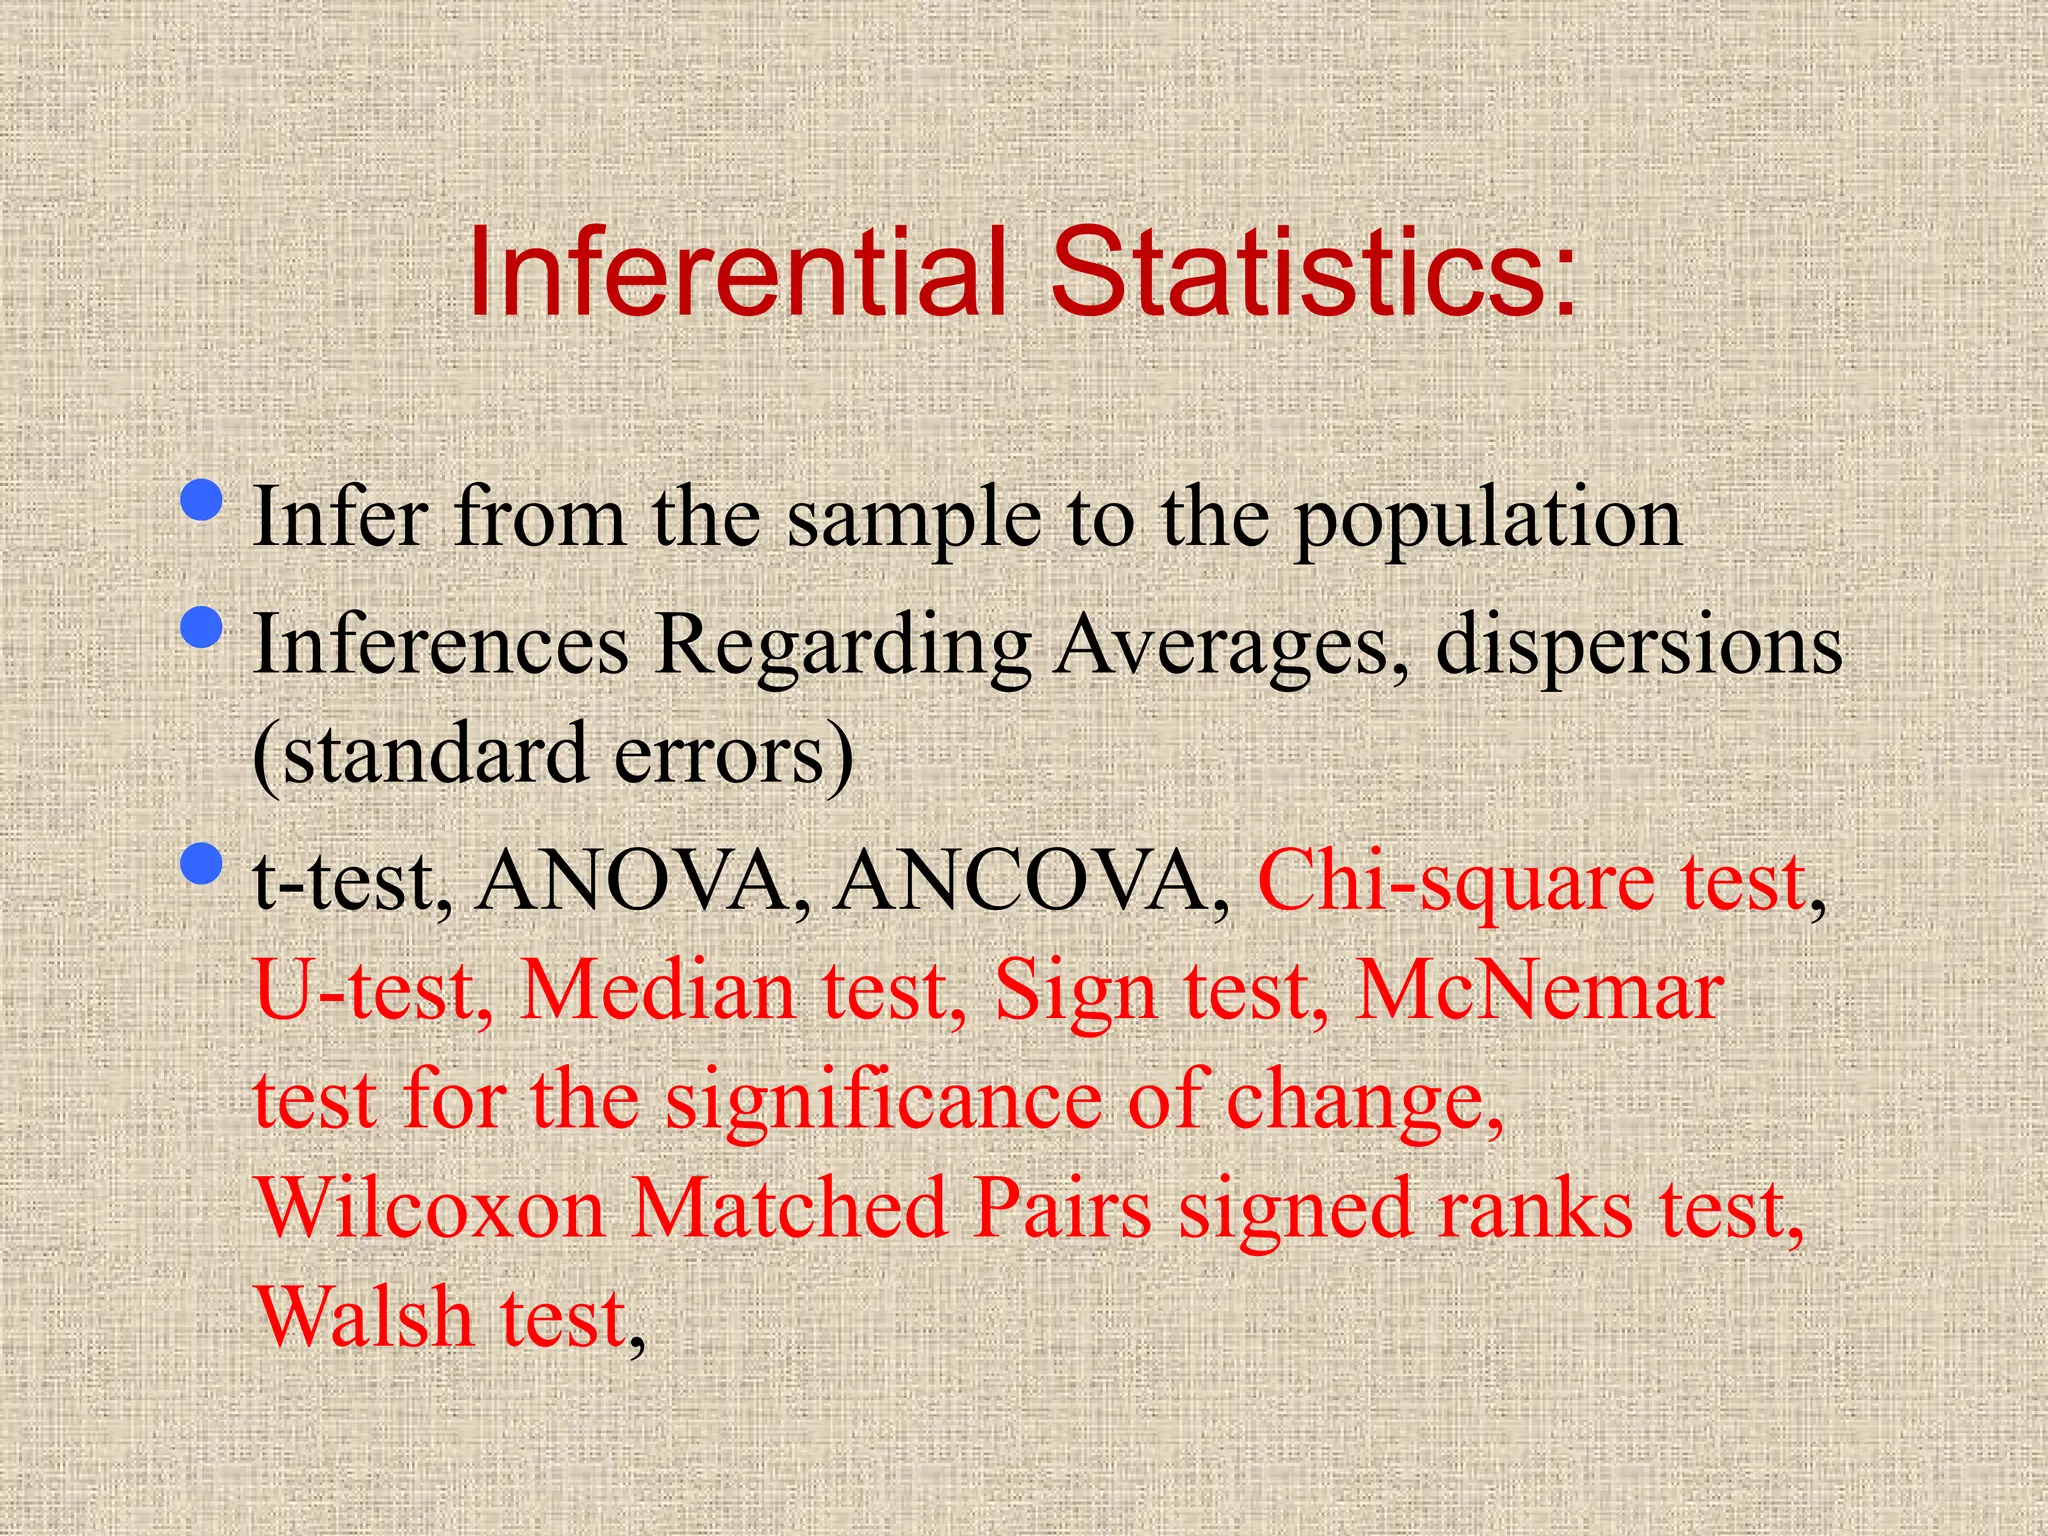
Inferential Statistics:
Infer fromthe sample to the population
Inferences Regarding Averages, dispersions
(standard errors)
t-test, ANOVA, ANCOVA, Chi-square test,
U-test, Median test, Sign test, McNemar
test for the significance of change,
Wilcoxon Matched Pairs signed ranks test,
Walsh test,
18.
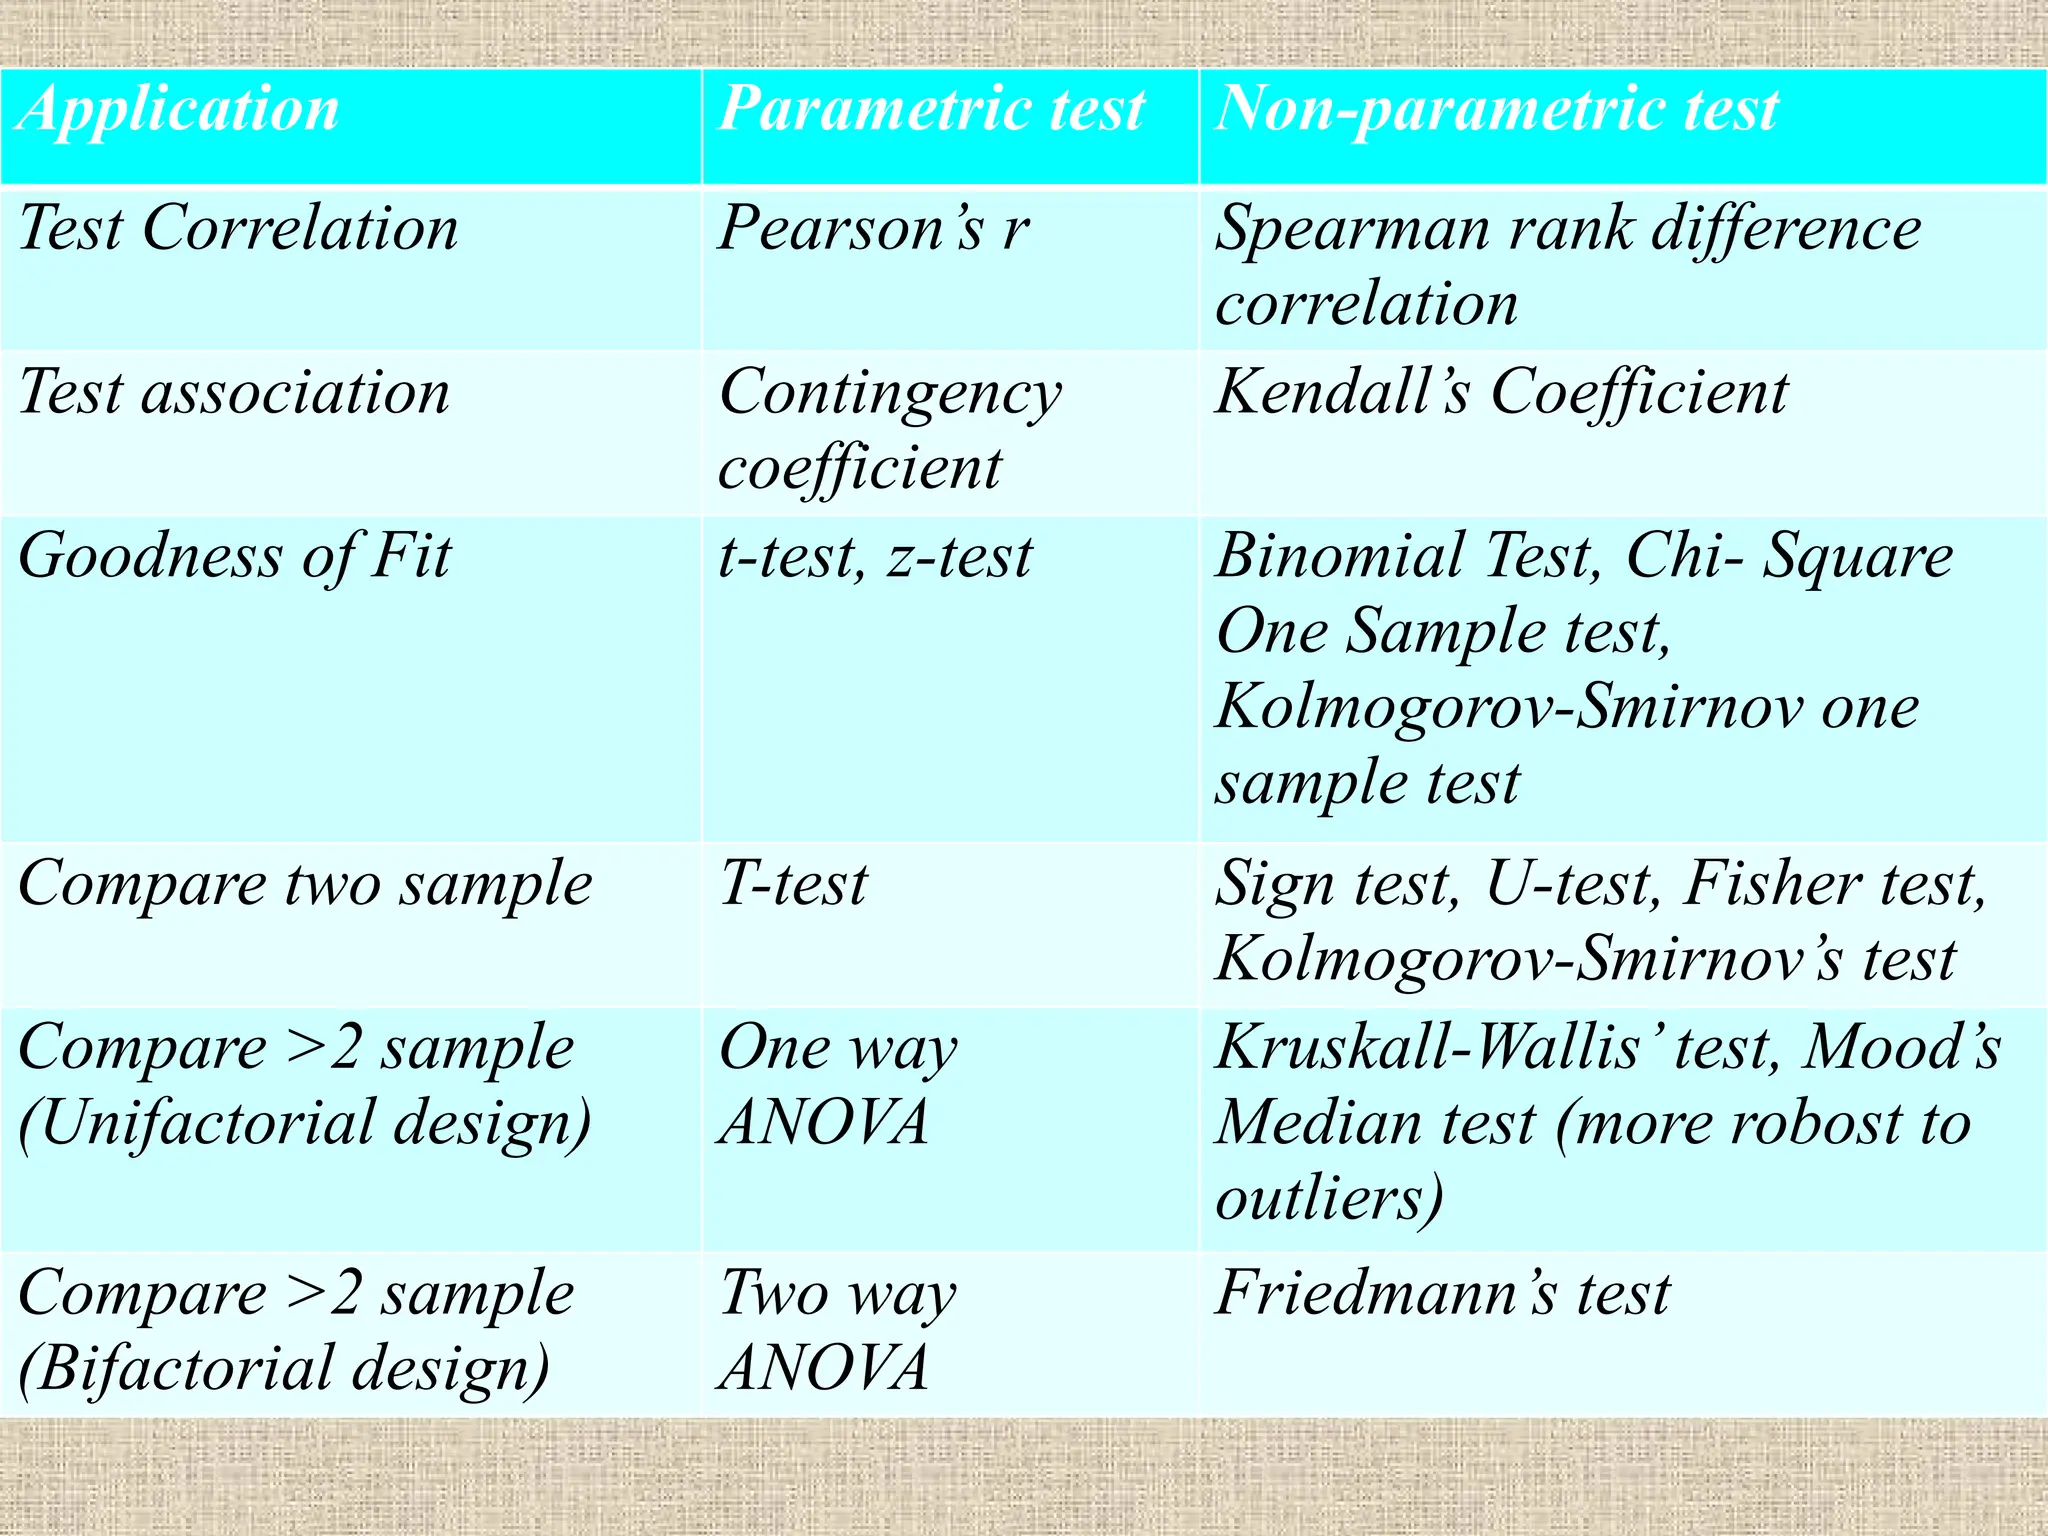
Application Parametric testNon-parametric test
Test Correlation Pearson’s r Spearman rank difference
correlation
Test association Contingency
coefficient
Kendall’s Coefficient
Goodness of Fit t-test, z-test Binomial Test, Chi- Square
One Sample test,
Kolmogorov-Smirnov one
sample test
Compare two sample T-test Sign test, U-test, Fisher test,
Kolmogorov-Smirnov’s test
Compare >2 sample
(Unifactorial design)
One way
ANOVA
Kruskall-Wallis’test, Mood’s
Median test (more robost to
outliers)
Compare >2 sample
(Bifactorial design)
Two way
ANOVA
Friedmann’s test
19.
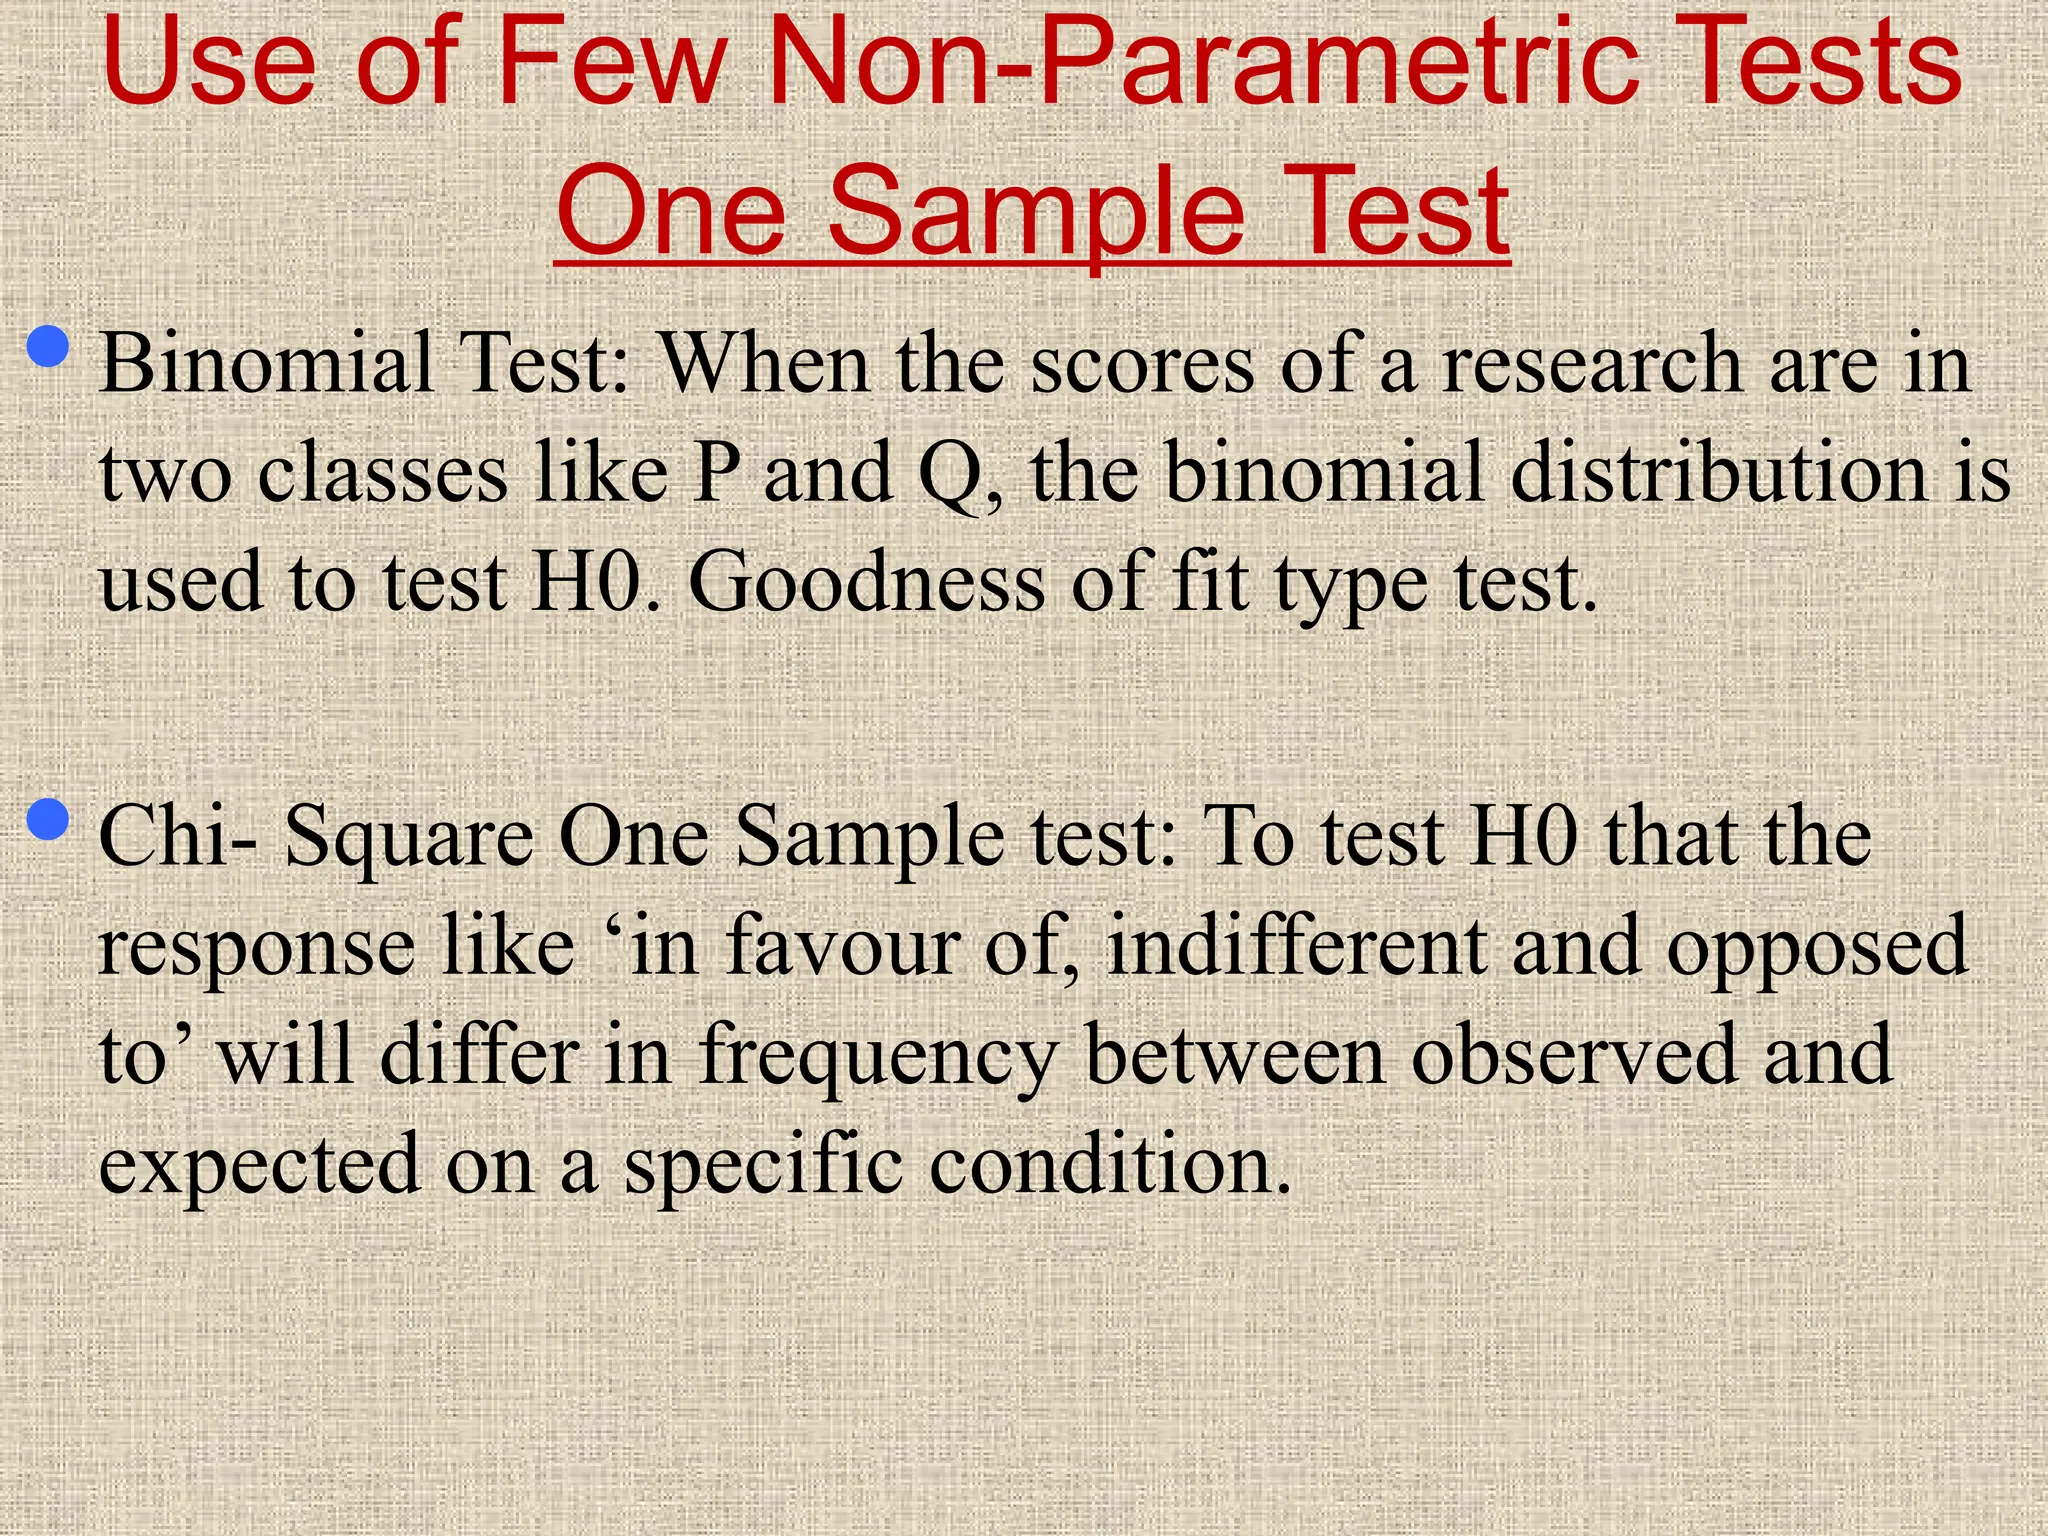
Use of FewNon-Parametric Tests
One Sample Test
Binomial Test: When the scores of a research are in
two classes like P and Q, the binomial distribution is
used to test H0. Goodness of fit type test.
Chi- Square One Sample test: To test H0 that the
response like ‘in favour of, indifferent and opposed
to’ will differ in frequency between observed and
expected on a specific condition.
20.
Sign Test: Atest of the randomness of the
sequence of events in a sample. To know whether
the sample has been taken from a population
randomly.
Kolmogorov-Smirnov one sample test: A test of
Goodness of fit. It determines whether the scores
in the sample can reasonably be thought to have
come from a population having theoretical
distribution.
21.
Two Related Sampletest
McNemar Test for significance of Changes:
Applicable to those “before and after” designs in
which each person is used as his own control and
in which measurement is in the strength of either
a nominal or ordinal scale.
Sign Test: + & - signs. It is applicable to the case
of two related samples to know that two
conditions are different.
22.
Wilcoxon Matched PairsSigned Ranks Test:
It is more powerful test than the Sign test
for similar use as a relative magnitude and
direction of the differences is provided.
Walsh Test: It is used to test whether the
difference scores observed in two related
samples are drawn from symmetrical
population.
23.
Chi-Square Test fortwo independent sample:
Used to determine the significance of
differences between two independent groups.
Median Test: Used for testing whether two
independent groups differ in median. The test
tales whether two independent groups have
been drawn from populations with same median.
Mann-Whitney U test: like t-test to test whether
two independent groups have been drawn from
the same population.
24.
Runs test: Itis applicable when we wish to test
the null hypothesis that two independent
samples have been drawn from the same
population in any respect whatsoever (central
tendency, variability, skewness etc.)
Randomization test for two independent sample:
Used to test the significant difference between
medians of two independent samples when n1
and n2 are small.
25.
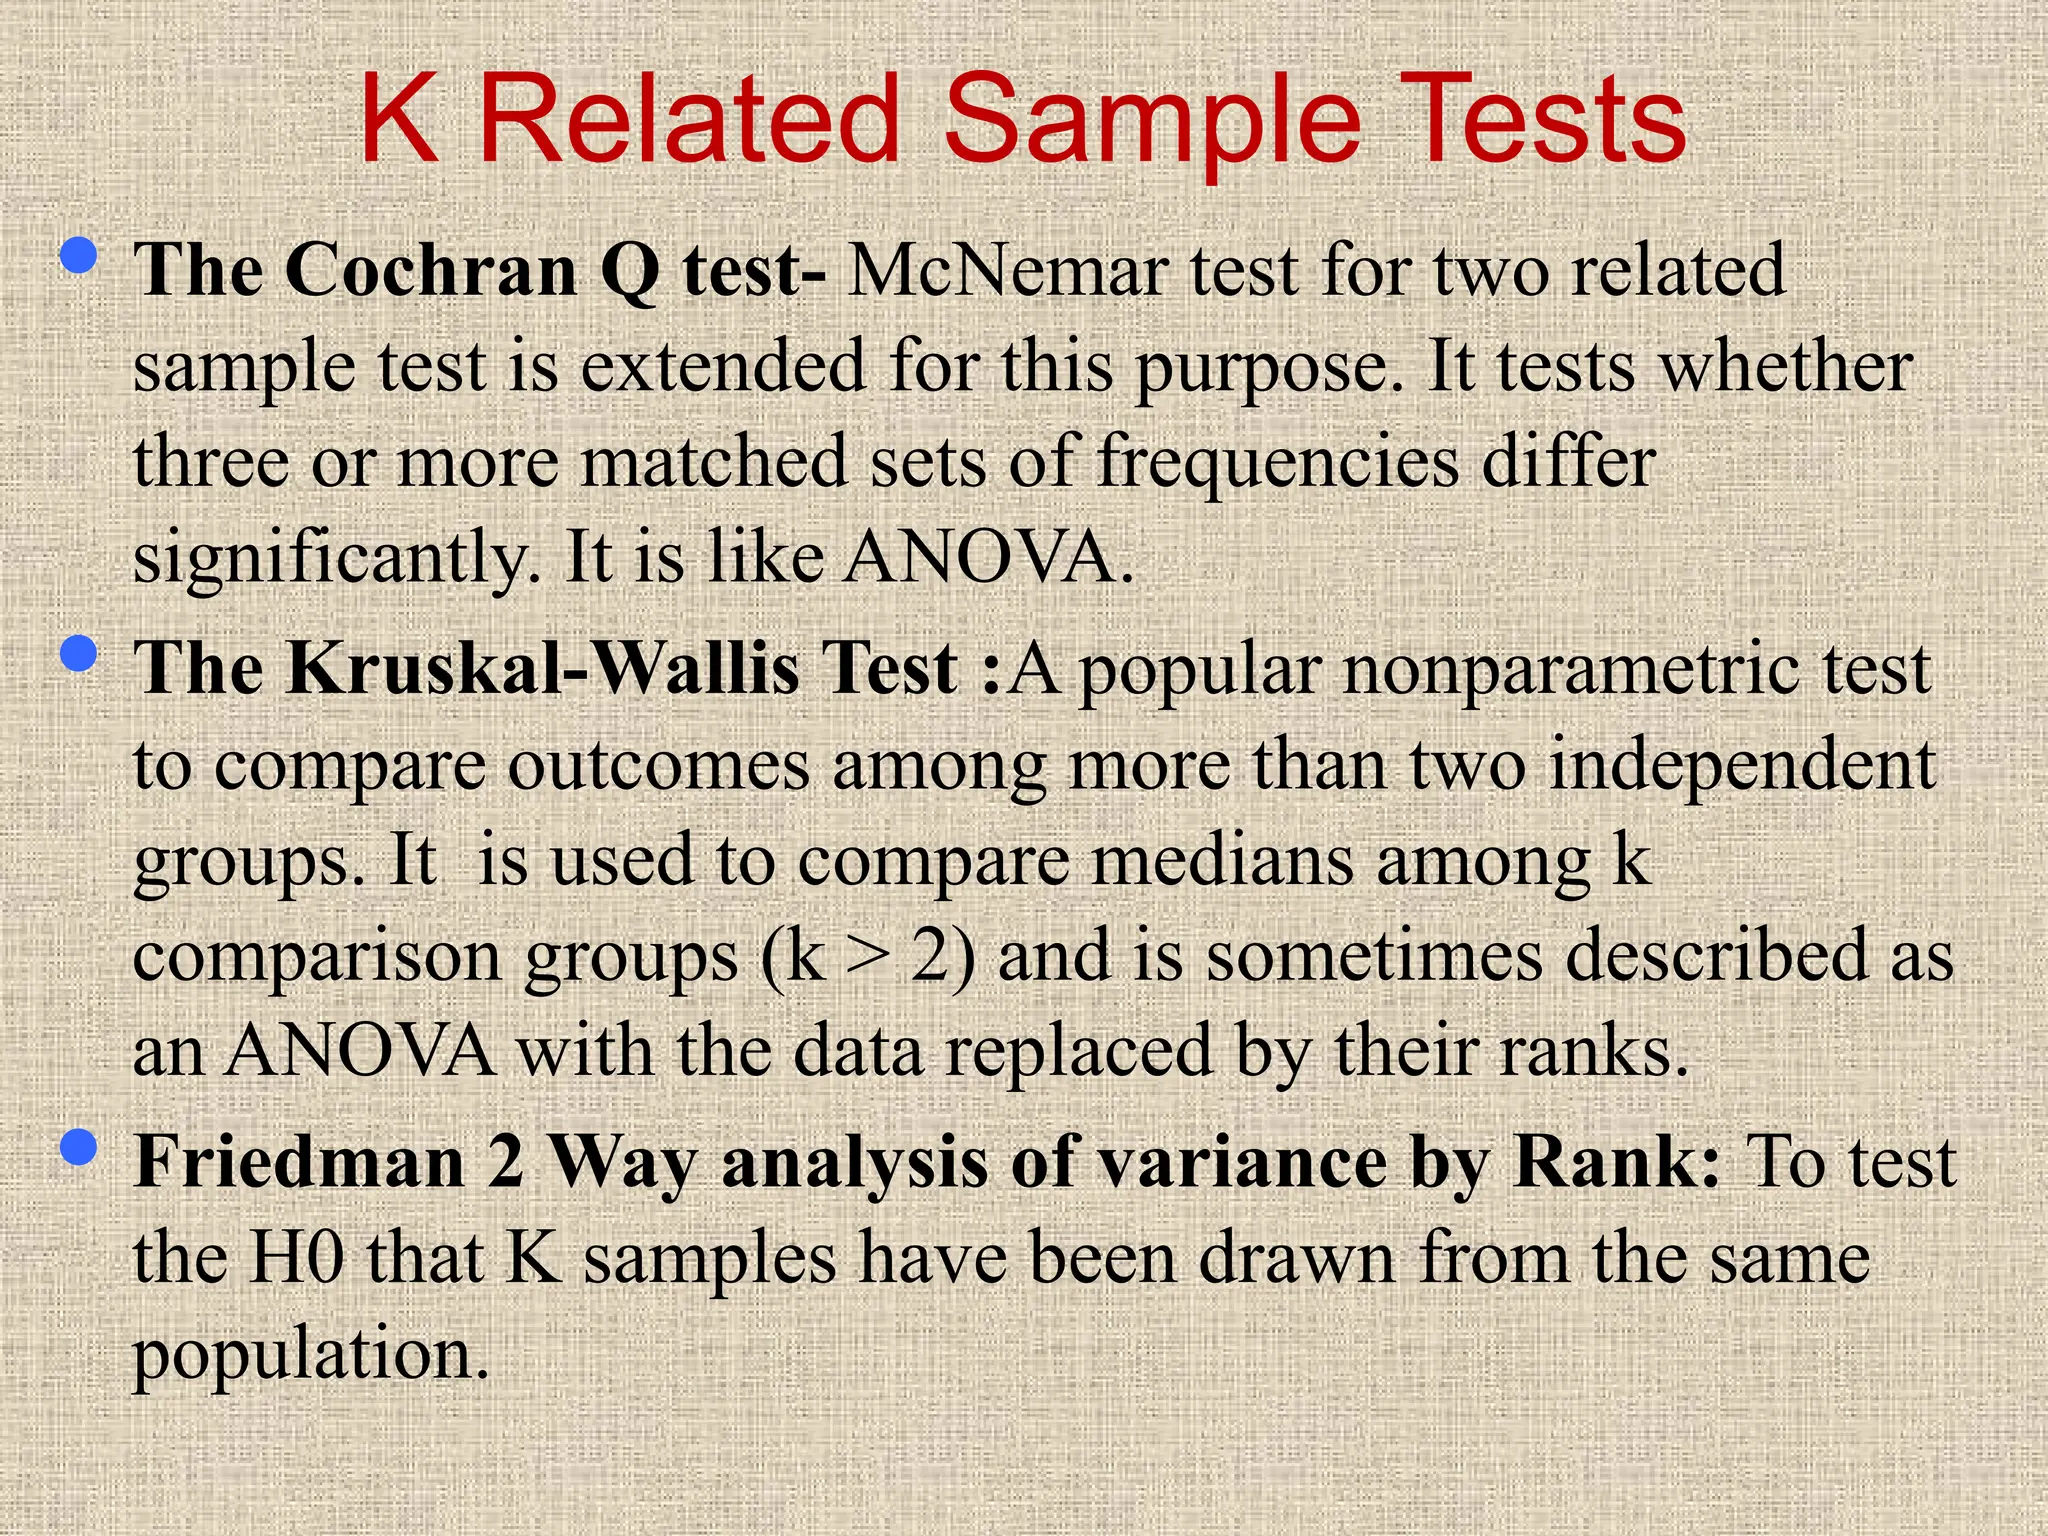
K Related SampleTests
The Cochran Q test- McNemar test for two related
sample test is extended for this purpose. It tests whether
three or more matched sets of frequencies differ
significantly. It is like ANOVA.
The Kruskal-Wallis Test :A popular nonparametric test
to compare outcomes among more than two independent
groups. It is used to compare medians among k
comparison groups (k > 2) and is sometimes described as
an ANOVA with the data replaced by their ranks.
Friedman 2 Way analysis of variance by Rank: To test
the H0 that K samples have been drawn from the same
population.
26.
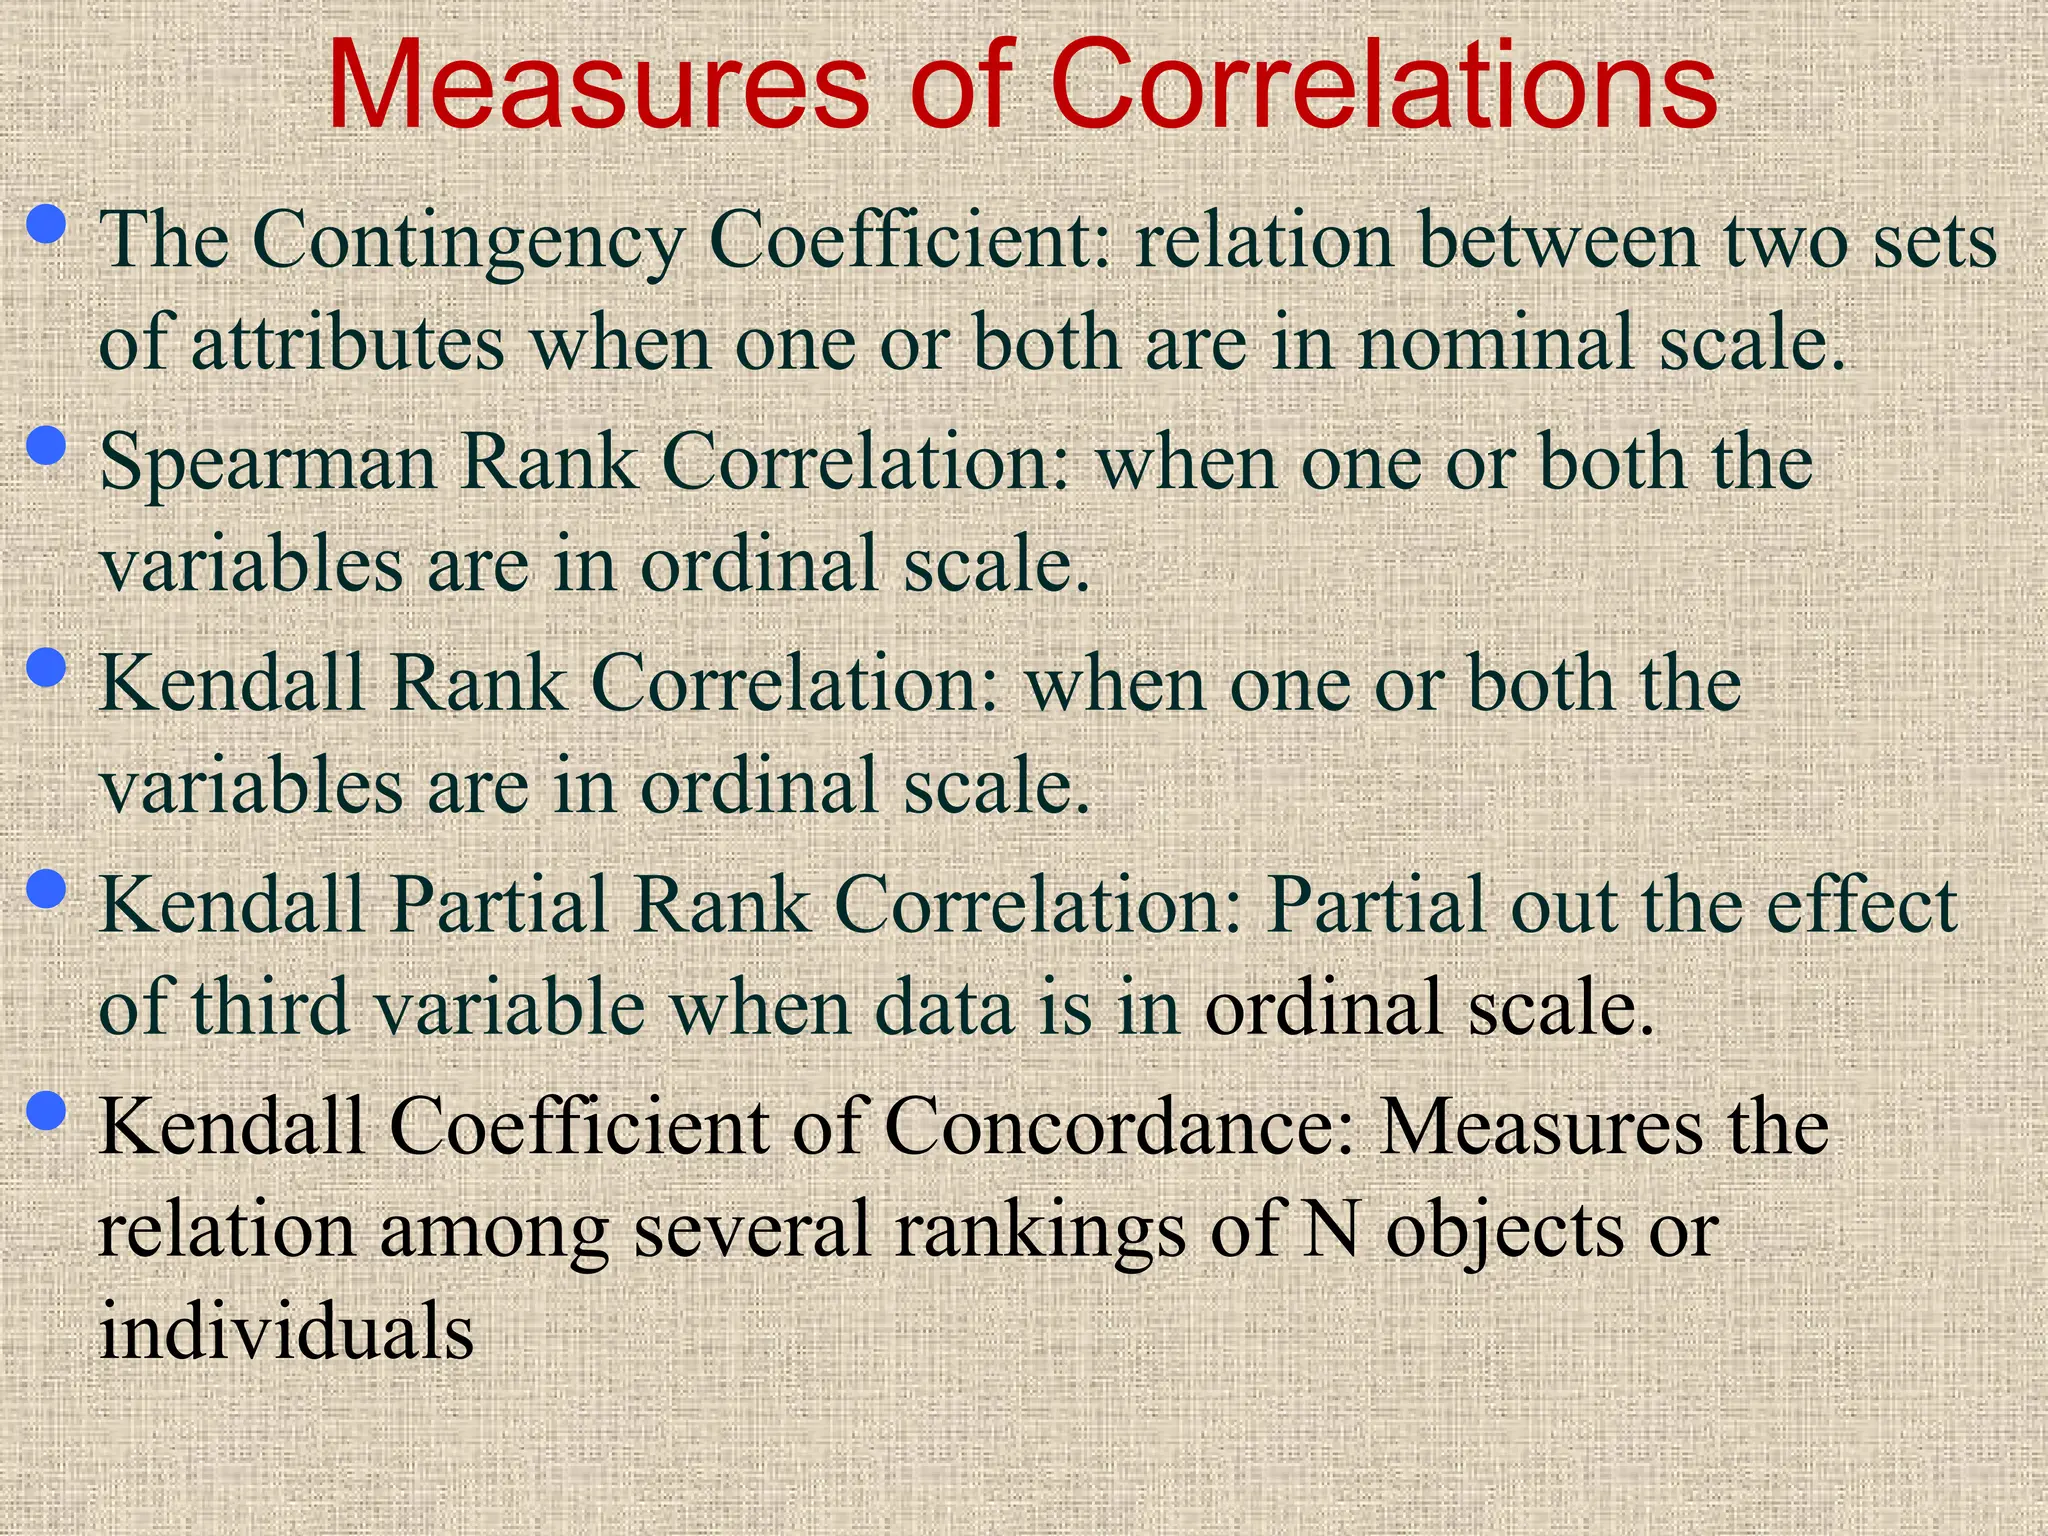
Measures of Correlations
TheContingency Coefficient: relation between two sets
of attributes when one or both are in nominal scale.
Spearman Rank Correlation: when one or both the
variables are in ordinal scale.
Kendall Rank Correlation: when one or both the
variables are in ordinal scale.
Kendall Partial Rank Correlation: Partial out the effect
of third variable when data is in ordinal scale.
Kendall Coefficient of Concordance: Measures the
relation among several rankings of N objects or
individuals